Debug Log Level - foldynl/QLog GitHub Wiki
Under normal circumstances, QLog produces a minimal number of debug messages. The debug messages are printed to standard output (Linux).
QLog implements debug logging via QLoggingCategory. If a user encounters an issue and requires more verbose output, the verbosity can be set via OS's environment variable QT_LOGGING_RULES.
For example, to enable very verbose output:
QT_LOGGING_RULES=*.debug=true ./qlog
To debug only the ADIF formatter, use:
QT_LOGGING_RULES=qlog.logformat.adiformat.*.debug=true ./qlog
To set the environment flag, use the export command in a terminal window, for example:
export QT_LOGGING_RULES=*.debug=true
The QLog application must then be launched from the terminal. If QLog is located in the Applications folder, a command such as the following can be used:
/Applications/qlog.app/Contents/MacOS/qlog
- run
cmd cd c:\Program Files\QLogset QT_LOGGING_RULES=qlog.*=true- run QLog in debug mode; call
qlog.exe -d - exit QLog
- The log is created
c:\Users\<HOME>\AppData\Local\hamradio\QLog\qlog_debug_yyyyMMddhhmmss.log.log
QT_LOGGING_RULES controls which modules produce debug output. If qlog.* is used, the debug log will include messages from all QLog modules, which can result in a very large file. It is therefore recommended to enable only a specific subset of modules (e.g., qlog.rig.*=true).
14:35:17.363 [DEBUG ] [0x7f05083d2440] [qlog.logformat.adiformat.function.entered] => OUTPUT [void AdiFormat::writeField(QString, QString, QString):../QLog/logformat/AdiFormat.cpp:201]
where
-
14:35:17.363- a timestamp -
[DEBUG ]- a severity -
[0x7f05083d2440]- Thread ID -
[qlog.logformat.adiformat.function.entered]- logging category -
OUTPUT- debug message -
[void AdiFormat::writeField(QString, QString, QString):../QLog/logformat/AdiFormat.cpp:201]- source code entry
The Severity levels can be :
CriticalDebugInfoWarning
The Logging Category specifies which part of the program the debug report was called from.
The above procedure will display all debug messages to the command line (except Windows platform). If saving debug messages to a file is required, it is necessary to run Qlog with the -d switch, which will cause everything to be saved to a file qlog_debug_yyyyMMddhhmmss.log in folder:
-
Linux -
$HOME/.local/share/hamradio/QLog -
Linux - flatpak -
$HOME/.var/app/io.github.foldynl.QLog/data/hamradio/QLog -
Windows -
C:/Users/<USER>/AppData/Local/hamradio/QLog -
MacOS -
$HOME/library/Application support/hamradio/qlog
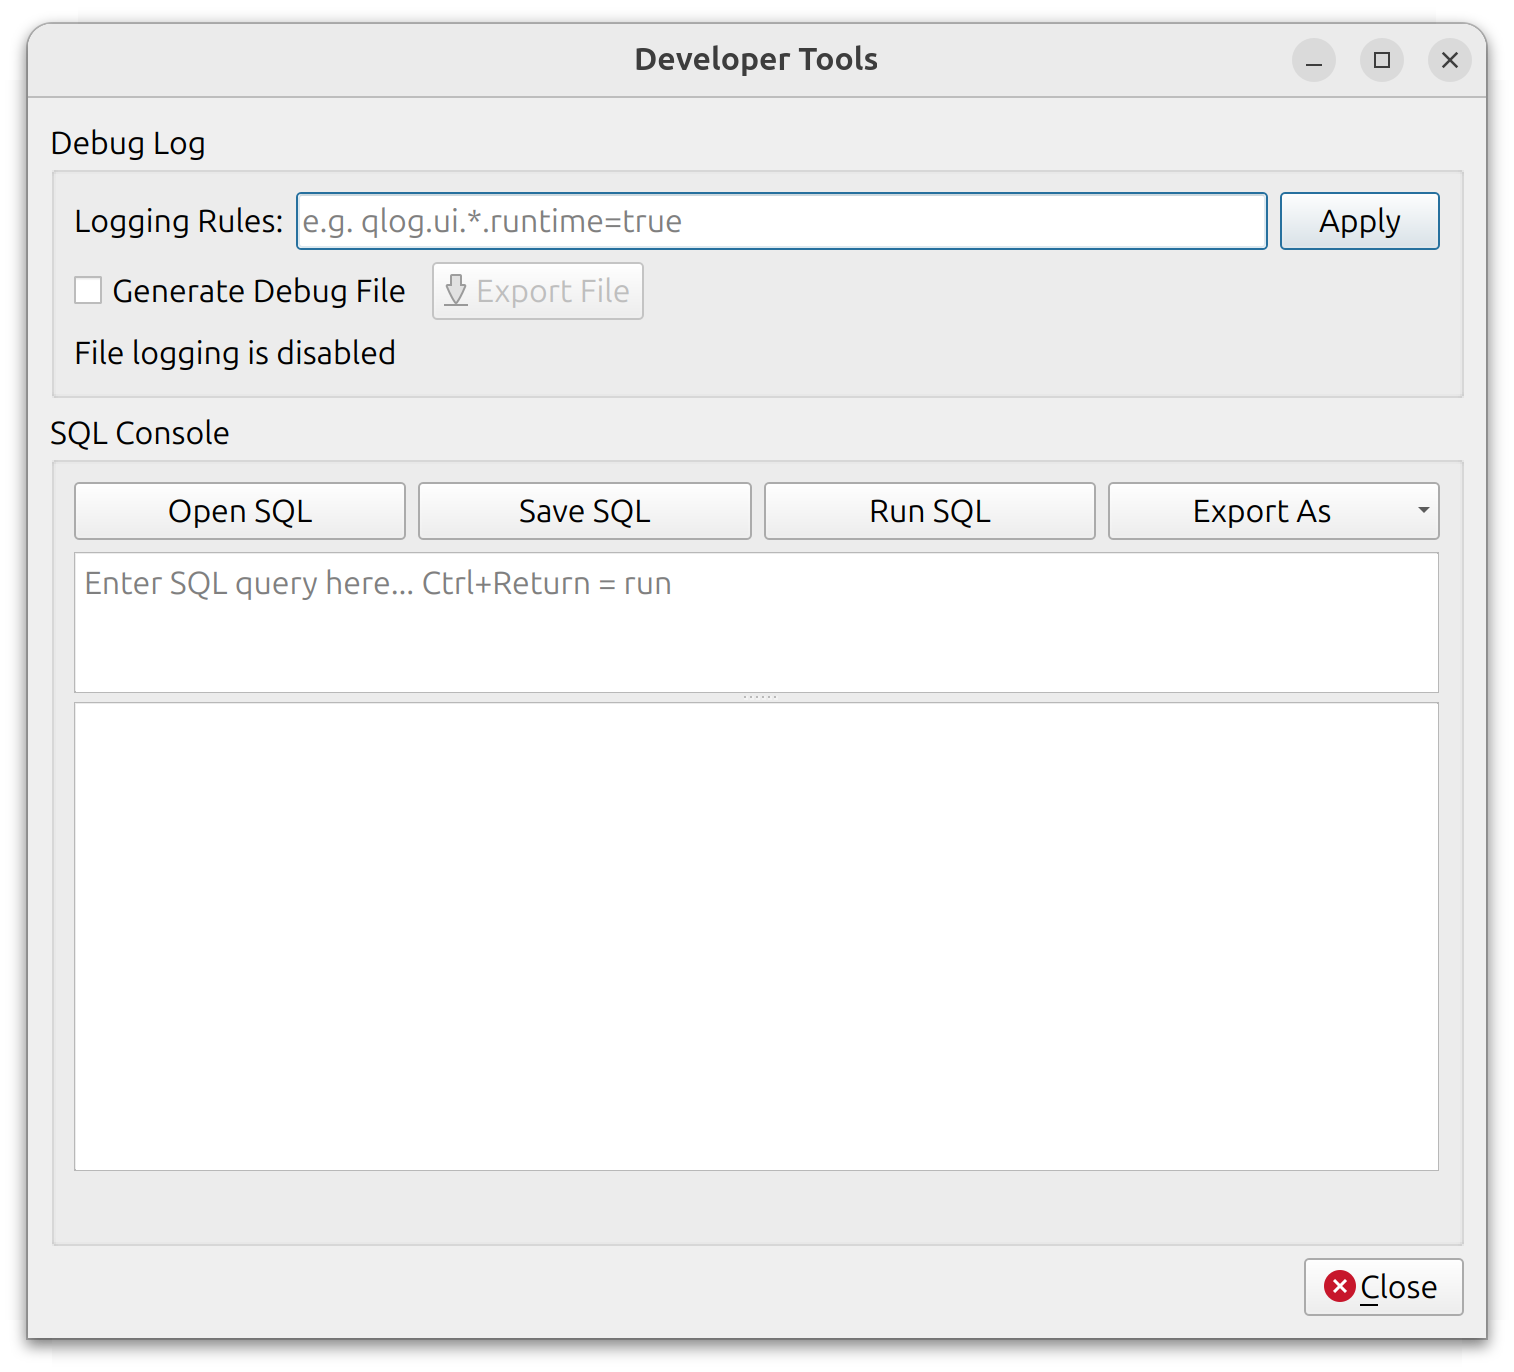
It is also possible to use Developer Tools (Help → Developer Tools). These tools provide advanced functionality for debugging and working with the application internals:
Debug Log
- Configure runtime QT logging rules using custom filter expressions (e.g.
qlog.ui.*.runtime=true) - Option to enable/disable logging to a file
- Export the generated debug log to a file
SQL Console
- Execute arbitrary SQL queries directly against the application database. The connection to DB is read-only therefore it is not possible the change Database values via SQL commands.
- Open and save SQL scripts
- Export query results to an external file
These tools are intended primarily for advanced users, debugging, and diagnostics.