5. How to debug BTs in ROS - fkie/fkie_behavior_trees GitHub Wiki
Currently, the BehaviorTree.CPP supports 5 different loggers that can be used for debugging your application. Some are briefly introduced here
RosMsgLogger:This logger publishes ROS messages with the current tree execution and node states. You can visualize them on RVIZ using the packagefkie_bt_visualization:StdCoutLogger:This logger prints state changes on consoleFileLogger:This logger saves state changes on fileMinitraceLogger:This logger stores the execution time of each nodePublisherZMQ:This logger publishes status changes using ZeroMQ. It is used by Groot. Remember that, the ports must be unique is you want to use multiple BT managers.
Loggers can be configured using the parameter:
logging:
  RosMsgLogger:
    enabled: true

  StdCoutLogger:
    enabled: false

  PublisherZMQ:
    enabled: true
    max_msg_per_second: 25
    publisher_port: 1666
    server_port: 1667

  FileLogger:
    enabled: false
    file_path: "bt_trace.fbl"

  MinitraceLogger:
    enabled: false
    file_path: "bt_trace.json"
RVIZ Visualization
It is possible to visualize the current tree and node execution state in RVIZ. Just compile the package fkie_bt_visualization, then add a new panel of type BehaviorTreeStatusPanel, and finally set up the proper node name (for instance: husky/bt_mnavigation)
The panel BehaviorTreeLoggerPanel shows console outputs triggered in BT nodes.
Improving console debugging
Aiming to simplify the debugging of running actions, we have created the following functions:
BT_ROS_INFO(...) - BT_ROS_DEBUG(...) - BT_ROS_WARN(...) - BT_ROS_ERROR(...)

BT_ROS_INFO_STREAM(msg) - BT_ROS_DEBUG_STREAM(msg) - BT_ROS_WARN_STREAM(msg) - BT_ROS_ERROR_STREAM(msg)
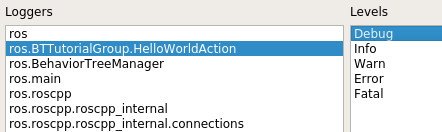
They create a new ROS logger for each BT action type, meaning that, you can define the logger level (debug, info, etc..) to each type independently. This is useful if your application contains nodes from different domains (Robot Navigation, MoveIt, ...).
Remarks
- If no logger is specified, the default logger is assigned to
STD_COUNT_LOGGER.