Installing and managing the EXASOL nagios docker container - exasol/nagios-monitoring GitHub Wiki
The first step for the installation procedure is to create a new docker instance with the EXASOL nagios image. This image is publicly available and you can find it using the command line options of docker:
root@demo ~ # docker search EXASOL
NAME                       DESCRIPTION                                     STARS     OFFICIAL   AUTOMATED
exasol/script-languages    Pluggable EXASOL UDF Scripts                    0                    [OK]
exasol/nagios-monitoring   lighttpd + nagios for EXASolution DB inst...    0                    [OK]
The nagios monitoring image needs a port for the nagios web interface. If your local port "443" isn't used yet, we suggest to use this port for the web interface.
docker create -p <your local port>:443 --name <docker container name> --hostname <hostname inside container> exasol/nagios-monitoring:latest
Example for default HTTPS port 443 and "exasol-nagios" as name for the container:
docker create -p 443:443 --name exasol-nagios --hostname exasol-nagios exasol/nagios-monitoring:latest
After creating the instance we are able to start it:
root@demo ~ # docker start exasol-nagios
exasol-nagios
Thats all! Now you have a running Nagios enviroment. The login for the Nagios web interface, navigate to https://your_docker_ip:your_local_port. The container uses a self-signed SSL certificate which will be automatically created. You will be prompted for login credentials. The default username is nagiosadmin and the default password is admin.

Adding a cluster
Adding a cluster is quite simple: you just have to start the configuration wizard and fill out the necessary information. The Nagios configuration files will be generated automatically. The wizard can be started with the following docker command:
docker exec -ti <container name/id> nagios-addcluster
A full walkthrough for a cluster may look like this:
root@demo ~ # docker exec -ti exasol-nagios nagios-addcluster
Cluster name [A-Za-z0-9]: cluster25
License server IP address: 10.70.0.50
EXAoperation user (must have at least the supervisor role): monitor
EXAoperation password:
Logservice number: 1
IP addresses of all cluster nodes (connection range): 10.70.0.51..59

*** trying to connect...
Do you want to monitor the database instance "db25_1"? (Y/n)y
Database monitoring user: exa_monitor
Password:
Do you want to monitor the database instance "db25_2"? (Y/n)y
Database monitoring user: exa_monitor
Password:
*** successfully created Nagios Configuration file '/etc/nagios/conf.d/exa_cluster25.cfg'
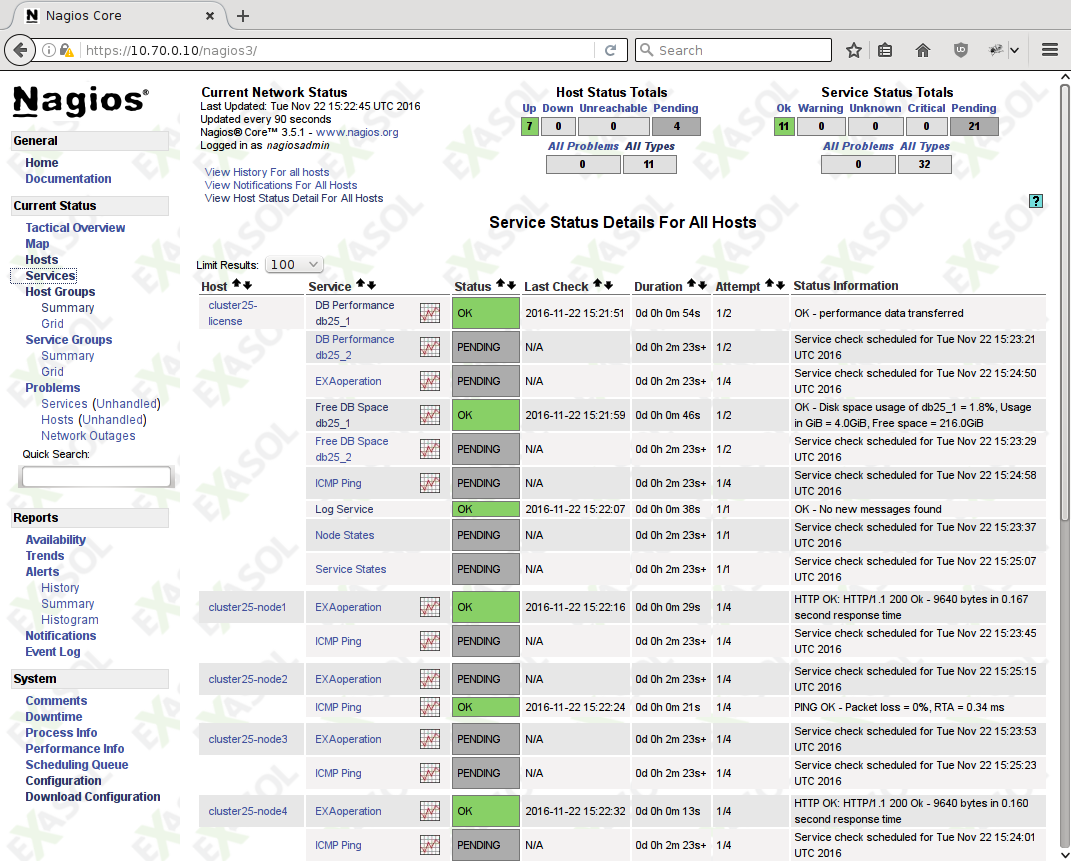
After adding the cluster, all monitoring services are added to Nagios. You can check by opening the "Services" page:
Other operations
To mange the Nagios system, there exist a few additional methods:
| Command | Purpose |
|---|---|
| docker exec -ti nagios-addcluster | adding a cluster to the monitoring system |
| docker exec -ti nagios-listcluster | list all clusters added by the configuration wizard |
| docker exec -ti nagios-removecluster | remove a cluster from the monitoring system |
| docker exec -ti nagios-passwd | changes the password for the Nagios webinterface |
| docker exec nagios-getconfig |base64 -di >config.tar.gz | (Linux only!) download the Nagios configuration and plugins |
You can download the generated configuration files using the Nagios web interface (see "Download Configuration" link in the navigation pane on the left side).