kedr_manual_using_kedr - euspectre/kedr GitHub Wiki
kedr - a service-like tool to control KEDR.
kedr start target_name [ -c conf_string | -f conf_file ...]
kedr stop
kedr status
kedr restart
-
-c conf_string
conf_string string provides configuration parameters that KEDR will use when loading and unloading.
-
-f conf_file
conf_file file provides configuration parameters that KEDR will use when loading and unloading. For the files in the default configuration directory (
/etc/kedr/,/etc/opt/kedr/or<install_prefix>/etc/kedr/depending on where KEDR is installed), the directory part of the path may be omitted. In the current version, the default configuration directory contains the following files:-
callm.confConfiguration profile for call monitoring (call tracing).
-
fsim.confConfiguration profile for fault simulation.
-
leak_check.confConfiguration profile for memory leak detection.
-
default.confDefault configuration profile (same as the profile for memory leak detection
leak_check.conf).
-
All conf_string and conf_file arguments of the command will actually be combined into one configuration file by KEDR control tool, in the same order as they are listed. The resulting profile will be used when loading and unloading KEDR.
If no conf_string and conf_file options are given, the command will use the default configuration file (default.conf).
If necessary, several -f and -c options can be specified.
kedr start first loads KEDR core with "target_name" parameter equal to target_name. Then it processes the configuration file in the "on_load" mode and executes all resulting strings. The configuration file is the default one or the one prepared based on the options of the command (see "Options"). That is, KEDR is now configured to operate on the module named target_name.
If KEDR core is already loaded, kedr start does nothing and returns 1.
If the module with name target_name is currently loaded, kedr start does nothing and returns 1.
If loading KEDR core or processing some of the lines in the configuration file fails (the corresponding operation returns nonzero), a rollback is performed. That is, all lines in the configuration file, up to the failed line, are processed in "on_unload" mode, and KEDR core is unloaded (if it has been started successfully before). Then 1 is returned.
kedr stop processes the configuration file (the same file as was used at the last start) in "on_unload" mode and executes resulting strings. Then KEDR core is unloaded.
If KEDR core did not load, kedr stop does nothing and returns 1.
If module with name target_name is currently running, kedr stop does nothing and returns 1.
kedr status outputs information about the current status of KEDR.
That is, whether KEDR core is loaded, which payload modules are currently loaded, what is the name of the target module (the module under analysis) and whether this module is currently loaded.
kedr restart does effectively the same as this:
kedr stop && kedr start target_name conf_file
target_name is the name of the current target, conf_file - the effective configuration file (default or the one constructed from options) with which KEDR was started last time.
If KEDR core is not currently loaded, kedr restart does nothing and returns 1.
If module with name target_name is currently loaded, kedr restart does nothing and returns 1.
If KEDR core is still loaded after "stop" operation has been executed, "start" operation will not run and kedr restart will return 1.
In its start, stop and restart modes, kedr may break the usage of the trace. So, trace capturing mechanism (kedr_capture_trace) should not be running when kedr command is executed in these modes.
The configuration file is treated as an ordered list of lines each of which has one of the following forms:
-
on_loadshell-command -
on_unloadshell-command -
module|payloadmodule-name | module-filename [parameters...]
Besides that, empty lines as well as the lines containing only spaces and lines starting with # character are allowed and ignored when the control tool processes the configuration file.
A line containing shell-command preceded by on_load is executed in "on_load" mode and is ignored otherwise.
A line containing shell-command preceded by on_unload is executed in "on_unload" mode and is ignored otherwise.
"on_load" and "on_unload" modes are described in "Description".
Line
module module-name [parameters...]
where module-name is the name of a module or its alias, is actually equivalent to the following two lines:
on_load modprobe module-name [parameters...]
on_unload modprobe -r module-name
Line
module module-filename [parameters...]
where module-filename is the absolute path to the module, is actually equivalent to the following two lines:
on_load insmod module-filename [parameters...]
on_unload rmmod module-filename
payload keyword at the start of the line has same meaning as module but also marks module-name or module-filename as a payload module.
In "on_load" mode, all processed lines in the configuration file are executed from the first to the last. In "on_unload" mode, they are executed in a reverse order (i.e. if module A is loaded after module B then A unloaded before B).
kedr start module1
This command will start KEDR with the default payloads for call monitoring. When module named module1 will be loaded, it will be processed by KEDR.
kedr start module1 -c 'payload payload1 arg1 arg2' -c 'payload payload2'
Same as above, but instead of loading the default payloads, it will load payload modules payload1 (with arguments arg1 arg2) and payload2.
If the payload module payload1 uses symbols from another module, say module_aux, then the configuration file should contain the following lines (the order is important!)
...
module module_aux
payload payload1
...
The following command will start KEDR for the module named module1 with call monitoring and fault simulation turned on.
kedr start module1 -f callm.conf -f fsim.conf
kedr_capture_trace - a tool to capture the data output by payload modules to the trace.
kedr_capture_trace OPTIONS
kedr_capture_trace captures the trace information output by payload modules.
Each trace record can be written to the specified file(s) ('-f' option) and/or passed to user-specified application(s) as STDIN ('-p' option). If neither '-f' nor '-p' option is specified, all trace records are output to STDOUT.
-
-d debugfs_mount_point
Specify the directory the debugfs filesystem is currently mounted to. This filesystem contains the trace file from which the trace will be captured. If this argument is not supplied, it is assumed that the mount point of debugfs filesystem is
/sys/kernel/debug. -
-f, --file file
Store every trace record in the given file. If the file doesn't exist,
kedr_capture_tracecreates it at the beginning, otherwise appends new data to the file. When file is -, trace records will be output to STDOUT. -
-p, --program application
On start,
kedr_capture_tracelaunches application. Then it pipes every trace record to the standard input of this application. When capturing is to be stopped,kedr_capture_tracecloses its side of pipe and waits until the application terminates. -
-s, --session
Read only those records from the trace that were collected since the target module had been loaded and until the target module had been unloaded (target session). Capturing stops after the last record from the target session has been processed.
-
-b, --blocking
When there are no messages in the trace, wait for the new messages to appear instead of quitting.
The first SIGINT signal sent to
kedr_capture_traceprocess (e.g.,Ctrl+C), turns off the effect of this flag. That is,kedr_capture_tracewill quit when it has read all messages present in the trace at that moment and will wait no longer.
Note'-s' option should not be used if some trace records from the current target session have already been processed (and, consequently, removed from the trace).
Save all records currently present in the trace to the file trace.txt:
kedr_capture_trace -f trace.txt
Listen to the trace and keep saving the records from the trace to the file trace.txt until 'Ctrl+C' is pressed:
kedr_capture_trace -b -f trace.txt
^C
Save all records from the trace corresponding to kfree() calls to the file frees.txt:
kedr_capture_trace -p grep called_kfree > frees.txt"
Listen to the trace and pack the trace records to trace.bz2 archive on the fly:
kedr_capture_trace -b -p bzip2 > trace.bz2
Listen to the trace, save all records from the trace to trace.txt and the records corresponding to kfree() calls and to kmalloc() calls to frees.txt and allocs.txt, respectively:
kedr_capture_trace -b \
-p "grep called_kfree > frees.txt" \
-p "grep called___kmalloc > allocs.txt" \
-f trace.txt
Save all records from the trace that appeared when the particular actions were being performed (probably the actions on the target module).
kedr_capture_trace -f /dev/null
<do some actions>
kedr_capture_trace -f trace.txt
Listen to the trace, save all records from the trace generated by moduleA to the file trace.txt.
kedr start moduleA
kedr_capture_trace -b -s -f trace.txt &
pid=$!
/sbin/modprobe moduleA
...
/sbin/modprobe -r moduleA
wait $pid
kedr stop
See also "Call Monitoring (Call Tracing)".
KEDR has a plugin-based architecture similar to the architecture of Valgrind and other binary analysis frameworks for user-space applications and libraries.
Each data collection and analysis tool based on KEDR has at least the following parts:
- KEDR core - the core components provided by the framework, their main responsibility it to instrument the target module when it is loaded. The core also provides utilities to simplify commonly used operations, for example, output of the collected data, etc.
- One or more tool plugins ("payload modules") that actually collect and, if necessary, analyze the data about the target module.
The interaction between the components involved in the analysis of Linux kernel modules with KEDR is outlined at the figure below. The logical components related to KEDR are colored in green.
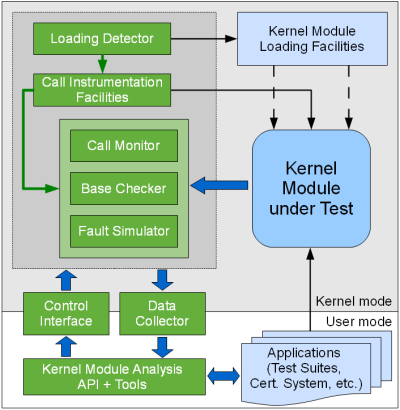
KEDR core ("Loading Detector" and "Call Instrumentation Facilities" on the figure) detect when the module to be analyzed (target module) is loaded. The notification system provided by the Linux kernel is used to do this.
When the target has been loaded but before it begins its initialization, KEDR core takes control and instruments it, that is, it changes the memory image of that module in a special way. In particular, the calls to the functions that should be intercepted (target functions) are replaced with the calls to the trampolines. A trampoline is a special function with the same signature as the corresponding target function. These trampolines call pre handlers, replacement functions and post handlers provided by payload modules. A payload module should register itself with KEDR core for this to work.
After the instrumentation is done, the target module is allowed to begin its initialization.
The actual analysis of the target kernel module is performed by payload modules of different types.
If the target module tries to call a function which one of the payload modules is interested in (target function), that payload module takes control before and after it while executing the corresponding pre handler(s) and/or post handler(s). This way, the payload module can get access to the arguments and the return value of the target function. In addition, the payload module can register a replacement function that will be called instead of that target function. This allows to change the behaviour of the target module, for example, to make it look like the target function has failed.
Payload modules can do various things:
-
Check various requirements for the operation of the module ("Base Checker" on the figure): whether it creates memory leaks, etc.
-
Simulate the situations when the kernel seems to fail to satisfy some of the requests made by the target module ("Fault Similator" on the figure). That is, simulate low memory conditions, etc.
-
Collect data about which function was called when, with what arguments, and what it returned ("Call Monitor" on the figure). The data are output to a trace (via "Data Collector" facilities) and can then be analyzed by user-space applications.
-
...And much more (see "Implementing Custom Types of Analysis").
When loaded, payload modules register themselves with the KEDR core - see "API for Payload Modules".
KEDR core makes no assumptions about what exactly the currently registered payload modules do. This allows to implement different types of analysis with the help of KEDR.
The user controls the analysis process via convenience API and tools ("Kernel Module Analysis API + Tools" on the figure) - either manually or via a user-space application.
NoteNote that the term "API" is used here in a rather broad sense. Currently, it is not a set of functions or classes provided for the applications written in some programming language. It rather consists of all the means that KEDR provides for the user-space applications to start the analysis process, to control it and to retrieve the results. These means include the parameters of the kernel modules from KEDR, the special files that allow to configure fault simulation scenarios, etc. All these facilities are described in the respective sections of this manual.
KEDR control tool makes sure each component of KEDR is loaded in proper order and with proper parameters. It does roughly the following (the more precise description is available in "Controlling KEDR"):
-
Loads the
KEDR coreresponsible to keep track of payload modules and to provide API to them. The name of the target module passed toKEDR corea parameter ("target_name"). -
Loads the payload modules listed in the configuration file. Each payload module should register itself with the KEDR core by calling
kedr_payload_register(see "API for Payload Modules"), this is usually done in its init function. From this moment, KEDR begins watching for the specified target module to load (see also "Getting Started").
When the analysis is done, the KEDR control tool unloads the modules mentioned above, in appropriate order.
As it was described above, the name of the target module is usually set as a parameter to KEDR control tool. You can also change the target name when KEDR is already loaded. To do this, write the new name to /sys/module/kedr/parameters/target_name. Note that this is only allowed when neither the previous target module nor the intended one are loaded.
You can also "clear" the target name specification by writing "none" to the file mentioned above. This would mean that no target module were specified for KEDR.
NoteNote that if the name of the target module contains dash characters (
'-'), KEDR will replace them with underscores in the value of its "target_name" parameter. This is similar to whatinsmodandmodprobedo.
Call monitoring facilities provided by KEDR allow to collect data about the calls to the functions of interest (target functions) made by a kernel module. In this case, post handlers are registered for some set of kernel functions. Each post handler simply outputs the arguments and return value of the target function to a trace.
This is similar to what strace utility does for user-space applications.
NoteFor some functions, pre handlers are used instead of the post handlers. This helps produce a correct trace in case of multithreaded execution (see "trace.happensBefore Parameter for Call Monitoring").
KEDR provides a set of payload modules that perform call monitoring. They collect information about which kernel functions were called by the target module and in what order, about the parameters passed to these functions and about the return values. This information is output to a trace and can then be used by user-space applications in runtime with the help of kedr_capture_trace tool.
The standard payload modules for call monitoring are not built by default. If you would like to to build and install them, set CMake variable KEDR_STANDARD_CALLM_PAYLOADS to ON when executing CMake before building KEDR:
cmake -DKEDR_STANDARD_CALLM_PAYLOADS=ON <other_options> <path_to_kedr_sources>
The format of the output data is similar to the trace format of the ftrace system.
Here is an example of such trace:
  TASK-PID  CPU#  TIMESTAMP   FUNCTION
--------------------------------------------------------------------
insmod-6416 [001] 805.997320: target_session_begins: target module: "kedr_sample_target"
insmod-6416 [001] 805.997615: called___kmalloc: ([<ffffffffa00e70b9>] init+0xb9)
    arguments: (320, d0), result: ffff8800165a8000
dd-6438     [000] 858.641942: called___kmalloc: ([<ffffffffa01d661e>] core+0x61e)
    arguments: (4000, d0), result: ffff88001659e000
dd-6438     [000] 858.642074: called_copy_from_user: ([<ffffffffa01d642a>] core+0x42a)
    arguments: (ffff88001659e000, 000000000137d000, 1), result: 0
...
rmmod-6441  [001] 869.438875: called_kfree: ([<ffffffffa01d60d8>] core+0xd8)
    arguments: (ffff88001659e000)
rmmod-6441  [001] 869.438879: called_kfree: ([<ffffffffa01d60d8>] core+0xd8)
    arguments: ((null))
rmmod-6441  [001] 869.438881: called_kfree: ([<ffffffffa01d6108>] core+0x108)
    arguments: (ffff8800165a8000)
rmmod-6441  [001] 869.438885: target_session_ends: target module: "kedr_sample_target"
FUNCTION field has the following format for the records corresponding to the detected function calls:
called_<function-name>: (<call_address>) arguments(<arguments-list>), result:<value-returned>
<call_address> specifies the address of the next instruction after the call to the target function. This field has the following format:
[<absolute_address>] <area>+<offset>
<absolute_address> is the absolute address of the instruction immediately following the call in the memory image of the target module. <area> can be "init" or "core". It is the name of the area containing the executable code of the module (these terms are used by module loader in the Linux kernel). An area may contain one or more sections (ELF sections) of the module. <offset> is the offset of the instruction from the beginning of the area.
If you would like to find the lines in the source code of the target module corresponding to the addresses given in the trace records, see "Analyzing the Call Location Information" for details.
A different format is used for marker records indicating loading and unloading of the target module:
target_session_<begins|ends>: target_module: "<target-module-name>"
Only calls to the subset of all kernel functions are detected. This subset however can be extended easily by implementing your own modules (see "Writing Custom Payloads for Call Monitoring"). The complete list of the default payload modules that can currently be used for call monitoring and the lists of the functions processed by each module are provided in "List of Functions".
Fault simulation facilities provided by KEDR allow to put the target kernel module into the conditions that occur not very often during the normal operation of the module. For example, it is possible to simulate a situation when the system is short of memory or of another resource and consequently, at least some of the attempts to acquire the resource (e.g. allocate memory) fail. This allows to check if the target module handles such situations correctly.
The standard payload modules for fault simulation are built and installed with KEDR by default. If you would like to disable this, set CMake variable KEDR_STANDARD_FSIM_PAYLOADS to OFF when executing CMake before building KEDR:
cmake -DKEDR_STANDARD_FSIM_PAYLOADS=OFF <other_options> <path_to_kedr_sources>
The fault simulation scenarios (i.e. the instructions that define the calls to which functions to make fail and in what conditions) can be customized by the user.
NoteNote that only the target module is affected during fault simulation, the other parts of the kernel are not.
It is possible to restrict fault simulation even more, to handling of only those requests to the target module that are made by a particular user-space process (it can be a process created by a test application, for example).
During fault simulation, replacement functions are registered for some set of target functions. Each replacement function may call the target function or perform some set of actions. The former variant is referred to as "normal execution", the latter is referred to as "fault simulation", it usually looks like a failure in this function from the the caller's point of view. A replacement function uses a fault simulation point to choose among these variants. That is, it calls a special indicator function and decides based on its return value whether to call the corresponding target function normally or simulate its failure. In the latter case, the target function is often not called at all, just the appropriate value is returned (as if it was returned by the target function).
In KEDR, the replacement functions and fault simulation scenarios are independent on one another. A replacement function may even be developed by a different author than a scenario. The person who needs to use some fault simulation scenario for a function, can simply assign the scenario to the replacement function in runtime.
The default fault simulation scenario is "never simulate failures". So all the fault simulation payload modules do not change behaviour of original functions. To manage scenarios, each payload module creates one or more directories in debugfs like /sys/kernel/debug/kedr_fault_simulation/points/<point-name>, where <point-name> is the name of the fault simulation point (it is assumed here that debugfs filesystem is mounted to /sys/kernel/debug). The names of fault simulation points are usually the same as the names of the corresponding target functions but may also differ from those. That is, fault simulation can be controlled separately for each target function.
In each such directory, there is at least file current_indicator containing the name of the fault simulation indicator, currently used for the function. You can consider fault simulation indicator a function which is called whenever the payload module needs to decide whether to simulate a failure of the target function. If the indicator function returns nonzero, a failure will be simulated. You might say that an indicator implements a fault simulation scenario. Reading from file current_indicator gives the name of the currently used indicator. Writing a name of some indicator to this file sets this indicator for the function.
Examples:
cat /sys/kernel/debug/kedr_fault_simulation/points/vmalloc/current_indicator
After the payload module for fault simulation processing vmalloc has just loaded, the above command will print "none". This is because no indicator is currently set for vmalloc.
echo common > /sys/kernel/debug/kedr_fault_simulation/points/vmalloc/current_indicator
This sets the indicator named common for vmalloc. If you read current_indicator again, you will see that it contains that name now:
cat /sys/kernel/debug/kedr_fault_simulation/points/vmalloc/current_indicator
"common" will be printed as a result of the command above.
If you try to set a non-existent indicator, writing to current_indicator will return an error like
bash: echo: write error: Operation not permitted.
You can check this using the following command:
echo unknown_indicator_name > \
    /sys/kernel/debug/kedr_fault_simulation/points/vmalloc/current_indicator
KEDR provides special kernel modules that implement indicators for different use cases. Each of these modules exports a directory in debugfs, /sys/kernel/debug/kedr_fault_simulation/indicators/<indicator-name> (<indicator-name> is the name that identifies the indicator). Actually, an indicator usually implements a parametrized family of fault simulation scenarios rather than a single scenario. The parameters of an indicator can be changed from user space as described below. This can be done either when assigning the indicator to a fault simulation point (by writing a string like "<indicator-name> <indicator-params>" to the control file current_indicator for that point) or at runtime.
NoteEach fault simulation point uses its own instance of an indicator. That is, changing parameters of the indicator (and hence of the fault simulation scenario) for a target function does not affect other target functions.
The indicator with name common is the common indicator that can be used for any target function. By default, the indicator function always returns 0 ("never make the calls fail"). Once the indicator has been set, it creates three control files in /sys/kernel/debug/kedr_fault_simulation/points/<point-name> directory: expression, times and pid.
expression file corresponds to the mathematical expression. The indicator function will return the resulting value of this expression when called from a fault simulation point. Reading from this file returns the expression currently used by the indicator function. If you would like to instruct the indicator to use another expression, write the expression to this file.
The expression may contain the following.
- Signed or unsigned decimal integer numbers
-
Unsigned hexadecimal integer numbers with the format
"0x[0-9a-f]+"(similar to "0x%x" format for printf() function) - Any mathematical operation from the list:
-
"!"- logical not -
"~"- binary not -
"+"- unary plus -
"-"- unary minus -
"*"- multiplication -
"/"- integer division -
"%"- remainder of division -
"+"- binary plus -
"-"- binary minus -
">>"- arithmetic right shift -
"<<"- arithmetic left shift -
"<"- less -
">"- greater -
"<="- less or equal -
">="- greater or equal -
"a=b"- equal -
"a!=b"- not equal -
"&"- binary and -
"^"- binary xor -
"|"- binary or -
"&&"- logical and -
"a||b"- logical or -
"c ? a : b"- conditional operator
-
- Variables:
-
in_init
evaluates to nonzero if the target module is currently executing its init function, evaluates to 0 otherwise
-
rnd100
evaluates to a random integer number from
[0...99] -
rnd10000
evaluates to a random integer number from
[0...9999] -
times
evaluates to the ordinal number of the call to the corresponding target function since indicator has been set for it or since calls counter has been reset (see below)
-
caller_address
evaluates to the address of the instruction following the call being processed (this can be used to simulate failures of, say, kmalloc() only when this function is called from the particular places in the target module: from the particular functions, etc.)
-
in_init
times file corresponds to the counter of target function calls - see the description of times variable that can be used in the expression for the indicator. This counter is incremented each time the target function is called (while this fault simulation indicator is set for this function). Reading from the file returns the current value of the counter, writing any value to this file resets the counter to 0.
Examples:
echo common > /sys/kernel/debug/kedr_fault_simulation/points/vmalloc/current_indicator
This will set common indicator for vmalloc function. The default scenario is "never simulate failures".
cat /sys/kernel/debug/kedr_fault_simulation/points/vmalloc/expression
The above command should print 0.
echo 1 > /sys/kernel/debug/kedr_fault_simulation/points/vmalloc/expression
This will set the scenario to "make each call fail" for vmalloc function.
echo '!in_init' > \
    /sys/kernel/debug/kedr_fault_simulation/points/vmalloc/expression
This will set the scenario to "after the target module is initialized, make each call to the target function fail".
echo '!in_init && (rnd100 < 20)'> \
    /sys/kernel/debug/kedr_fault_simulation/points/vmalloc/expression
This will set the scenario to "after the target module is initialized, simulate failures of approximately 20% of all calls to the target function".
echo '(caller_address < 0xfe2ab8d0) && (caller_address > 0xfe2ab970) && (rnd100 < 20)'> \
    /sys/kernel/debug/kedr_fault_simulation/points/vmalloc/expression
This will set the scenario to "simulate failures of approximately 20% of the calls to the target function made outside of the range [0xfe2ab8d0, 0xfe2ab970], the calls from within the range should succeed". This helps restrict fault simulation to only particular areas of the target module.
echo 'times = 1'> \
    /sys/kernel/debug/kedr_fault_simulation/points/vmalloc/expression
echo '0'> \
    /sys/kernel/debug/kedr_fault_simulation/points/vmalloc/times
This will set the scenario to "make only the first call to the target function fail" (all other calls should succeed). The second command resets the call counter, i.e. forces KEDR to count calls only from this moment.
echo '(times % 3) = 0'> \
    /sys/kernel/debug/kedr_fault_simulation/points/vmalloc/expression
This will set the scenario to "make every third call to the target function fail" (succeed, succeed, fail, succeed, succeed, fail, succeed, ...).
The file named pid corresponds to the set of processes affected by the fault simulation for a given target function. That is, KEDR will not simulate failures when the requests to the target module come from the processes other than the listed ones. Initially, after the indicator has been set for the target function, pid is 0. Whenever a call to a target function is intercepted by a payload module, the corresponding replacement function checks (according to the value of expression) whether it should simulate a failure or not. If you write a non-zero value to pid file, only the process with the given pid and its descendants (its children along with their children, etc.) will be affected by the fault simulation.
NoteNote that when a nonzero pid is specified, the calls to the target function will not increment
timesvariable if they are made in the context of a process that is neither the process with that pid nor its descendant.
In the following example, the fault simulation scenario is "make a call to the target function fail only if it is made in the context of a process launched from the current shell or of its descendants".
echo common > /sys/kernel/debug/kedr_fault_simulation/points/vmalloc/current_indicator
echo 1 > /sys/kernel/debug/kedr_fault_simulation/points/vmalloc/expression
echo $$ > /sys/kernel/debug/kedr_fault_simulation/points/vmalloc/pid
Other indicators provided with KEDR extend the abilities of common indicator. They support additional variables that can be used in the expression.
The indicator named kmalloc allows to use size and flags variables, that is, the parameters of __kmalloc function. It also accepts several named constants of gfp_t type like GFP_KERNEL and GFP_ATOMIC. Example:
echo 'kmalloc (flags = GFP_ATOMIC) && (size > 100)' > \
    /sys/kernel/debug/kedr_fault_simulation/points/kmalloc/current_indicator
This will set the scenario for __kmalloc function to "simulate failure of each memory allocation request with flags equal to GFP_ATOMIC and size greater than 100".
NoteIn this example, the name of the fault simulation point (
kmalloc) differs from the name of the target function (__kmalloc). The reasons for this difference will be explained below.
The convenience however comes at the cost of generality: this indicator can be set only for __kmalloc function as well as those functions that provide size and flags parameters.
Similarly, the indicator named capable allows to use cap variable which is a parameter of capable function. It also accepts the named constants that may be used as the values of this parameter (CAP_SYS_ADMIN, etc.). Example:
echo 'capable cap = CAP_SYS_ADMIN' > \
    /sys/kernel/debug/kedr_fault_simulation/points/capable/current_indicator
This will set the scenario for capable function to "make each request for the administrative capabilities fail".
One replacement function may use only one fault simulation point but the reverse is not true: one fault simulation point may be used by many replacement functions. In that case, the fault simulation scenario set for the point is shared between the replacement functions. Such sharing may make sense for the groups of related target functions that use internally the same mechanism which in turn may fail.
For example, the fault simulation point kmalloc is used not only by __kmalloc but also by several other functions allocating kernel memory: kmem_cache_alloc, __get_free_pages, krealloc, etc. In this case, all these functions share the fault simulation scenario set for kmalloc point.
Full list of standard fault simulation scenarios is provided in "Standard Fault Simulation Scenarios". If you would like to extend "common" indicator to support more types of functions, see "Writing Custom Scenarios for Fault Simulation".
List of all functions available for fault simulation by standard set of fault simulation payloads is provided in "List of Functions". If you would like to create a payload module to perform fault simulation for other functions, see "Writing Custom Payloads for Fault Simulation".
NoteWhen the user loads KEDR with the standard fault simulation profile (
fsim.conf), the kernel modules for the standard indicators are also loaded automatically. If it is needed to use a custom indicator, the relevant modules should be loaded manually.
The function call the last failure has been simulated for can be seen in /sys/kernel/debug/kedr_fault_simulation/last_fault. It looks like
__kmalloc at [<e17b938d>] cfake_open+0x5d/0xa4 [kedr_sample_target]
LeakCheck allows, as its name implies, to check the target kernel module for resource leaks, for example, to reveal memory blocks that were allocated but were not freed by that module.
LeakCheck is enabled in KEDR by default. If you would like to disable it, set CMake variable KEDR_LEAK_CHECK to OFF when executing CMake before building KEDR:
cmake -DKEDR_LEAK_CHECK=OFF <other_options> <path_to_kedr_sources>
NoteStarting from KEDR 0.3, LeakCheck can be used simultaneously with other kinds of payload modules provided by KEDR. In particular, you can use LeakCheck and fault simulation for memory-related functions at the same time.
LeakCheck is now organized as follows.
-
The LeakCheck core (
kedr_leak_check.komodule) analyzes the information about allocations and deallocations and provides API for other components. -
One or more components obtain such information and pass it to the LeakCheck core via the API. Some of these components may be payload modules for KEDR, they may collect information about the calls to allocation/deallocation routines. Some may be the kernel-mode components of other kinds, e.g., the tools to track the callback operations of the target module, etc. Even the target module itself can use LeakCheck API to inform the analyzer about some allocation/deallocation events which could be otherwise more difficult to detect (some kind of annotations could be used here).
LeakCheck can be used like any other payload module for KEDR. First you need to load KEDR core and the appropriate plugins:
kedr start <target_name>
or, equivalently,
kedr start <target_name> -f leak_check.conf
Load the target module and do something with it as usual, then unload the target. Do not stop KEDR yet.
Take a look at /sys/kernel/debug/kedr_leak_check/<target_name> directory. Here we
assume that debugfs is mounted to /sys/kernel/debug. If it is not, you
should mount it:
mount debugfs -t debugfs /sys/kernel/debug
There should be the following files in kedr_leak_check/<target_name> directory:
-
info:- information about the target module (its name, addresses of the "init" and "core" memory areas);
- total number of memory allocations performed by the module;
- number of possible memory leaks (allocations without matching frees);
- number of free-like calls without matching allocation calls;
-
possible_leaks:- information about each detected memory leak: address and size of the memory block and a portion of the call stack of allocation (the allocations with the same call stack are grouped together, only the most recent one is shown);
-
unallocated_frees:- information about each free-like call without matching allocation call: address of the memory block and a portion of the call stack of that deallocation call (the deallocations with the same call stack are grouped together)
unallocated_frees file should normally be empty. If it is not empty
in some of your analysis sessions, it could be a problem in LeakCheck itself (e.g., the target module used some allocation
function that LeakCheck was unaware of) or memory is probably allocated by some other module. If you suppose it is a problem in LeakCheck, please report it to the issue tracker.
Here are the examples of info and possible_leaks files from a real analysis session.
The target is vboxsf module from VirtualBox Guest Additions 4.0.3. The memory leak caught there was fixed in VirtualBox 4.0.4.
info:
Target module: "vboxsf",
  init area at 0xfe2b6000, core area at 0xfe2aa000
Memory allocations: 49
Possible leaks: 11
Unallocated frees: 0
possible_leaks:
Block at 0xf617e000, size: 4096; stack trace of the allocation:
[<fe2ab904>] sf_follow_link+0x34/0xa0 [vboxsf]
[<c0303caf>] link_path_walk+0x79f/0x910
[<c0303f19>] path_walk+0x49/0xb0
[<c0304089>] do_path_lookup+0x59/0x90
[<c03042bd>] user_path_at+0x3d/0x80
[<c02fd6d7>] vfs_fstatat+0x37/0x70
[<c02fd748>] vfs_stat+0x18/0x20
[<c02fd9af>] sys_stat64+0xf/0x30
[<c0203190>] sysenter_do_call+0x12/0x22
[<ffffe430>] 0xffffe430
[<ffffffff>] 0xffffffff
+8 more allocation(s) with the same call stack.
----------------------------------------
Block at 0xf659a000, size: 4096; stack trace of the allocation:
[<fe2ab904>] sf_follow_link+0x34/0xa0 [vboxsf]
[<c0303caf>] link_path_walk+0x79f/0x910
[<c0303f19>] path_walk+0x49/0xb0
[<c0304089>] do_path_lookup+0x59/0x90
[<c03042bd>] user_path_at+0x3d/0x80
[<c02f8825>] sys_chdir+0x25/0x90
[<c0203190>] sysenter_do_call+0x12/0x22
[<ffffe430>] 0xffffe430
[<ffffffff>] 0xffffffff
+1 more allocation(s) with the same call stack.
----------------------------------------
The format of stack traces is the same as it is used to output data about warnings and errors to the system log:
[<call_address>] <function_name>+<offset_in_func>/<size_of_func> [<module>]
To be exact, each address corresponds to the instruction following the relevant call.
Addr2line, GDB, Objdump or some other tools of this kind can be used to locate the places in the source code corresponding to the entries in the stack traces. The detailed description can be found, for example, in "Analyzing the Call Location Information".
In the current version of LeakCheck, the names of the functions from
"init" area (those marked with __init in
the source file of the target module) cannot be resolved and the relevant
stack trace entries contain only raw call addresses. This is because name
resolution is done when "init" area has already been dropped from memory.
Using the the start address of the "init" area that info file shows and
the technique described in "Analyzing the Call Location Information" referred to above, you can
overcome this.
The parameters of the core LeakCheck module are described below.
If you would like to change the values of these parameters, copy the default configuration file
for LeakCheck to a directory of your choice and add <parameter_name>=<value> to the line for kedr_leak_check.ko module there. Then you can specify the path to the resulting configuration file when starting KEDR.
The maximum number of stack frames shown in the reports is controlled by stack_depth
parameter.
stack_depth parameter is an unsigned integer, not greater than 16.
Default value: 16.
By default, LeakCheck outputs the results not only to its files in debugfs but also to the system log. If output to the system log is not desirable, you can disable it by setting syslog_output parameter to 0.
syslog_output parameter is an unsigned integer. Non-zero means "on", zero means "off".
Default value: 1.
In some cases, LeakCheck may produce many warnings about "unallocated frees". This may happen, for example, when the resources were actually allocated but LeakCheck did not detect that.
bad_free_groups_stored parameter the maximum number of records (to be exact, groups of the records with the same call stack) for "unallocated frees" that can be shown in the detailed report. The greater the value of this parameter the more memory is needed to store the report, etc. Note that the summary always presents the complete number of the "unallocated frees" LeakCheck has detected and is not affected by this parameter.
bad_free_groups_stored parameter is an unsigned integer.
Default value: 8.
-
Assuming the
includedirectory of KEDR is in the search path for header files, the kernel module using the LeakCheck API should use the following#includedirective:#include <kedr/leak_check/leak_check.h> -
As the module uses functions exported by another module (LeakCheck core), it also needs the
.symversfile of the latter, namely<KEDR install prefix>/lib/modules/`uname -r`/symvers/kedr_leak_check.symvers -
In the functions below,
caller_addressis the return address of the call to the corresponding allocation or deallocation function. That is the address of the machine instruction immediately following the call (x86-specific). The pre- and post-handlers in the payload modules for KEDR have caller_address variable for this purpose, so you can just use it there. If LeakCheck API is used in some other component rather than a KEDR payload module, it is the job of that component to properly determine the value to be passed as caller_address (see also "Annotations" example). -
Currently, LeakCheck can analyze only one kernel module at a time. So, all the loaded components that use LeakCheck API should give LeakCheck the information only about that particular module.
void
kedr_lc_handle_alloc(struct module *mod, const void *addr, size_t size,
        const void *caller_address);
Call this function to inform LeakCheck core that the given kernel module, mod, has allocated a resource (e.g. memory block, some object, etc.) at the address addr in memory. addr must be neither NULL nor ZERO_SIZE_PTR.
The size of the resource is passed as size argument. If the resource is a memory block, size should be the size of this block. For other types of resources, it is also recommended to provide a meaningful value of size argument. In some cases, the size of the structure corresponding to the resource could be convenient to use here.
If the size cannot be obtained, pass 0 as size. This will be interpreted as "unknown size" by LeakCheck.
size must not be equal to (size_t)(-1), this value is reserved.
This function should be called after the resource has actually been successfully allocated.
void
kedr_lc_handle_free(struct module *mod, const void *addr,
        const void *caller_address);
Call this function to inform LeakCheck core that the given kernel module, mod, has freed (released, deallocated, ...) the resource that was located at the given address in memory (addr). addr must be neither NULL nor ZERO_SIZE_PTR.
This function should be called before the resource is actually freed. This is because LeakCheck assumes that the calls to its API happen in exactly the same order as the corresponding allocation and deallocation calls in the code under analysis.
If kedr_lc_handle_free() was called after the deallocation, some other part of the code under analysis could get in between the actual deallocation and that call and allocate the resource. The chances are, the new resource will have the same address as the old one. As a result, a call to kedr_lc_handle_alloc() could also occur before the call to kedr_lc_handle_free() with the same addr value, which could make a mess.
The following examples are provided to demonstrate how to use LeakCheck to build custom analysis tools. The examples are located in the following directory: <KEDR install prefix>/share/kedr/examples/leak_check/.
"Mempool_ops" example demonstrates how to create plugins to LeakCheck using the template-based generation system provided by KEDR and how to track custom allocation and deallocation operations.
The module built in this example tracks calls to mempool_alloc() and mempool_free() and uses LeakCheck to analyze consistency of these calls.
See the readme for the example for details.
If you would like to use LeakCheck to process allocation/deallocation events from the functions it currently does not track, the recommended way is to prepare a custom module like it is done in this example rather than to change the modules provided by KEDR framework.
"Annotations" example demonstrates how to use LeakCheck API in a module that is not a plugin to KEDR by itself. One common use case is annotating custom resource allocation/deallocation operations in a module you develop or, at least, can change a bit and rebuild.
The module is almost the same in this example as in "sample_target" example. The difference is, device_create() and device_destroy() are annotated here with the special calls for LeakCheck to track these operations.
See the readme for the example as well as the comments in its source code for details.
When the target module is loaded, the output files are cleared, the results are reset. Please take this into account when loading and unloading the target module more than once while LeakCheck is loaded.
As usual with debugfs, the output files live only as long as LeakCheck is loaded. In particular, after unloading the target, please collect the results first and only after that reload the target or stop KEDR.
For the present, the tool monitors the usage of several dozens of kernel functions that allocate and deallocate memory. However, if the target module uses some other functions for this purpose, LeakCheck will not notice that. It is possible to add support for more functions to LeakCheck or provide some other workaround based on LeakCheck API.
Besides that, if the target module allocates a memory block but it is another module (or the kernel proper) that frees it, this will also be reported as a memory leak by LeakCheck. That being said, possible leaks reported by LeakCheck should be further analyzed to find out whether they are actually leaks.
This section describes some techniques that can be useful when analyzing the call stack information as well as traces output by call monitoring plugins. The techniques can also be used when analyzing the results of memory leak detection. In particular, it is shown below how to find out which place in the source code of the target module each particular trace record or address in the binary code corresponds to and how to obtain call stack for a call of interest.
NoteIt is recommended that the kernel of your system should be built with
CONFIG_FRAME_POINTERorCONFIG_STACK_UNWINDparameters set to "y". This is not the case on some systems by default. If neither of these parameters are not defined, reliable stack trace information could probably be unavailable. KEDR will still work in this case but, for example, its reports concerning memory leaks may be less detailed.It is desirable to have the target module with debug information enabled. Note that it is only necessary if you would like to match the trace records to the appropriate fragments of the source code of the target module. KEDR itself does not require the modules under analysis to have debug information.
Let us consider the following trace of events:
[1] insmod-6416 [001] 805.997320: target_session_begins: target module: "kedr_sample_target"
[2] insmod-6416 [001] 805.997615: called___kmalloc: ([<ffffffffa00e70b9>] init+0xb9)
    arguments: (320, 80d0), result: ffff8800165a8000
[3] dd-6438     [000] 858.641942: called___kmalloc: ([<ffffffffa01d661e>] core+0x61e)
    arguments: (4000, 80d0), result: ffff88001659e000
[4] dd-6438     [000] 858.642074: called_copy_from_user: ([<ffffffffa01d642a>] core+0x42a)
    arguments: (ffff88001659e000, 000000000137d000, 1), result: 0
    ...
[5] rmmod-6441 [001] 869.438875: called_kfree: ([<ffffffffa01d60d8>] core+0xd8)
    arguments: (ffff88001659e000)
[6] rmmod-6441 [001] 869.438879: called_kfree: ([<ffffffffa01d60d8>] core+0xd8)
    arguments: ((null))
[7] rmmod-6441 [001] 869.438881: called_kfree: ([<ffffffffa01d6108>] core+0x108)
    arguments: (ffff8800165a8000)
[8] rmmod-6441 [001] 869.438885: target_session_ends: target module: "kedr_sample_target"
The "marker records" #1 and #8 denote the beginning and the end of the "tracing session", i.e. the moments when the target module was loaded and unloaded, respectively. Let us analyze the remaining ones. For each trace record of interest, we need to perform at least the following steps.
- Determine the ELF section in the target module from which the reported call was made.
- Translate the offset of that call from the beginning of "init" or "core" area to the offset from the beginning of the section.
- Find the line corresponding to that instruction in the source code of the target module. This can be done, for example, with Addr2line, GDB or Objdump as described below.
In each of the trace records corresponding to the function calls, there is the address of an instruction immediately following the call instruction. Consider, for example, the address in the record #3: [<ffffffffa01d661e>] core+0x61e. This means, the absolute address of that location is 0xffffffffa01d661e. At the same time, that location is at the offset of 0x61e from the beginning of the "core" area of the memory image of the target. For now, it is technically easier for KEDR to obtain the offset of a location from the beginning of such area than of a section like .text, etc.
According to how the loader of kernel modules currently works, it seems that the sections of the target module containing the executable code are loaded to the beginning of two memory areas, "init" and "core". It is "init" area that is usually dropped from the memory once the module has completed its initialization. This area often contains only one code section, .init.text, where the functions marked with __init in the source code are placed. .text, .exit.text and other code sections (if present) go to "core" area.
So, in many cases, the offset in "init" area is actually the offset in .init.text section and the offset in "core" area is the offset in .text. This is however not always the case. To find out which section the call in a trace record corresponds to, you can use different techniques. You can, for example, simply obtain the memory addresses of the sections of the target module while it is under analysis. They can be read from /sys/module/<module_name>/sections/<section_name> (note that reading from these files may require root privileges). Once you have these start addresses of the sections, you can use the absolute address of the call to find out which section it belongs to.
For example, the following command will print the memory address of .text section of module "kedr_sample_target":
cat /sys/module/kedr_sample_target/sections/.text
To display the addresses of all the main code sections at once, the following could be helpful:
for sn in /sys/module/kedr_sample_target/sections/.*text*; do \
    printf "$(basename ${sn})  $(cat ${sn})\n"; \
done
Note that when the target module is unloaded and then loaded again, its sections may be located at some other addresses.
Apart from the start addresses, it could also be convenient to know the size of each code section. Readelf (readelf -SW) or GDB (info files command) can be used to obtain this information.
Now that you have found the section a call of interest belongs to as well as its offset in that section, you can use the debug information in the target module to find the corresponding place in its source code. The following sections show how to do this.
addr2line tool from binutils can be used to find the locations in the source code of the module corresponding to the given addresses in its binary image.
Suppose we obtained the memory addresses and sizes of each code section when kedr_sample_target.ko was loaded:
for sn in /sys/module/kedr_sample_target/sections/.*text*; do \
    printf "$(basename ${sn})  $(cat ${sn})\n"; \
done

.init.text  0xffffffffa00e7000
.text       0xffffffffa01d6000
.exit.text  0xffffffffa01d667c
It is also useful to know the size of each of these sections.
readelf -SW kedr_sample_target.ko

[Nr] Name        Type      Address          Off    Size
...
[ 2] .text       PROGBITS  0000000000000000 000030 00067c
...
[ 4] .init.text  PROGBITS  0000000000000000 0006bc 0001fd
...
[ 6] .exit.text  PROGBITS  0000000000000000 00067c 000010
...
Consider the trace record #2. The address is 0xffffffffa00e70b9, this is the position right after the call to __kmalloc. It is in .init.text (this section starts at 0xffffffffa00e7000 and is 0x1fd bytes long), at the offset of 0xb9. As .init.text is the only section in init area of this module, the offset from the beginning of that area is the same. That is what we also see in the trace: init+0xb9.
On x86 and x86-64, the length of the appropriate call instruction ("call near rel32") is 5 bytes, so the offset of that instruction itself from the beginning of .init.text is 0xb4.
addr2line -e kedr_sample_target.ko -i --section=".init.text" b4

/usr/src/linux/include/linux/slub_def.h:265
/usr/src/linux/include/linux/slab.h:321
/home/tester/work/kedr/other/sample_target/cfake.c:320
If you now look at that location in cfake.c, you will see something like this:
319   /* Allocate the array of devices */
320   cfake_devices = (struct cfake_dev *)kzalloc(
321      cfake_ndevices * sizeof(struct cfake_dev),
322      GFP_KERNEL);
323   if (cfake_devices == NULL) {
324      err = -ENOMEM;
325      goto fail;
326   }
The meaning of the output of addr2line is as follows. At cfake.c:320, kzalloc() is called. It is an inline function defined in linux/slab.h. At linux/slab.h:321, it calls kmalloc(), which is an inline function too. kmalloc() is defined in linux/slub_def.h. Eventually, __kmalloc() is called at linux/slub_def.h:265.
Now let us consider the trace record #3. The address 0xffffffffa01d661e is in .text (.text starts at 0xffffffffa01d600 and is 0x67c bytes long). The offset from the beginning of .text is 0x61e. This is the location right after the call, so the offset of the call itself is 0x619.
addr2line -e kedr_sample_target.ko -i --section=".text" 619

/usr/src/linux/include/linux/slub_def.h:265
/usr/src/linux/include/linux/slab.h:321
/home/eugene/work/mem_rw/sample_target/cfake.c:84
Take a look at the line 84 in cfake.c:
84 dev->data = (unsigned char*)kzalloc(dev->buffer_size, GFP_KERNEL);
It is this statement that triggered the call to __kmalloc() recorded in the trace.
Start GDB and feed the object file of the target module to it:
gdb kedr_sample_target.ko
Get information about the sections and their file addresses:
(gdb) info files

Symbols from "/home/tester/work/kedr/other/sample_target/kedr_sample_target.ko".
Local exec file:
    '/home/tester/work/kedr/other/sample_target/kedr_sample_target.ko', file type elf64-x86-64.
    Entry point: 0x0
    0x0000000000000000 - 0x0000000000000024 is .note.gnu.build-id
    0x0000000000000030 - 0x00000000000006ac is .text
    0x00000000000006ac - 0x00000000000006bc is .exit.text
    0x00000000000006bc - 0x00000000000008b9 is .init.text
    0x00000000000008c0 - 0x0000000000000919 is .rodata
    0x0000000000000920 - 0x0000000000000a44 is .rodata.str1.8
    0x0000000000000a44 - 0x0000000000000a4a is .rodata.str1.1
    0x0000000000000a60 - 0x0000000000000bb7 is .modinfo
    0x0000000000000bb8 - 0x0000000000000c80 is __param
    0x0000000000000c80 - 0x0000000000000cc0 is __mcount_loc
    0x0000000000000cc0 - 0x0000000000001380 is __versions
    0x0000000000001380 - 0x0000000000001470 is .data
    0x0000000000001480 - 0x00000000000016d0 is .gnu.linkonce.this_module
    0x00000000000016d0 - 0x00000000000016e0 is .bss
The sections of interest are .init.text, .text and .exit.text. We will use the file addresses of the first two of these sections below (0x6bc and 0x30, respectively).
Suppose we have already found out that .init.text lies at the beginning of "init" area in the memory image of the module, .text - at the beginning of "core" area. All the addresses in the trace records are in .init.text and .text sections.
Consider the trace record #2. The detected call to __kmalloc was made at address init+0xb9, that is the call instruction is at the offset of 0xb9 from the beginning of the "init" area in the memory image and hence, from the start of .init.text section. The section has address 0x6bc in the file (see above), we can get the corresponding position in the source code using the following command:
(gdb) list *(0x6bc + 0xb9)

0x775 is in cfake_init_module (/home/tester/work/kedr/other/sample_target/cfake.c:323).
318
319     /* Allocate the array of devices */
320     cfake_devices = (struct cfake_dev*)kzalloc(
321         cfake_ndevices * sizeof(struct cfake_dev),
322         GFP_KERNEL);
323     if (cfake_devices == NULL) {
324         result = -ENOMEM;
325         goto fail;
326     }
GDB points to the line following the call to __kmalloc (kzalloc is an inline function) we are interested in. If we used the exact offset of the call instruction rather than the offset of the next one, GDB would show the innards of the inline kmalloc function substituted to the source of the target module which is probably not very convenient:
(gdb) list *(0x6bc + 0xb4)

0x770 is in cfake_init_module (include/linux/slub_def.h:262).
257             trace_kmalloc(_THIS_IP_, ret, size, s->size, flags);
258
259             return ret;
260         }
261     }
262     return __kmalloc(size, flags);
263 }
NoteOn x86 and x86-64, the length of the
callinstruction corresponding to that call to__kmallocis 5 bytes, so we have subtracted 5 from the offset above.
Usually, the offset shown in the trace corresponds either to the source line containing the call or to the next line.
Let us consider the record #3. It corresponds to a call to __kmalloc too, but this call was made at the offset 0x61e from the beginning of "core" area and of .text section. To find the corresponding source line, execute the following command (0x30 is the file address of .text section):
(gdb) list *(0x30 + 0x61e)

0x64e is in cfake_open (/home/tester/work/kedr/other/sample_target/cfake.c:85).
82     if (dev->data == NULL)
83     {
84         dev->data = (unsigned char*)kzalloc(dev->buffer_size, GFP_KERNEL);
85         if (dev->data == NULL)
86         {
87             printk(KERN_WARNING "[cr_target] open: out of memory\n");
88             return -ENOMEM;
89         }
The remaining records can be processed in a similar way.
Once we know section names and the offsets in these sections for the call instructions of interest, objdump tool can also be used to find the corresponding source lines.
First we need to disassemble the code sections of the module:
objdump -dSlr kedr_sample_target.ko > kedr_sample_target.disasm
Let us locate the call mentioned in the trace record #3. Its position is right before the offset of 0x61e in .text section. The instructions in kedr_sample_target.disasm are marked with their offsets in the corresponding section, so we can get the following:
 610:   48 8b 7b 08             mov    0x8(%rbx),%rdi
 614:   be d0 00 00 00          mov    $0xd0,%esi
 619:   e8 00 00 00 00          callq  61e <cfake_open+0x7e>
              61a: R_X86_64_PC32 __kmalloc-0x4
cfake_open():
/home/tester/work/kedr/other/sample_target/cfake.c:85
    if (dev->data == NULL)
    {
        dev->data = (unsigned char*)kzalloc(dev->buffer_size, GFP_KERNEL);
        if (dev->data == NULL)
 61e:   48 85 c0                test   %rax,%rax
So we can see from the above listing that the trace records corresponds to the call to kzalloc at line 84 of cfake.c. The remaining records can be processed in a similar way.
NoteThe technique described below is quite easy to use. Still, to understand it better, it is recommended that you familiarize yourself first with the instructions on how to create custom payload modules using template-based code generation and fault simulation infrastructure (see "Customizing and Extending KEDR").
Note that we are not actually going to do fault simulation here, we will just reuse the infrastructure for a different purpose.
Sometimes the technique described in the sections above is not enough to find out, what the target module was actually doing when it called the target function. Consider memory allocation and deallocation, for example. The developers of the target module may choose to use kmalloc() directly. Alternatively, they may choose to provide a set of their own functions for memory management that probably use kmalloc() internally but are higher-level and suit the needs of the developers better. If the latter is the case, it may happen that many of the calls to kmalloc() recorded in the trace are performed from the same address in the code even if the target module services completely different requests each time. If there are many such calls recorded, it could become difficult to analyze what was actually happening in the target module.
If we need to analyze only a few of the recorded calls, it could be helpful if we obtained call stack for each of these calls somehow.
Let us look at two fragments of a trace produced by call monitoring facilities from KEDR during the initialization and finalization of some kernel module:
insmod-1910 [000] 338.670490:
    called___kmalloc: ([<e0c5b55d>] core+0x755d) arguments: (36, d0), result: ddad8300
insmod-1910 [000] 338.670576:
    called___kmalloc: ([<e0c5b55d>] core+0x755d) arguments: (64, d0), result: ddad6f40
insmod-1910 [000] 338.670595:
    called_kfree: ([<e0c556d9>] core+0x16d9) arguments: (ddad6f40)
insmod-1910 [000] 338.670676:
    called___kmalloc: ([<e0c5b55d>] core+0x755d) arguments: (36, d0), result: ddad6f40
insmod-1910 [000] 338.670760:
    called___kmalloc: ([<e0c5b55d>] core+0x755d) arguments: (64, d0), result: de864f00
rmmod-1956 [000] 437.168068:
    called_kfree: ([<e0c556d9>] core+0x16d9) arguments: (de864f00)
rmmod-1956 [000] 437.168080:
    called_kfree: ([<e0c5d511>] core+0x9511) arguments: (ddad8300)
You have probably noticed that there is no matching call to kfree() recorded for the third call to __kmalloc() (the one that returned 0xddad6f40). Looks like a memory leak. Note that all the calls to __kmalloc() were made from the same place in the code of the target module. It was that higher level allocation function provided and used by the target module.
Assuming that the above situation is reproducible, let us try to obtain the call stack for each call to __kmalloc() made in the context of insmod process. However, the default payload modules for call monitoring and fault simulation are currently unable to output call stacks. So we need to prepare a custom paylaod module somehow that suits our needs. Fortunately, it is not that difficult.
As it is mentioned in "Writing Custom Payloads for Fault Simulation", the "point and indicator" infrastructure provided by KEDR for fault simulation, can be used for other purposes as well. Actually, it supports altering the behaviour of the target module according to a scenario chosen by the user (see also "Fault Simulation"). That is exactly what we need: each time __kmalloc() is called in the context of the specified process (or process tree), current call stack should be output, say, to the system log and the execution of the target module should then continue normally. To develop payload module payload_dump_stack that implements that, we can follow the steps described in "Writing Custom Payloads for Fault Simulation".
First, we copy custom_payload_fsim example to some other directory. The templates located there remain unchanged and we change only the name of the payload module to payload_dump_stack in Kbuild and makefile.
Then, to make things easier, we replace payload.data with the corresponding file for the default payload module for fault simulation for common memory management routines. That file can be found in payloads_fsim/common_memory_management subdirectory in the build tree of KEDR. We need to change this payload.data file as follows.
-
Set
module.nameandmodule.authorappropriately. -
Add relevant #include directives to the header part:
#include <linux/kernel.h> /* dump_stack() */ #include <linux/sched.h> /* current, etc. */ -
Turn off point reuse by commenting out
fpoint.reuse_point = ...lines in each group. We would like to control the calls to__kmallocseparately from the calls to other memory management functions. For those, we only need a usual trace. -
The most important part is to specify what exactly to do if a call to
__kmallocmatches the chosen scenario. We replace the default definition offpoint.fault_codefor the group for__kmallocfunction with the following (for simplicity, we do not care about the concurrency issues here):fpoint.fault_code =>> static int callNo = 0; /* just output a message and the call stack and go on normally */ ++callNo; printk(KERN_INFO "[__kmalloc()] Matched call, PID=%d, call #%d\n", (int)(current->pid), callNo ); dump_stack(); ret_val = __kmalloc(size, flags); <<That is, if the indicator function returns non-zero for a given call to
__kmalloc, we output the call number and PID of the corresponding process and calldump_stack()to output the call stack to the system log. Note that we call__kmallocat the end as we do not intend to simulate its failure rather than to allow the execution continue normally.
That is all for the payload module. Now we can build it and instruct KEDR to load it along with the corresponding core modules and the indicator. A configuration file like the following could be used to do this.
# Fault simulation infrastructure
module /usr/local/lib/modules/2.6.34.7-0.5-default/misc/kedr_fault_simulation.ko

# Payload modules
payload /home/tester/work/kedr/payload_dump_stack/payload_dump_stack.ko

# Indicators
# We could use kedr_fsim_indicator_common.ko as well because we are
# not going to set scenarios involving restrictions on the arguments
# of __kmalloc.
module /usr/local/lib/modules/2.6.34.7-0.5-default/misc/kedr_fsim_indicator_kmalloc.ko
Now we can set the indicator for the point corresponding to __kmalloc. We use "kmalloc" indicator but "common" would also do this time. We restrict the scenario to the processes launched from the current shell and then enable the scenario as usual:
# echo "kmalloc" > /sys/kernel/debug/kedr_fault_simulation/points/__kmalloc/current_indicator
# echo $$ > /sys/kernel/debug/kedr_fault_simulation/points/__kmalloc/pid
# echo 1 > /sys/kernel/debug/kedr_fault_simulation/points/__kmalloc/expression
After that, we can load the target module by executing insmod from that shell. Call stacks for the four relevant calls to __kmalloc will be output to the system log. We are particularly interested in the call #3:
[  338.990197] [__kmalloc()] Matched call, PID=2943, call #3
[  338.990199] Pid: 2943, comm: insmod Not tainted 2.6.34.7-0.5-default #1
[  338.990200] Call Trace:
[  338.990203]  [<c0206303>] try_stack_unwind+0x173/0x190
[  338.990206]  [<c020509f>] dump_trace+0x3f/0xe0
[  338.990208]  [<c020636b>] show_trace_log_lvl+0x4b/0x60
[  338.990210]  [<c0206398>] show_trace+0x18/0x20
[  338.990212]  [<c05b9f5b>] dump_stack+0x6d/0x72
[  338.990215]  [<e0871a89>] repl___kmalloc+0xf9/0x150 [payload_dump_stack]
[  338.990223]  [<e0c5b55d>] my_mem_alloc+0x2d/0x60 [frmwk_mod]
[  338.990232]  [<e0c598cb>] my_object_alloc+0xb/0x20 [frmwk_mod]
[  338.990240]  [<e0c5d52f>] my_object_create+0xf/0x50 [frmwk_mod]
[  338.990250]  [<e0cd106f>] impl_init_subsystem+0xf/0x20 [target_mod]
[  338.990256]  [<e0cd100a>] impl_init+0x2a/0x40 [target_mod]
[  338.990262]  [<e0cb801e>] init+0x1e/0x20a [target_mod]
[  338.990264]  [<c020120e>] do_one_initcall+0x2e/0x180
[  338.990267]  [<c0277c11>] sys_init_module+0xb1/0x220
[  338.990269]  [<c0203190>] sysenter_do_call+0x12/0x22
[  338.990275]  [<ffffe430>] 0xffffe430
Now that we have got the stack trace for that call, it will probably be easier to find out what exactly was allocated there. The ordinary trace could be used here to check if this is the call we need to analyze.
If there are still too many calls to the target functions made from in the context of a given process, one might want to filter the calls further to avoid filling the system log with lots of call stacks. We could instruct our system to trigger stack dump only for the call with a given number, or for the first N calls, or only for the calls where size parameter is 36, etc. All features of fault simulation scenarios can be used here (see "Fault Simulation").
NoteNote that as far as detection of memory leaks is concerned, the special plugin provided by KEDR for this purpose automatically obtains call stack information for spurious memory allocations and deallocations. So it is not actually necessary to apply the technique described above when analyzing memory leaks. This example is here to demonstrate that "point and indicator" can be reused to obtain the desired information as well.