1 Script Based Excel Testing - essenius/FitNesseFitSharpExcel GitHub Wiki
Let’s dive right into the details and show how the fixture works. We use a simple Excel sheet:
While plugins.properties in this repo has the right settings to use the .NET Framework version of FitSharp, if you want to use FitNesse with multiple suites, then you can leave FitNesse's plugins.properties configured for .NET 5 (see e.g. the Fibonacci Demo) and overrule three settings using !define statements.
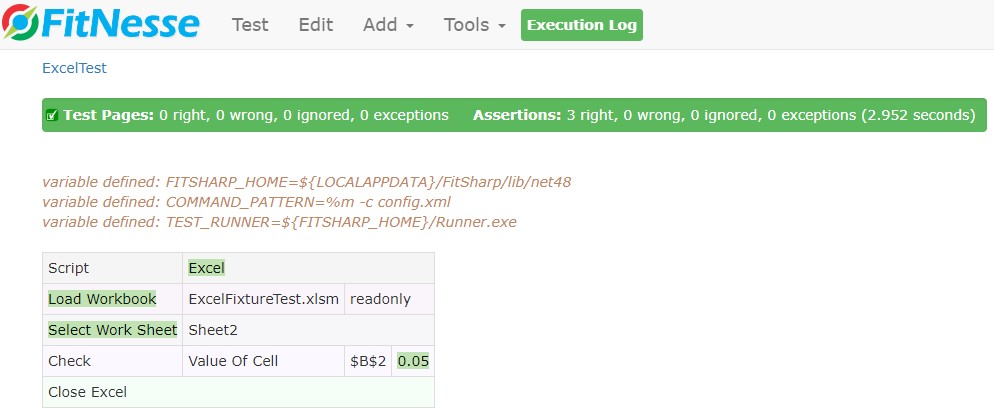
Then we create a test that opens a workbook, checks the value of cell B2 on a work sheet named Sheet2, and closes Excel.
!define FITSHARP_HOME {${LOCALAPPDATA}/FitSharp/lib/net48}
!define COMMAND_PATTERN (%m -c config.xml)
!define TEST_RUNNER {${FITSHARP_HOME}/Runner.exe}

!|Script          |Excel                          |
|Load Workbook    |ExcelFixtureTest.xlsm|readonly |
|Select Work Sheet|Sheet2                         |
|Check            |Value Of Cell        |$B$2|0.05|
|Close Excel                                      |

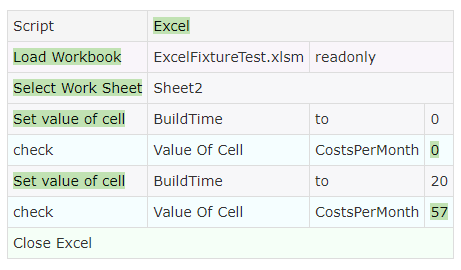
Let’s do something slightly more useful. The second sheet calculates the monthly costs of a build given a certain usage. We check whether the calculation is done right by feeding it a few values for build time and checking the associated costs. The sheet has defined a few names; BuildTime points to cell B5, and CostsPerMonth points to B6. We can use names directly as cell locators.
!|Script          |Excel                                 |
|Load Workbook    |ExcelFixtureTest.xlsm|readonly        |
|Select Work Sheet|Sheet2                                |
|Set value of cell|BuildTime            |to           |0 |
|check            |Value Of Cell        |CostsPerMonth|0 |
|Set value of cell|BuildTime            |to           |20|
|check            |Value Of Cell        |CostsPerMonth|57|
|Close Excel                                             |

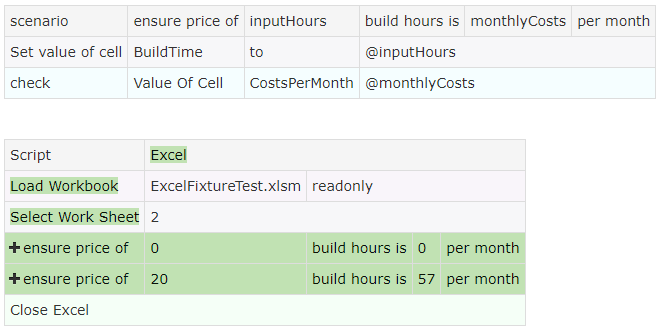
Now we probably want to feed the algorithm some more test cases, but the current way of doing it seems to be a bit clumsy as we are repeating ourselves. There is a better way, and that is creating a scenario:
!|scenario        |ensure price of|inputHours   |build hours is|monthlyCosts|per month|
|Set value of cell|BuildTime      |to           |@inputHours                          |
|check            |Value Of Cell  |CostsPerMonth|@monthlyCosts                        |

!|Script          |Excel                                            |
|Load Workbook    |ExcelFixtureTest.xlsm|readonly                   |
|Select Work Sheet|2                                                |
|ensure price of  |0                    |build hours is|0 |per month|
|ensure price of  |20                   |build hours is|57|per month|
|Close Excel                                                        |
Note that we can also select work sheets by number.

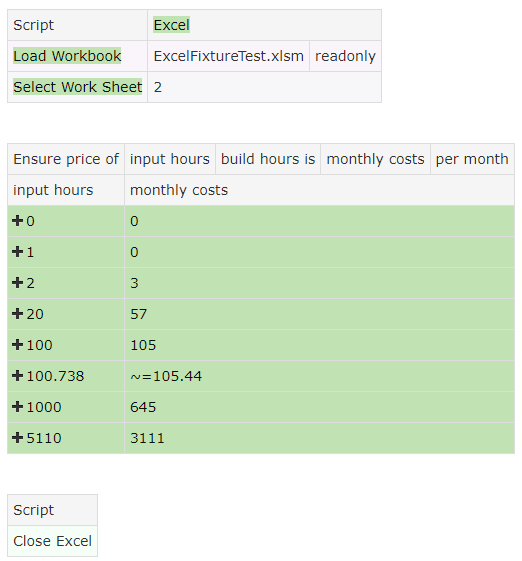
This is already somewhat better, but it is still too wordy if we want to increase the number of test cases. This looks like something where a decision table would be a better fit. Fortunately, we can make a decision table from a scenario:
!|scenario        |ensure price of|inputHours   |build hours is|monthlyCosts|per month|
|Set value of cell|BuildTime      |to           |@inputHours                          |
|check            |Value Of Cell  |CostsPerMonth|@monthlyCosts                        |

!|Script          |Excel                         |
|Load Workbook    |ExcelFixtureTest.xlsm|readonly|
|Select Work Sheet|2                             |

!|Ensure price of|input hours|build hours is|monthly costs|per month|
|input hours     |monthly costs                                     |
|0               |0                                                 |
|1               |0                                                 |
|2               |3                                                 |
|20              |57                                                |
|100             |105                                               |
|100.738         |~=105.44                                          |
|1000            |645                                               |
|5110            |3111                                              |

|Script     |
|Close Excel|

So now we have tested the algorithm with 8 test values. Notice that we can also use the approximate comparison, as well as all the other comparison features that FitNesse provides.
You will have noticed the button Calculate Cost Per Year on Sheet2. This does exactly what the button suggests: calculate yearly costs based on monthly costs. That’s of course something you normally wouldn’t use a macro behind a button for, but it’s just to show the idea.
We update the scenario to also check the yearly costs. For that, we add a third parameter for the expected value, and we use the Click Button function to make the sheet calculate the actual value.
!|scenario        |ensure price of|inputHours   |build hours is|monthlyCosts|per month and|yearlyCosts|per year|
|Set value of cell|BuildTime      |to           |@inputHours                                                   |
|check            |Value Of Cell  |CostsPerMonth|@monthlyCosts                                                 |
|Click Button     |Calculate Cost Per Year                                                                     |
|Check            |Value Of Cell  |CostsPerYear |@yearlyCosts                                                  |

!|Script          |Excel                         |
|Load Workbook    |ExcelFixtureTest.xlsm|readonly|
|Select Work Sheet|2                             |

!|Ensure price of|input hours  |build hours is|monthly costs|per month and|yearly costs|per year|
|input hours     |monthly costs|yearly costs                                                    |
|0               |0            |0                                                               |
|1               |0            |0                                                               |
|2               |3            |36                                                              |
|20              |57           |684                                                             |
|100             |105          |1260                                                            |
|100.738         |~=105.44     |~=1265                                                          |
|1000            |645          |7740                                                            |
|5110            |3111         |37332                                                           |

|Script     |
|Close Excel|
