7. Exploratory Data Analysis: More on Weather and Offense Groups - eliasmelul/CrimeInvestigation GitHub Wiki
Exploratory Data Analysis V
In conducting analysis of daily crimes for the Top 15 most frequent offense groups, we concluded that there are no strong, significant relationships between different weather parameters and the crime rates of different offense groups. Take 'Motor Vehicle Accident Response' as an example. It is the most frequent occuring offense in Boston. When the temperatire is cold enough, Boston starts being full of snow and icy roads, hence potentially provoking more accidents. However, the general seasonality of crimes, including 'Motor Vehicle Accident Response', states that crime rates are higher during summer than winter - contradicting the logic that icy roads lead to more accidents. Because of instances like such were the offense groups analyzed separately. However, as previously mentioned, this analysis did not generate conclusive or relevant insights.
Scatterplots Facetted by Offense Groups
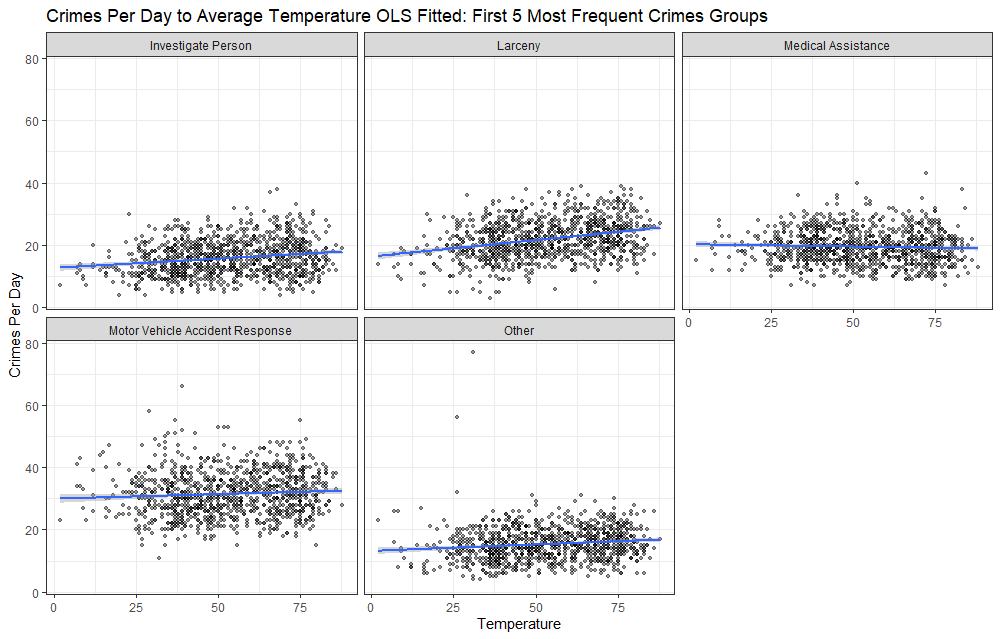 Figure 11. Scatterplots of the top 5 most frequent offense groups against temperature
Figure 11 shows that given the data we have on Boston crimes and temperature, it is not reasonable to make any statement on the correlation of two variables. The only crime that seems to show a correlation is larceny. This could be because larceny is more common when people have more activities and people are less likely to go outside when the temperature is below 25. However, as showed in the graph above, the distribution of the data is heavily entered around the 50-75 temperature range which might result in bias in the OLS process. Additional scatterplots on the next 10 most frequent offense groups can be seen in the appendix below.
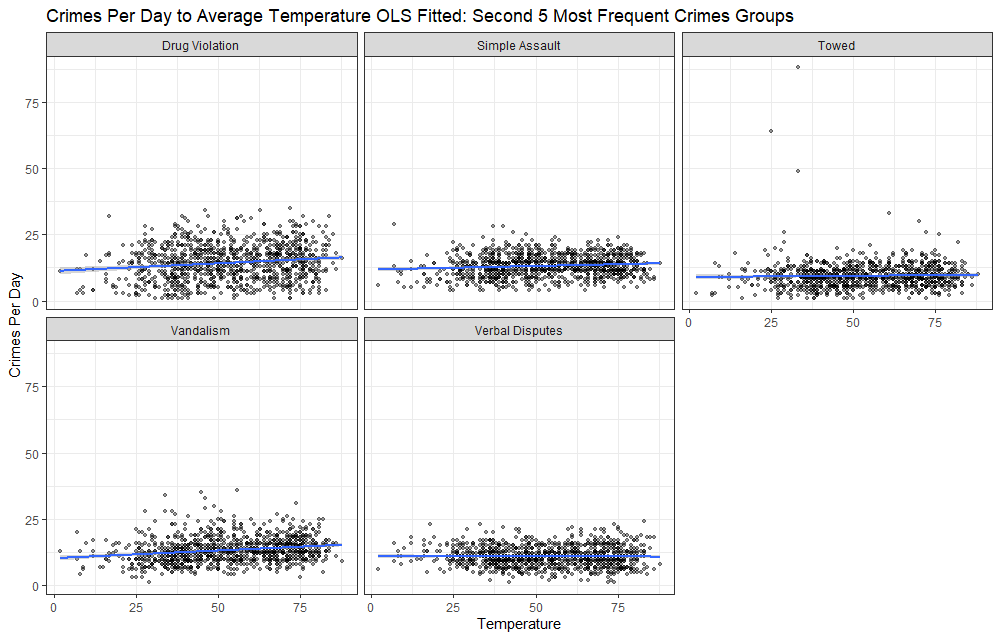 Figure 12. Scatterplots of the second 5 most frequent offense groups against temperature
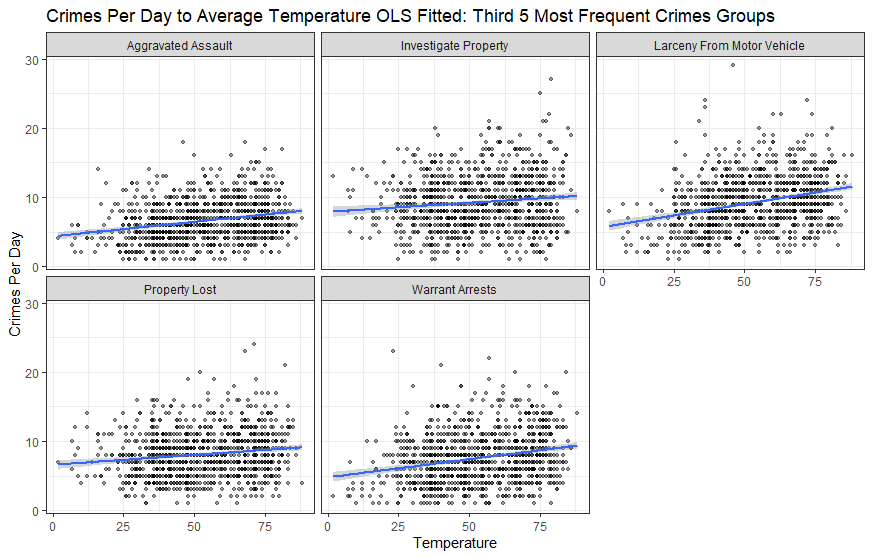 Figure 13. Scatterplots of the third 5 most frequent offense groups against temperature
Crimes Per Day versus Day of the Week Dacetted by Offense Groups
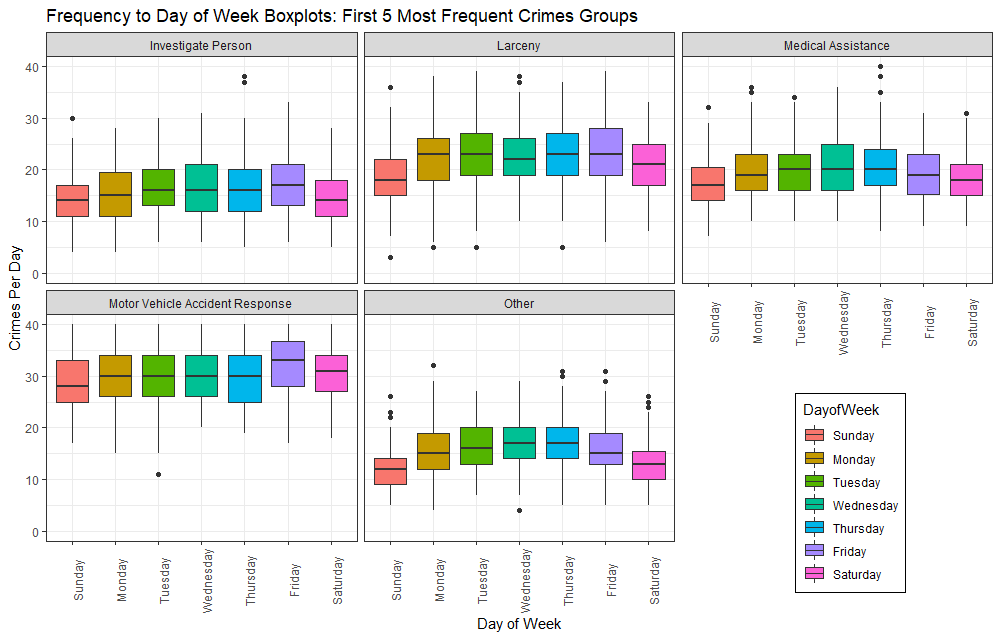 Figure 14. Crimes Per Day against Doy of Week Grouped by Offense Groups; Top 5
The trend of first 5 most frequent crimes from first day to last day of the week is consistent with the trend of all crimes. That is, in weekends there are fewer crimes and in week day there are more. However, this trend is the least evident in the motor vehicle accident, which may be due to traffic accidents happen on the road instead of indoor. The range of first 5 most frequent crimes is large in weekdays and small in weekends. This finding is similar to that of overall crimes. Motor vehicle accident and investigate person has few outliers while the others have more (Figure 7). Additional graphs on the next 10 frequent crimes can be seen in the appendix. In general, we find that the first 5 frequent crimes tend to happen less in weekdays and more in weekends while the second and third 5 frequent crimes tend to happen more in weekdays and less in weekends. The weighting average of them happen less in weekdays and more in weekends. The range of crimes do not show explicit signs. The second 5 frequent crimes have more outliers while others are roughly the same.
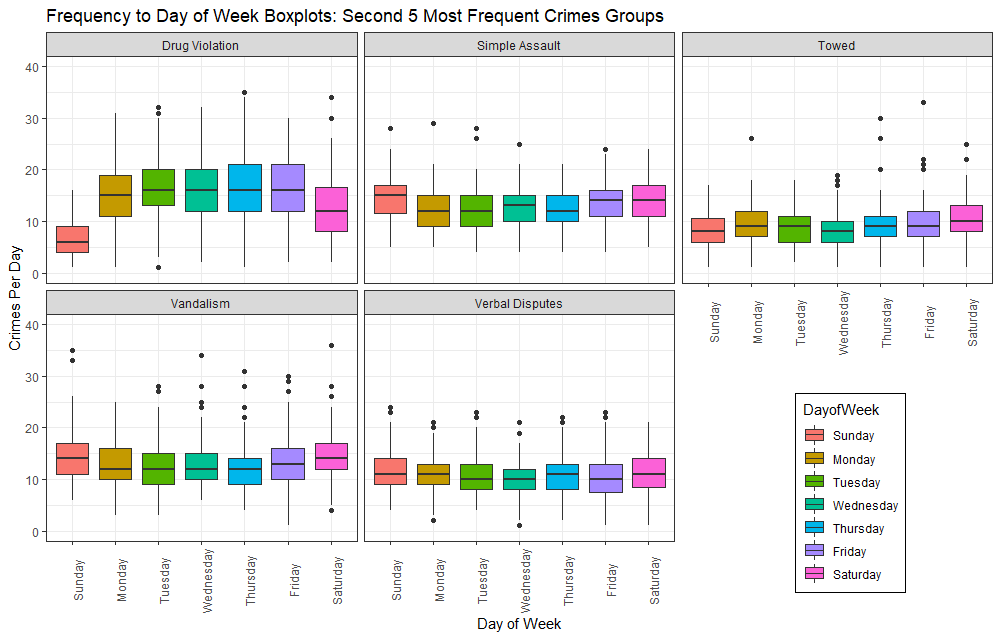 Figure 15. Crimes Per Day against Doy of Week Grouped by Offense Groups: Second 5
The trend of second 5 most frequent crimes from Sunday to Saturday in a week do not follow that of overall crimes. Drug violation and towed have less crimes on weekends and more on weekdays, which is similar to overall situation. Simple assault, vandalism and verbal disputes have less in weekdays and more on weekends. The range of crimes per day of second 5 most frequent crimes follow no clear rules between weekends and weekdays. The range of drug violation is larger than other crimes. The second 5 most frequent crimes have more outliers than first 5 most frequent crimes.
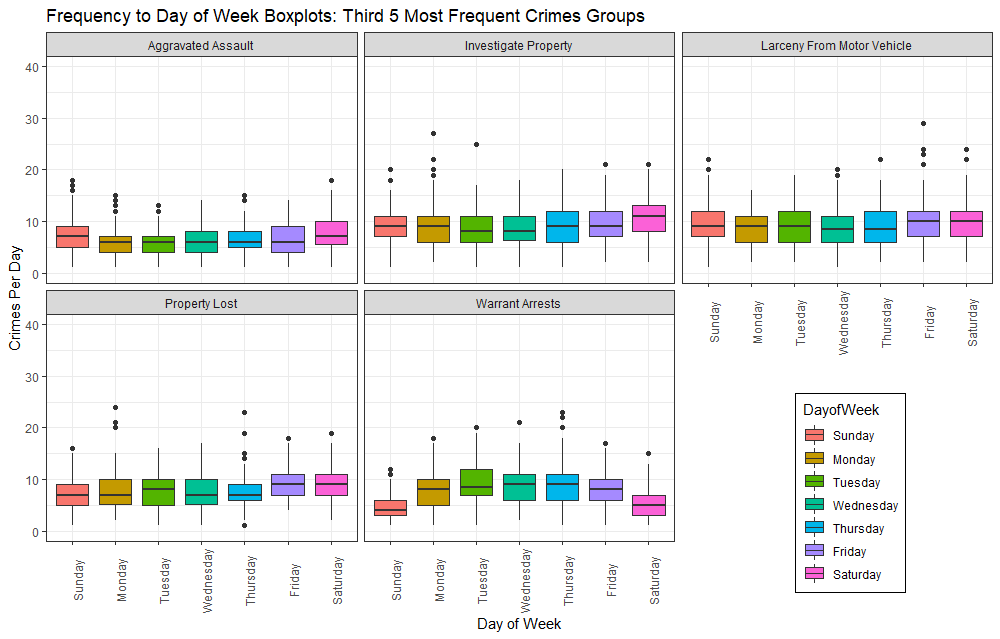 Figure 15. Crimes Per Day against Doy of Week Grouped by Offense Groups: Third 5
The trend of third 5 most frequent crimes from Sunday to Saturday in a week do not follow that of overall crimes. Only warrant arrests have less crimes on weekends and more on weekdays, which is similar to overall situation. Aggravated assault, investigate property, larceny from motor vehicle and property lost have less in weekdays and more on weekends. The range of crimes per day of third 5 most frequent crimes follow no clear rules between weekends and weekdays. In detail, larceny from motor vehicle has the largest average range in a week. The third 5 most frequent crimes have less outliers than second 5 most frequent crimes and approximately the same as first 5 crimes and the overall one.