6. Exploratory Data Analysis: Weather Parameters and Correlations - eliasmelul/CrimeInvestigation GitHub Wiki
Exploratory Data Analysis IV
When comparing weather parameters to the crime frequency, we first considered a correlation plot between frequency and the weather parameters.
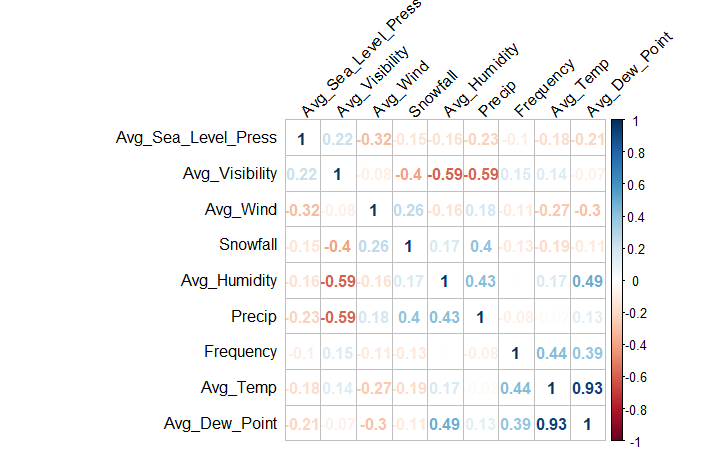 Figure 9. Correlation Plot
The correlation plot depicted in Figure 9 shows that the only parameters that correlate to the frequency of crimes are average temperature (F) and average dew point (F), both of which are significantly correlated between them. This may be an indicator for potential significant predictors for crime rates.
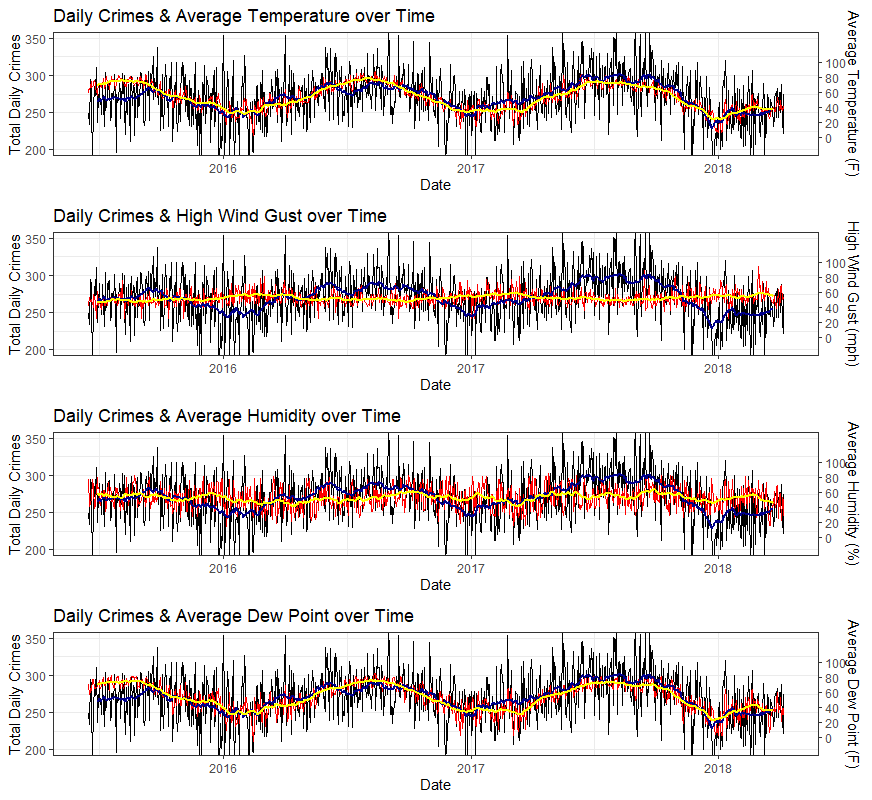 Figure 10. Timeseries of daily crimes over different weather parameters
The correlation between frequency and average temperature and average dew point can also be observed in the timeseries plots in Figure 10, where the black represents daily crimes, the blue line represents the 30 day moving average of the daily crimes, and the red and yellow lines represent the same characteristics but for the weather parameters respectively with respect to the second y-axis (right).