4. Exploratory Data Analysis: Day of the Week and Crimes Timeseries Decomposition - eliasmelul/CrimeInvestigation GitHub Wiki
Exploratory Data Analysis II
Taking a closer look to the data, we can determine when the extraordinary outliers of the Towed and the Other offense groups occurred and whether there is time-wise trend and seasonality in the model.
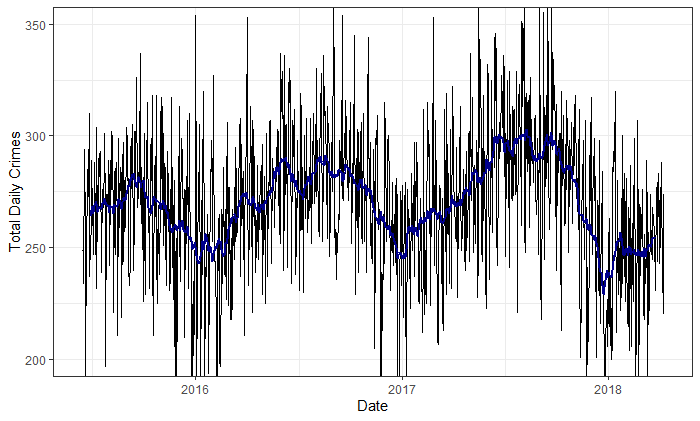 Figure 4. Time Series of the crime rate
From the time-series represented in Figure 4 of total daily crimes (black) and a 30-day moving average (blue), we can observe a clear yearly seasonality with the trough during winter and the peak during summer. However, the variance about the moving average of the total daily crimes is very high, indicating that there may be another seasonality.
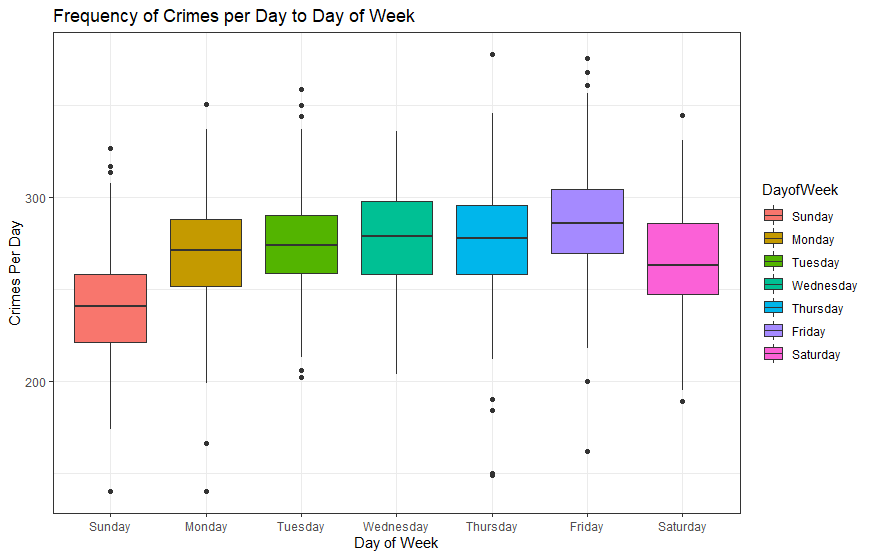 Figure 5. Boxplot on the Frequency of Each Offense Group
Crime during the weekends is significantly lower than that in weekdays. It increases steadily from Monday to Friday and drops suddenly in Saturday and even further on Sunday. Therefore, there is evidence about a 7 day seasonality. Reasons can be criminals would like to rest in weekends or people are at home during weekends, so it is harder to commit crimes. The lowest crime per day is approximately 220 and the highest is approximately 305. The range of crime per day is about 85. More specifically, Tuesday has smallest range and Wednesday has the largest ones. The ranges of weekends do not deviate lot from those of weekdays. Wednesday has no outliers and other days have 2-4 outliers.
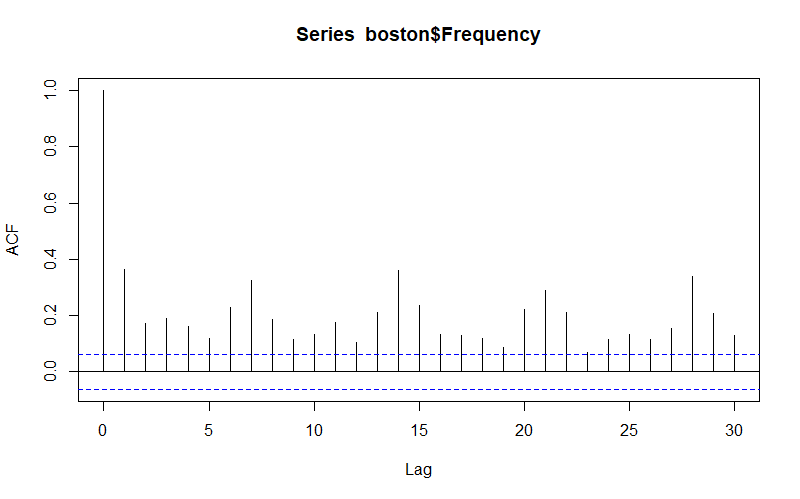 Figure 6. Autocorrelation Function Plot (ACF)
The ACF shows there's a correlation between points separated by 7 days (by 7 time-lags) and multiples of seven, therefore confirming that there is a weekly seasonality.
Timeseries Decomposition
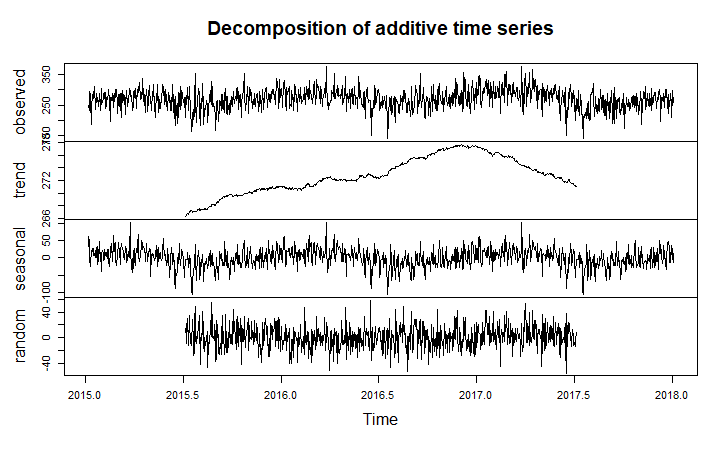 Figure 7. Timeseries Decomposition
Figure 7 shows that there is a slight positive trend in the overall timeseries from 2015 to 2017, and a decreasing trend for 2017. This means that in average the number of crimes increased from 2015 to 2017 and decreased thereafter. The seasonal component of the decomposition shows evidence of the yearly and weekly seasonality we observed earlier. The random component of the timeseries shows a high range, 80+ crimes, for the randomness attributed to this model.