3. Exploratory Data Analysis: Top 15 Offense Groups - eliasmelul/CrimeInvestigation GitHub Wiki
Exploratory Data Analysis I
Due to the nature of our data, we decided to explore the datasets in terms of the frequency of the number of daily crimes, categorical variables, such as the offense group and the day of the week, weather predictors and time series.
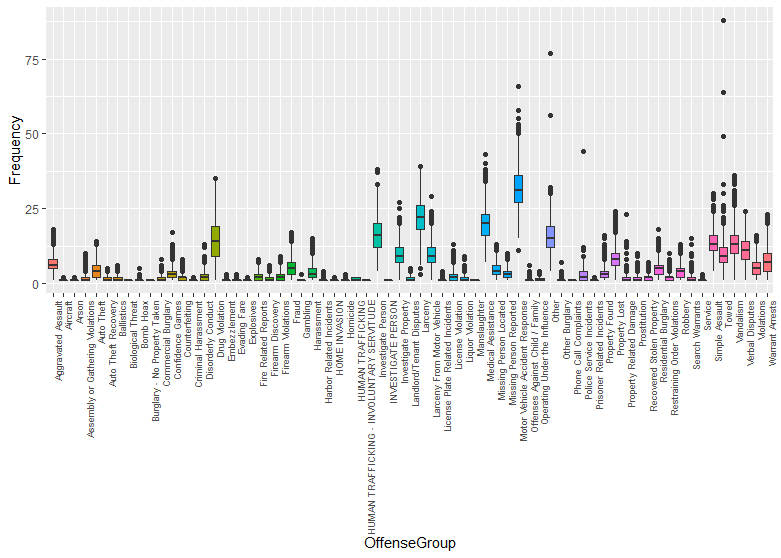 Figure 1. Boxplot on the Frequency for Each Offense Group
As seen on Figure 1, a boxplot was constructed to display the frequencies for each offense category listed in the dataset. There are 67 categories of crime. The outliers observed for all the crimes are seen to be higher in frequency, and the crimes that tend to be more common have a much larger frequency than the mean crime frequency by type. We can observe that most crimes can be represented by a small number of offenses. More specifically, the top 15 most frequent offense group represent 75% of the total crimes, as can be observed from the Pareto Chart below.
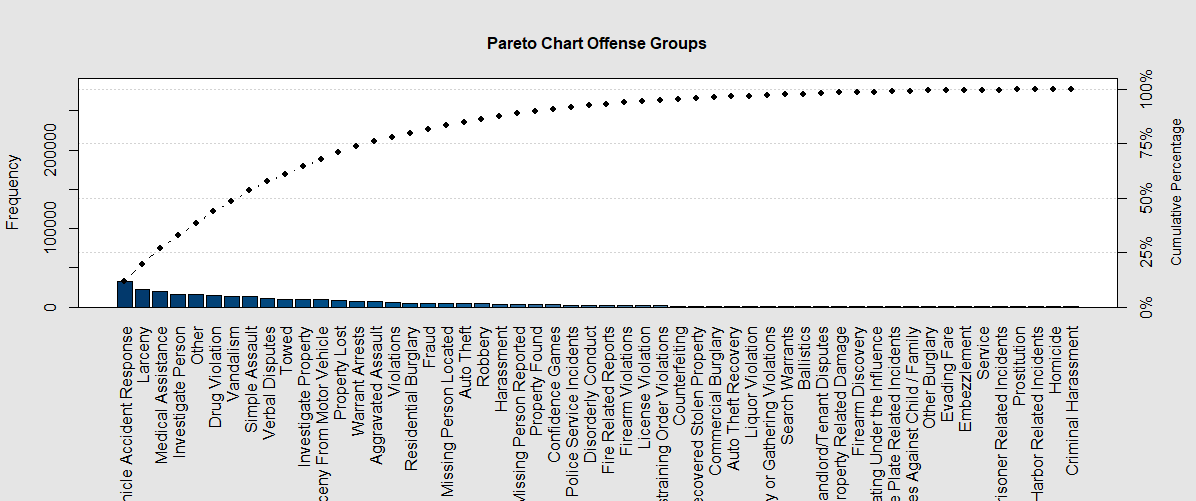 Figure 2: The Pareto Chart shows that around 75% of crimes are part of the top 15 most frequent offense groups. Note that representation above has been “cut” to hide infinitesimally small frequency offense groups.
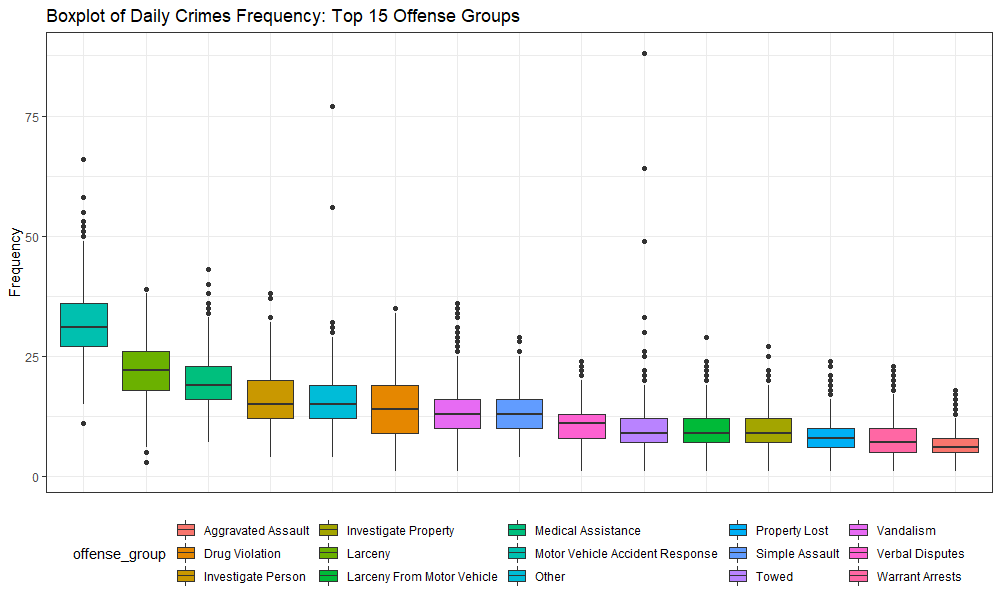 Figure 3. Boxplot on the Frequency for the Top 15 Offense Group
Figure 3 takes a closer look into the 15 highest offense groups and their daily crime frequency as displayed on Figure 1. As seen on this figure, Motor Vehicle Accident Response is by far the most common crime, followed by Larceny, Medical Assistance, Investigate Person and Other. Note the high-leverage outliers of Towed and Other.