ROI shape interpolation - ekatrukha/BigTrace GitHub Wiki
TL;DR (Summary):
- Voxel mode of interpolation is coarse-grained to centers of voxels;
- Smooth mode builds more smooth shape by using the running average of coordinates (depends on Smoothing window);
- Spline mode uses spline interpolation to the smooth approximation (also depends on Smoothing window);
- Usable Smoothing window values are in the range between 3 and 11 points;
Detailed description:
The loaded analyzed image (volume) consists of discrete blocks, called voxels (3D pixels). These blocks are arranged in a regular grid in XYZ space.
All ROIs are created in the plugin by sequentially assembling a set of 3D points/vertices. These points are defined as maximum-intensity voxels in the direction of the ray emanating from the mouse-clicked location.
Therefore each of these 3D points could be positioned only at the center of the grid's voxel cell.
The rest of the ROI's shape is determined by interpolation (i.e. what happens in between).
For visualization, analysis, and measurements it is common to treat ROIs as more continuous or smooth shapes.
The plugin has three main modes of ROI shape interpolation: voxel (grid level), smooth (averaged) and spline (continuous and most smooth).
This page describes the details of each interpolation depending on the ROI type.
Point3D ROI
Since it is just one point, its coordinates always belong to some voxel, and no interpolation is necessary.
It is independent of interpolation mode, results would always be the same.
The voxels inside a sphere of radius 0.5*floor(Point size) are used to measure intensity.
PolyLine3D ROI
PolyLine3D ROI consists of a set of points that are connected by lines. Basically, only points' coordinates are stored.
The selected mode of interpolation defines, how connecting lines are reconstructed. And how measurements will be performed along those lines.
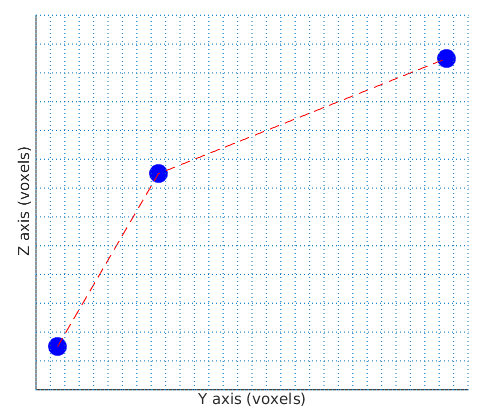
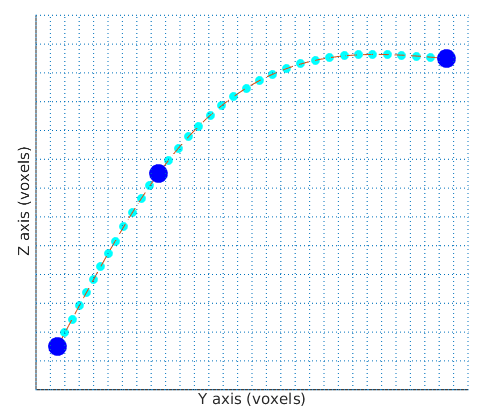
The picture below illustrates an example of PolyLine3D ROI in 2D case. The ROI's set of points is specified by blue dots and a voxel grid is shown.
In this example, for a more realistic illustration case, the voxel depth value is larger than the voxel height.
PolyLine3D ROI voxel
In the case of voxel interpolation, connecting segments between points will be reconstructed using Bresenham algorithm.
The last link provides detailed info, but it is just a way to draw a continuous line on a grid.
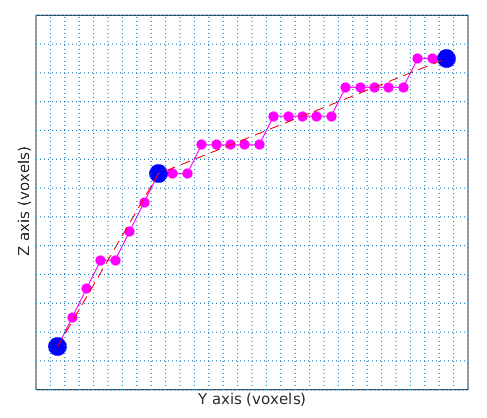
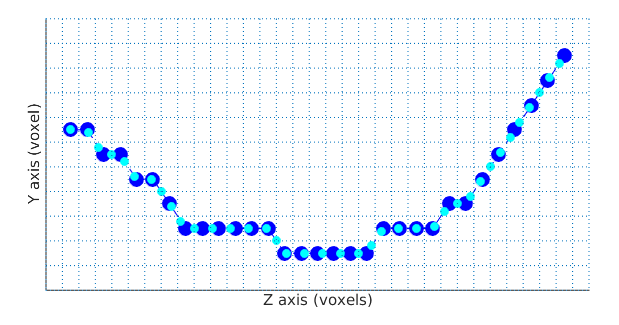
In this case, the base "backbone" curve will be passing through the centers of voxels (shown in purple/magenta in the picture below).
So it is a piece-wise linear polyline. The measured length of the curve would be equal to the arc length (sum of all segments).
For intensity measurements, this base curve will be sampled with a step equal to the minimum voxel size.
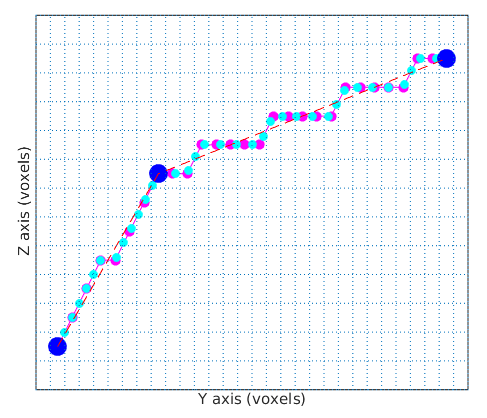
The tangents of the curve at sampling positions will be calculated using piece-wise linear interpolation (for coalignment measurements and visualization).
The sampled positions are shown in cyan on the second plot:
PolyLine3D ROI smooth
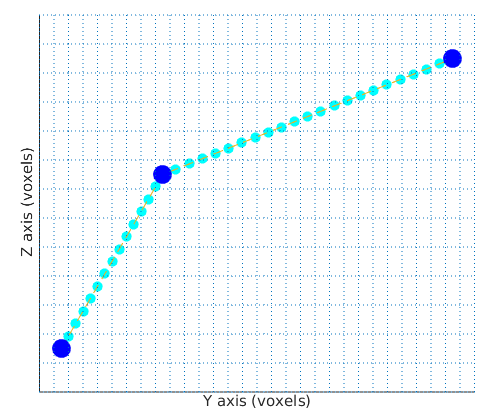
In the case of smooth interpolation, lines between points will be treated as continuous and sampled accordingly.
Here (and below) the sampled intensity/tangents locations are shown with cyan color dots.
The length of the curve will be equal to the sum of straight segments' lengths connecting defining vertices (so usually smaller than measured in voxel mode).
PolyLine3D ROI spline
In the spline mode polyline defining points will serve as nodes for the cubic spline interpolation.
The measured length will be equal to the arc lenght of the interpolating spline.
The curve will be sampled equidistantly along the spline's arclength:
Since its shape is pretty straightforward, Smoothing window parameter is not used for PolyLine3D ROI.
LineTrace3D ROI
Curve trace ROI created during Semi-auto tracing by design already represents a set of segments passing through "voxel" points.
LineTrace3D ROI voxel
In voxel interpolation mode this sequence will be used for the piecewise linear interpolation. In the picture below blue dots mark the positions of "voxel" points and cyan dots show points sampled along the curve (used for measurements).
LineTrace3D ROI smooth
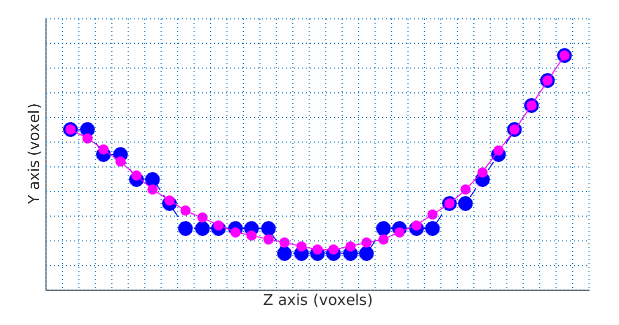
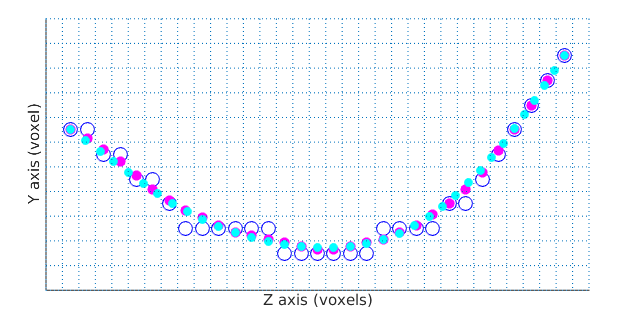
In the smooth mode smoothing is applied to each coordinate using the running average window of a specified size.
In the example below, magenta dots represent new curve points after the application of the smoothing with a window of 7 points.
So now this new "backbone" curve will be used for equidistant sampling (cyan dots on the second plot).
The smooth operation is applied to preserve the position of the ends of the trace. For that, for the first (and last) point the averaging window size is 1, for the second (and second before last) point it is equal to 3, and so on, until the window reaches the specified value.
The recommended size of the Smoothing window parameter is in the range of 3-11 points. But, of course, it depends on the specific tracing/application.
Since ROI appearance reflects this parameter, it is easy to spot artifacts. The large values of this parameter lead to "over smoothing", illustrated in an example below.
LineTrace3D ROI spline
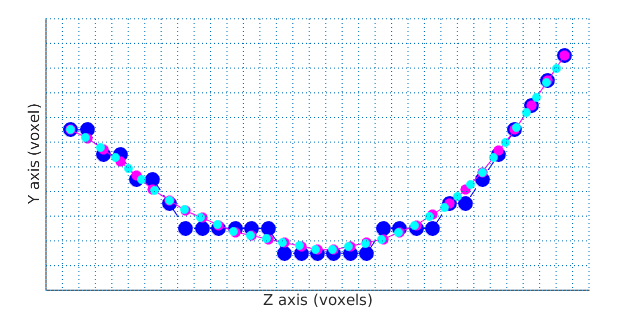
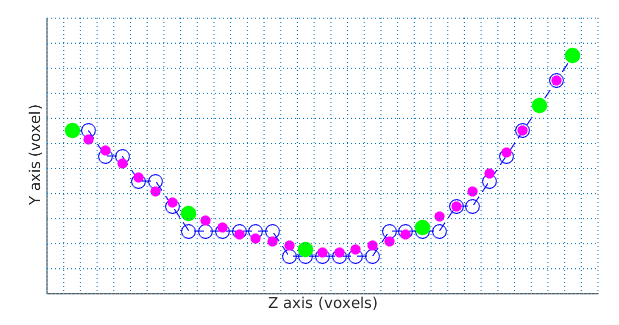
In spline mode, at the first step, a smooth version of the curve is built (magenta dots).
Then using the same Smoothing window parameter step, spline nodes points are selected from it (shown as green dots):
Notice that endpoints are always included.
Using these nodes, an interpolating cubic spline is built (green line):
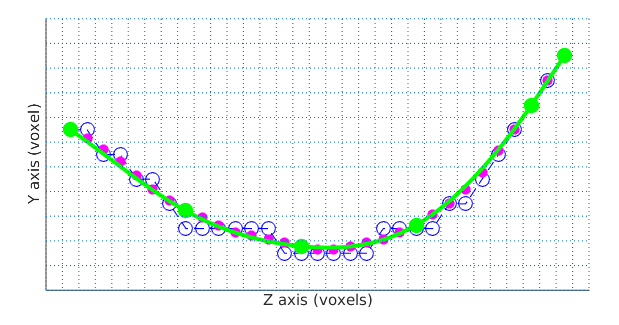
This spline is now sampled equidistantly along the spline arclength:
Tangent vectors at sampled locations are calculated from the interpolating spline.
Usually, this mode of shape interpolation is the most smooth with respect to the measurement parameters.
Sampling voxels intensity for the curve-like ROIs
The section above describes how curve-like ROIs are sampled along their arclength (taking into account corresponding curve interpolation).
But volumetric intensity measurement of a "thick" curve requires sampling voxels around the curve (as "inside the pipe around it").
For this purpose, the plugin first calculates the curve's tangent vectors at sampled locations. Then it constructs a set of normal planes (using rotation minimizing frame(https://github.com/ekatrukha/BigTrace/wiki/Panel-Measure#straighten).
After that it samples interpolated intensity values on a circular pixel grid in each plane.
Here is an example showing voxel sampled locations (green dots) in the first 5 normal planes of the curve ROI:

The radius of the circle is equal to 0.5*floor(Line thickness). So the efficient radius (and intensity values) will change only if the Line thickness parameter is increased (or decreased) by 2 pixels.
The pixelated circular shapes of line's profile for small thicknesses (radii) are shown below:
(2D hypersphere from imglib2 is used).