Install EFK stack on Minikube - duongphuhiep/blog1 GitHub Wiki
minikube addons enable efk
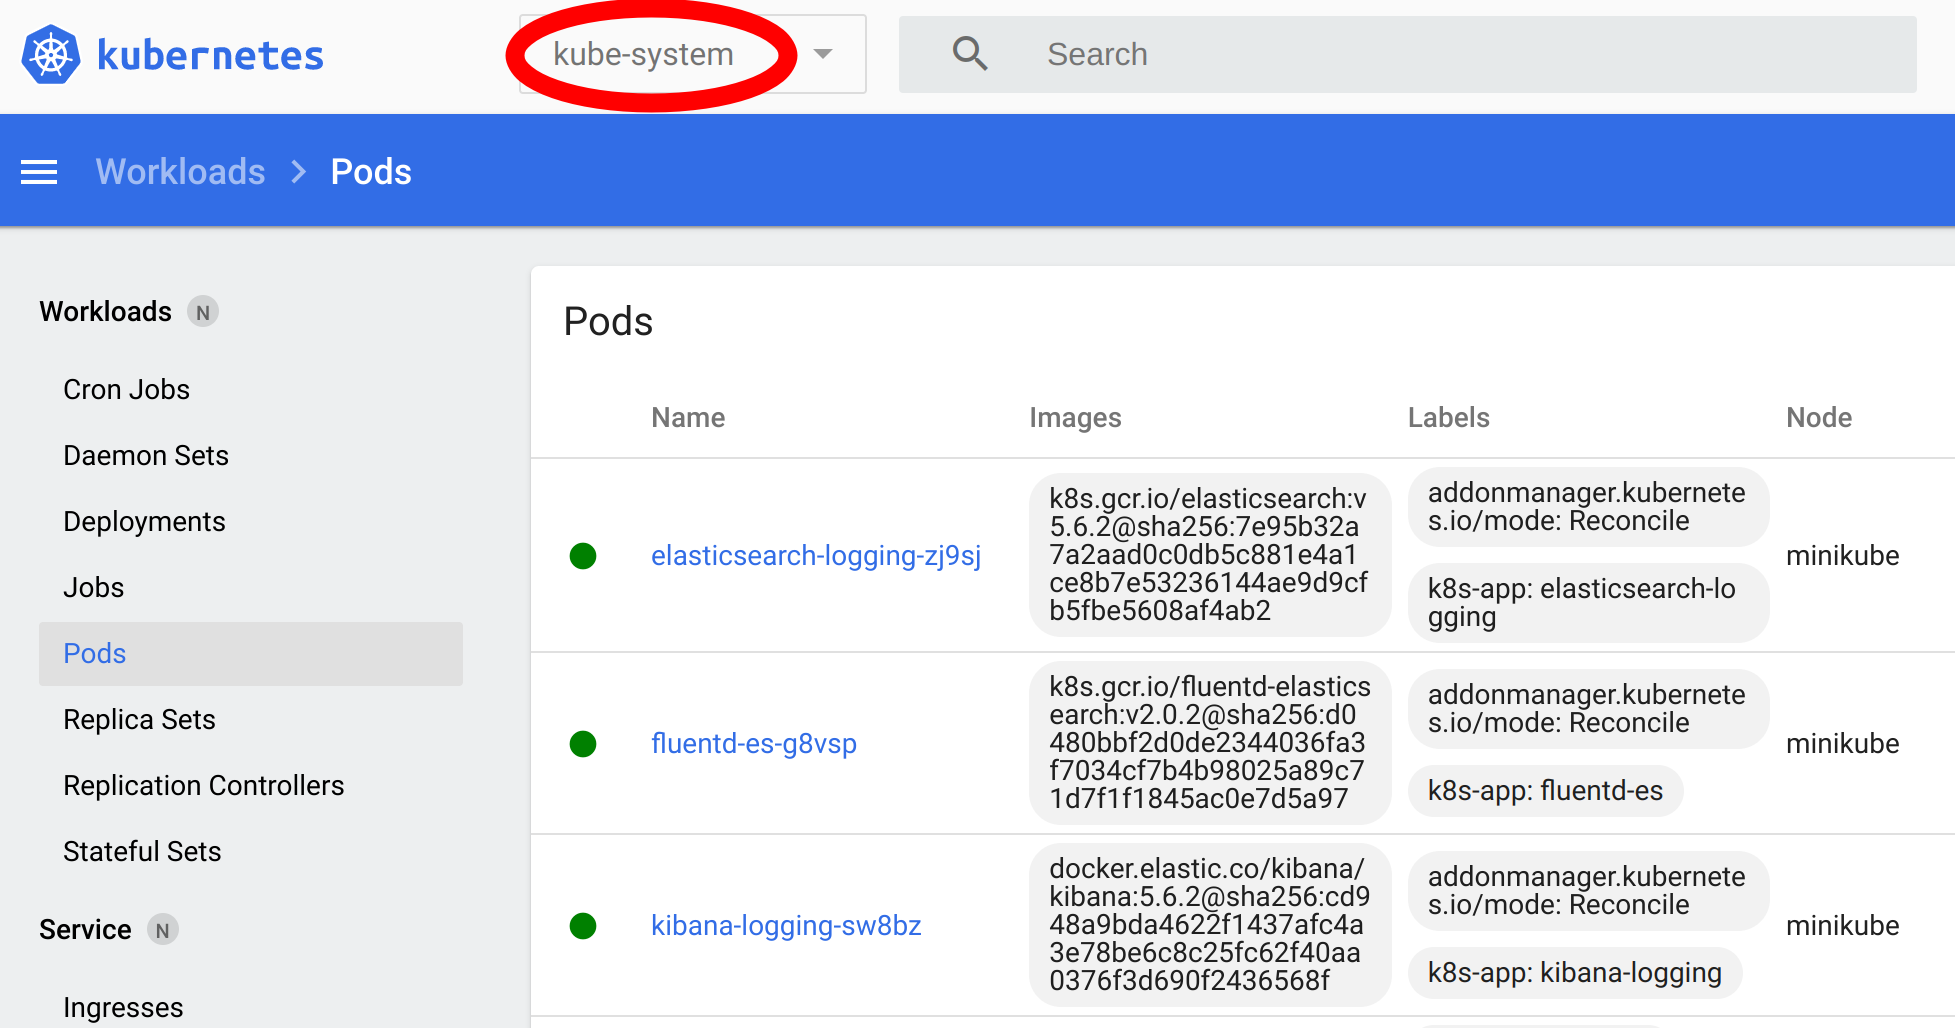
minikube addons listThe EFK stack is installed on the kube-system namespace
minikube service list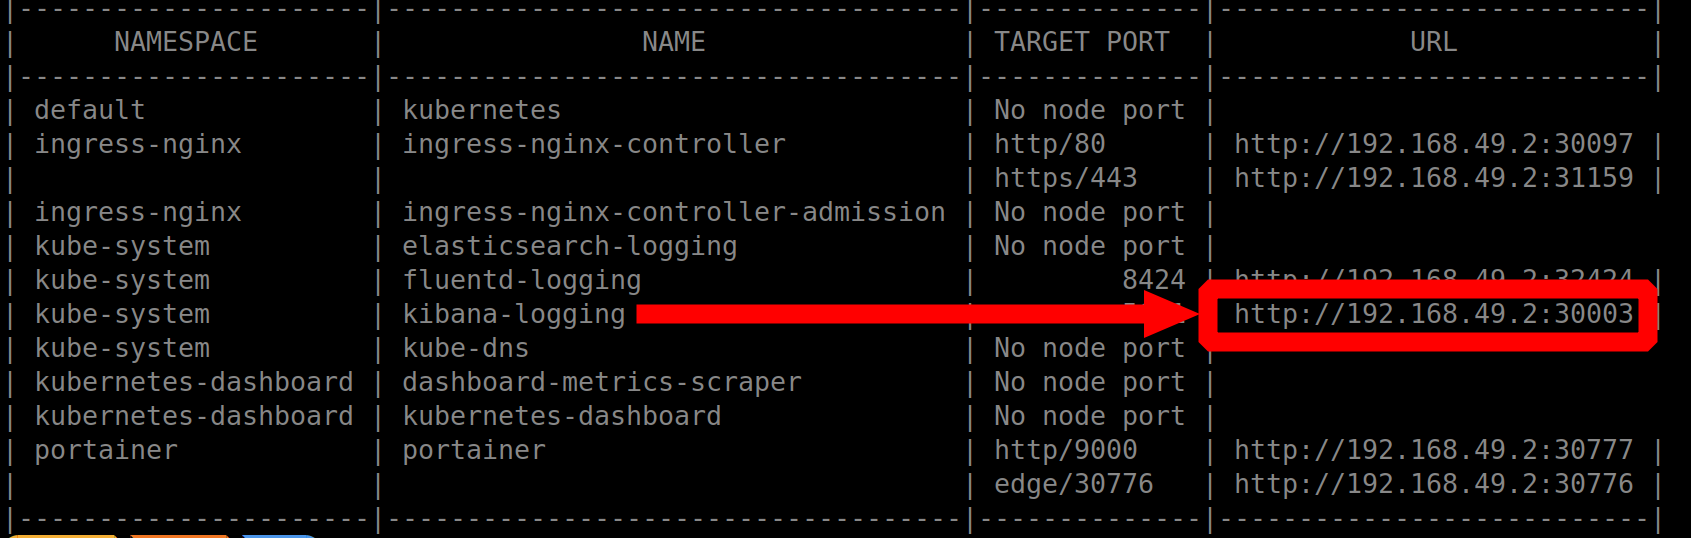
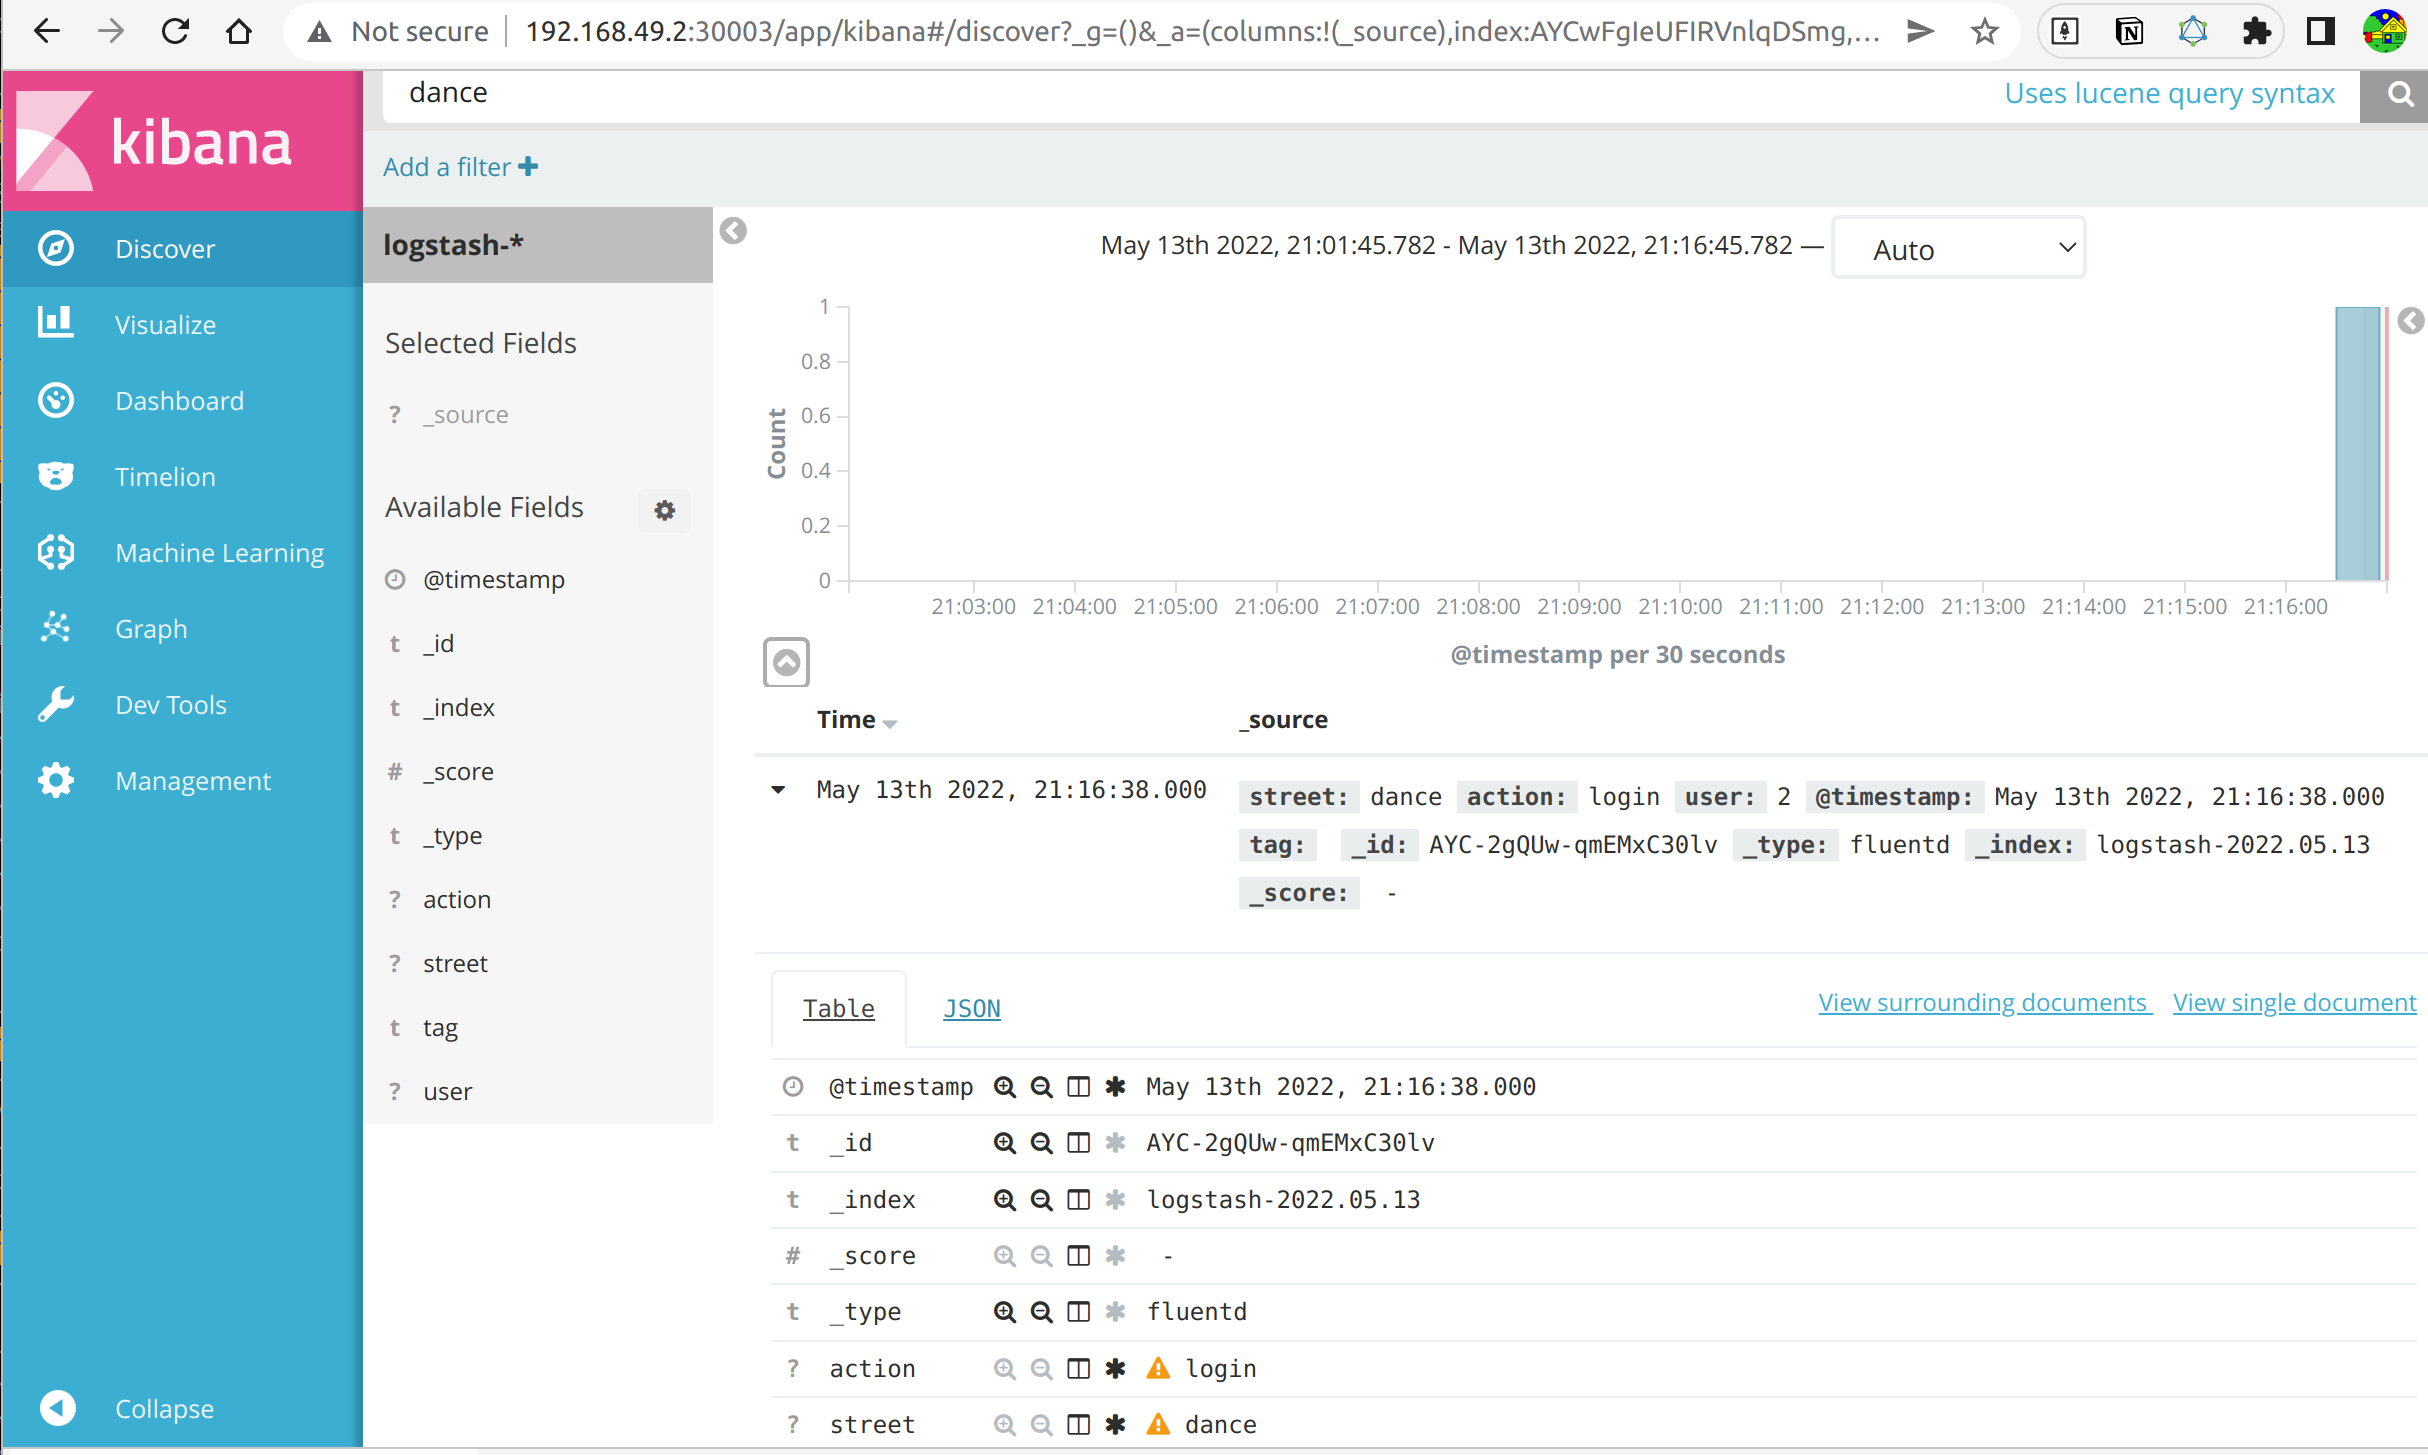
Open kibana on your browser...
As you can see, fluentd collects logs from many different sources, but it is not really what I want. My goal is to send logs to fluentd directly from my application. fluentd can accept log from HTTP, TCP, UDP, UNIX protocol... Most application or tooling support sending logs to http, so we will..
- First we will find where is the fluentd configuration? check the fluentd pod you will see
containers:
  volumeMounts:
    - name: config-volume
      mountPath: /etc/fluent/config.d

volumes:
  - name: config-volume
    configMap:
      name: fluentd-es-config
⇒ so the config of fluentd is in the ConfigMap fluentd-es-config
- shell-connect to the fluentd pod to find out the fluentd version, so that you can go the to the right fluentd documentation, and (sort of) understand the current value of the
fluentd-es-config -
following the documentation we will add to the
system.input.confthe following config
<source>
  @type http
  port 8424
  bind 0.0.0.0
  body_size_limit 32m
  keepalive_timeout 10s
</source>
so we will apply the following config map:
kubectl apply -f fluentd-configmap.yamlNow our fluentd application can collect logs data via http, port 8424
Unfortunately it can only collect logs data inside the pod (so it is quite useless)
apiVersion: v1
kind: Service
metadata:
  name: fluentd-logging
  namespace: kube-system
  labels:
    addonmanager.kubernetes.io/mode: Reconcile
    k8s-app: fluentd-logging
    kubernetes.io/minikube-addons: efk
spec:
  ports:
    - protocol: TCP
      port: 8424
      targetPort: 8424
      nodePort: 32424
  selector:
    k8s-app: fluentd-es
  type: NodePort
I created the fluentd-logging service so that my application can send log to fluentd
- from inside the K8s cluster, via
fluentd-logging:8424 - or from outside the K8s cluster, via
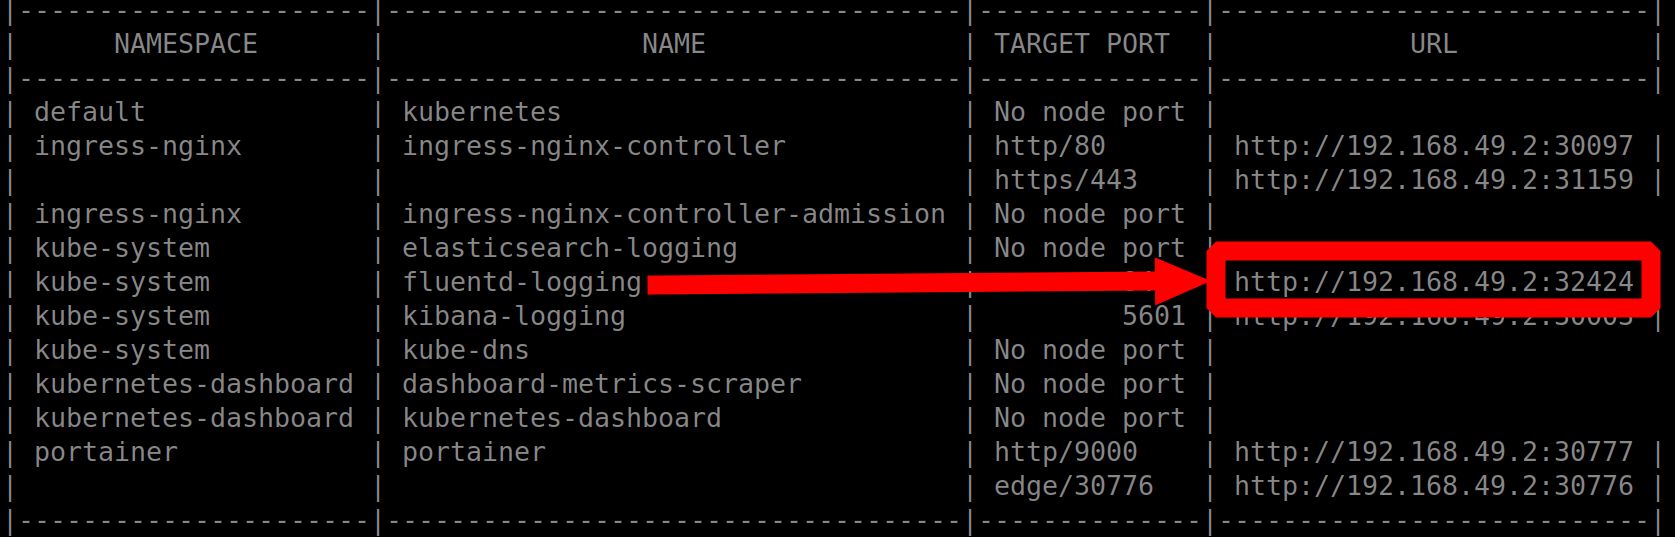
now we will send a log message to fluentd (from outside the minikube)
curl -X POST -d 'json={"action":"login","user":2, "street": "dance"}' http://192.168.49.2:32424/and we should be able to see this log message on Kibana