Tracers - draios/sysdig GitHub Wiki
Sysdig tracers let you track and measure spans of execution in a distributed software system. You can instrument almost anything with a Sysdig tracer - a method in your software, a service call, a network request, a shell command execution, a script, and any other thing that can happen in a computer system. Once you instrument something with a sysdig tracer, you can monitor how long it takes to complete, you can observe the system activity taking place inside it, or you can trace how it progresses through your system.
Tracers were designed to be efficient, extremely easy to use, leverageable from everywhere (inside and outside your source code) and container friendly.
If you've never heard of Sysdig tracers, you might want to start with this introductory blog post, which includes some simple examples.
- Terminology and Basic Concepts
- Emitting Tracers
- Collecting Tracers into Capture Files
- Tracer Analysis with Csysdig
- Tracer Analysis with Sysdig
- Trace-Aware Log Collecting
- Exporting Trace Information Using statsd
Let's define some basic terms for context: tracers, tracer events, spans, and traces.
A tracer is like a marker for a point in time in execution. Tracers always come in pairs: an entry tracer, which delimits the beginning of a span, and a corresponding exit tracer, which closes the span. A span, therefore, is the interval of execution delimited by two corresponding tracers. Spans can be nested, which means that a span can contain other spans. The root of a span tree is called a trace.
Tracers are created by writing specially formatted text strings to /dev/null. If you can write to /dev/null, you can emit a tracer. Sysdig automatically monitors /dev/null and captures tracers before they are discarded.
When sysdig captures a tracer, it is parsed and converted into a special tracer event that becomes part of the sysdig events stream. These tracer events can be filtered and visualized in sysdig and csydig as if they were standard events. However, they also carry additional state that makes them useful for tracing. Tracers, and therefore spans, have properties (ID, tags, arguments) that will be described below in this document.
To create a tracer, you need to write a text string to /dev/null. Sysdig supports two tracer formats: simple and JSON. The two formats share the same fields; what changes is the syntax to express them. The simple format is a bit more human friendly and is a bit faster (both to generate and to parse), while the JSON one is a bit more machine friendly and slightly more flexible with special characters.
This is the syntax of the simple format:
<direction>:<ID>:<tag1>.<tag2>...:<argname1>=<val1>,<argname2>=<val2>...
Note that if you want to use reserved chacters like ., , or = you need to prepend them with a ''.
This is the syntax of the simple format:
["<direction>", <ID>, ["tag1", "tag2"...], [{\"argname1\":\"argval1\"}, {\"argname2\":\"argval2\"}...]]
During the rest of the document I will use the simple format in the examples.
-
direction can be
>(to specify an entry tracer event) or<(to specify an exit tracer event) -
ID is a 64-bit integer number that you can use to uniquely identify a span and its children, on the same machine or across multiple machines. The ID is optional and set to zero if you don't specify it. You can use any number, but if you want to track things across multiple spans it should be unique. When correlating spans, it's your responsibility to propagate the ID across tiers. The following special IDs are are available to simplify the creation of locally unique IDs:
- t: use the thread ID as the tracer ID. This works well in multi-threaded servers.
- p: use the process PID as the tracer ID. This works well with single process applications.
- pp: use the parent PID as the tracer ID. This works well in shell scripts.
- tags is a list of one or more strings separated by periods. The tags section acts as a descending hierarchy with two purposes: (1) naming the span and (2) declaring its ancestors. For example, the tag 'api.login.database' specifies a span called 'database', whose parent span is 'login', whose parent span is 'api'.
- arguments is an optional list of key-value pairs to be associated with the tracer. Arguments could be anything, but common examples are things like function call arguments, return values or metadata like URLs or usernames.
Emitting a tracer involves a write to /dev/null. The time required to do that varies a lot based on the hardware and software configuration but you can conservatively assume it's in the order of 1 microsecond. This means that you should expect to see substantial slowdowns if you use tracers to instrument high frequency events that happen millions of times per second.
This is the simplest possible 'entry' tracer, with no ID and no arguments:
>::mytag::
And this is the corresponding 'exit' tracer:
<::mytag::
This tracer identifies a login request. It has numeric ID 123 and a 'username' argument:
>:123:login:username=loris:
And this is the corresponding 'exit' tracer. Note how ID and tags must be the same, but the arguments can be different:
<:123:login::
Similar to the last example, these two tracers identify a login request. Assuming the request is served by its own thread, we avoid manually creating a unique id and we just use 't'. The tracer will have the thread TID as the ID:
>:t:login:username=loris:
<:t:login::
This last example shows how use tags to define nesting. We are reporting a data request and a SQL query which is part of it. Note how we use the same ID, but the parent request has only one tag while the child one has two:
>:123:datarequest::
>:123:datarequest.dbquery:query=SELECT * FROM alldata:
<:123:datarequest.dbquery::
<:123:datarequest::
Assuming /dev/null is available in the container (which should always be the case), you don't need to do anything different to emit tracers from inside a container. Sysdig will automatically tag the tracers with the proper container information, and you will be able to consume the tracers you emit from the same container, from a separate container or from the main host.
The simplest thing you can do with tracers is saving them to a capture file. This is very easy since tracers are just like any other sysdig event:
> sudo sysdig -w myfile.scap
If you are not interested in system events, you can also create smaller files with just the tracers in them:
> sudo sysdig -w myfile.scap evt.type=tracer
You can also select a subset of the tracers you want to save:
> sudo sysdig -w myfile.scap "evt.type=tracer and span.tag[0]=datarequest and span.duration>1000000"
Csysdig offers a nice drill-down based console UI to analyze traces and spans. It lets you either analyze a live system or open a capture file that was generated on the local machine or on a different machine:
> csysdig -r myfile.scap
You will find three span-related views in csysdig: Traces Spectrogram, Traces Summary and Traces List. Combined together, these views offer a pretty powerful workflow to explore trace performance as an aggregate or for the single traces or even spans.
Traces Spectrogram
A visual spectrogram-based representation of the traces latency (i.e. the latency of the root spans), looking something like this:
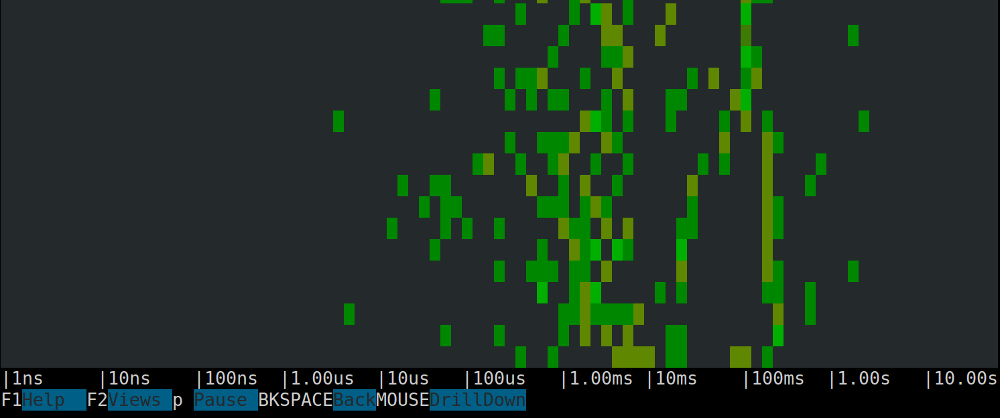
For information about the Csysdig spectrogram you can refer to this blogpost. Remember that, when you see an area worth investigating, you can drill down and see the list of traces generating it using the mouse.
Traces Summary
A summary of the traces executing in the system. For each trace tag, the view reports information like how many spans with that tag have executed and what's the average duration.
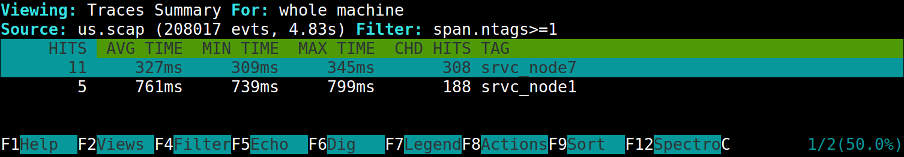
By collapsing multiple spans with the same tag into a single entry this view offers a compact summary of trace activity. You can click enter on an entry to drill down and see how time is spent on average inside it.
Traces List
The detailed list of the traces executing in the system. For each single executed trace, the view reports information like the timestamp, the duration and the arguments.

Again, you can click enter on an entry to drill down and see how time is distributed among its child spans.
With Sysdig, you can go one level deeper and inspect system activity inside spans and traces. First of all, sysdig offers two families of tracer-specific filter fields: span.* and evtin.*.
span.* fields let you create filters that apply to spans. Here is the list of fields you can use:
| Field Name | Description |
|---|---|
| span.id | ID of the span. This is a unique identifier that is used to match the enter and exit tracer events for this span. It can also be used to match different spans belonging to a trace. |
| span.time | time of the span's enter tracer as a human readable string that includes the nanosecond part. |
| span.ntags | number of tags that this span has. |
| span.nargs | number of arguments that this span has. |
| span.tags | dot-separated list of all of the span's tags. |
| span.tag | one of the span's tags, specified by 0-based offset, e.g. 'span.tag[1]'. You can use a negative offset to pick elements from the end of the tag list. For example, 'span.tag[-1]' returns the last tag. |
| span.args | comma-separated list of the span's arguments. |
| span.arg | one of the span arguments, specified by name or by 0-based offset. E.g. 'span.arg.xxx' or 'span.arg[1]'. You can use a negative offset to pick elements from the end of the tag list. For example, 'span.arg[-1]' returns the last argument. |
| span.enterargs | comma-separated list of the span's enter tracer event arguments. For enter tracers, this is the same as evt.args. For exit tracers, this is the evt.args of the corresponding enter tracer. |
| span.enterarg | one of the span's enter arguments, specified by name or by 0-based offset. For enter tracer events, this is the same as evt.arg. For exit tracer events, this is the evt.arg of the corresponding enter event. |
| span.duration | delta between this span's exit tracer event and the enter tracer event. |
| span.duration.human | delta between this span's exit tracer event and the enter event, as a human readable string (e.g. 10.3ms). |
As an example, this command line displays all of the spans that contain the string api in the tags section and that take longer than 1 second to return:
> sudo sysdig "span.tags contains api and span.duration>1000000000"
evtin.* fields let you filter sysdig events based on the properties of the spans that generated them. For example, this command line will list the file opens generated inside spans with 'query' as tag:
> sudo sysdig evt.type=open and evtin.tag=query
This functionality is useful for narrowing down sysdig usage to specific portions of an application or to specific transactions.
Here is the list of fields you can use (note that you can use these fields for filtering only, not for display):
| Field Name | Description |
|---|---|
| evtin.span.id | accepts all the events that are between the entry and exit tracers of the spans with the given ID and are generated by the same thread that generated the tracers. |
| evtin.span.ntags | accepts all the events that are between the entry and exit tracers of the spans with the given number of tags and are generated by the same thread that generated the tracers. |
| evtin.span.nargs | accepts all the events that are between the entry and exit tracers of the spans with the given number of arguments and are generated by the same thread that generated the tracers. |
| evtin.span.tags | accepts all the events that are between the entry and exit tracers of the spans with the given tags and are generated by the same thread that generated the tracers. |
| evtin.span.tag | accepts all the events that are between the entry and exit tracers of the spans with the given tag and are generated by the same thread that generated the tracers. See the description of span.tag for information about the syntax accepted by this field. |
| evtin.span.args | accepts all the events that are between the entry and exit tracers of the spans with the given arguments and are generated by the same thread that generated the tracers. |
| evtin.span.arg | accepts all the events that are between the entry and exit tracers of the spans with the given argument and are generated by the same thread that generated the tracers. See the description of span.arg for information about the syntax accepted by this field. |
| evtin.span.p.id | same as evtin.span.id, but also accepts events generated by other threads in the same process that produced the span. |
| evtin.span.p.ntags | same as evtin.span.ntags, but also accepts events generated by other threads in the same process that produced the span. |
| evtin.span.p.nargs | same as evtin.span.nargs, but also accepts events generated by other threads in the same process that produced the span. |
| evtin.span.p.tags | same as evtin.span.tags, but also accepts events generated by other threads in the same process that produced the span. |
| evtin.span.p.tag | same as evtin.span.tag, but also accepts events generated by other threads in the same process that produced the span. |
| evtin.span.p.args | same as evtin.span.args, but also accepts events generated by other threads in the same process that produced the span. |
| evtin.span.p.arg | same as evtin.span.arg, but also accepts events generated by other threads in the same process that produced the span. |
| evtin.span.s.id | same as evtin.span.id, but also accepts events generated by the script that produced the span, i.e. by the processes whose parent PID is the same as the one of the process generating the span. |
| evtin.span.s.ntags | same as evtin.span.ntags, but also accepts events generated by the script that produced the span, i.e. by the processes whose parent PID is the same as the one of the process generating the span. |
| evtin.span.s.nargs | same as evtin.span.nargs, but also accepts events generated by the script that produced the span, i.e. by the processes whose parent PID is the same as the one of the process generating the span. |
| evtin.span.s.tags | same as evtin.span.tags, but also accepts events generated by the script that produced the span, i.e. by the processes whose parent PID is the same as the one of the process generating the span. |
| evtin.span.s.tag | same as evtin.span.tag, but also accepts events generated by the script that produced the span, i.e. by the processes whose parent PID is the same as the one of the process generating the span. |
| evtin.span.s.args | same as evtin.span.args, but also accepts events generated by the script that produced the span, i.e. by the processes whose parent PID is the same as the one of the process generating the span. |
| evtin.span.s.arg | same as evtin.span.arg, but also accepts events generated by the script that produced the span, i.e. by the processes whose parent PID is the same as the one of the process generating the span. |
| evtin.span.m.id | same as evtin.span.id, but accepts all the events generated on the machine during the span, including other threads and other processes. |
| evtin.span.m.ntags | same as evtin.span.ntags, but accepts all the events generated on the machine during the span, including other threads and other processes. |
| evtin.span.m.nargs | same as evtin.span.nargs, but accepts all the events generated on the machine during the span, including other threads and other processes. |
| evtin.span.m.tags | same as evtin.span.tags, but accepts all the events generated on the machine during the span, including other threads and other processes. |
| evtin.span.m.tag | same as evtin.span.tag, but accepts all the events generated on the machine during the span, including other threads and other processes. |
| evtin.span.m.args | same as evtin.span.args, but accepts all the events generated on the machine during the span, including other threads and other processes. |
| evtin.span.m.arg | same as evtin.span.arg, but accepts all the events generated on the machine during the span, including other threads and other processes. |
note: if you would like an overview of what a Sysdig chisel is, take a look at this page.
The evtin.* filters are very effective when used in conjunction with chisels, thanks to the fact that they allow you to narrow the scope of a chisel to a particular portion of your software. Here are some examples.
List the files accessed in the spans that are part of the trace with ID 123, sorted by amount of I/O:
> sudo sysdig -c topfiles_bytes evtin.span.id=123
Print all the data sent or received on the network by spans with tag 'query':
> sudo sysdig -c echo_fds evtin.span.tag=query
Print all the data sent or received on the network by spans with tag 'query' and their child spans:
> sudo sysdig -c echo_fds evtin.span.tag[0]=query
A powerful way to use chisels in conjunction with tracer-based filters is the ability to display logs in the context of traces and spans. This is accomplished by using sysdig's spy_logs chisel in conjunction with evtin.* filters. Here are some examples:
Print the log entries written by any span in the trace with ID 123:
> sudo sysdig -c spy_logs evtin.span.id=123
Show the logs generated from inside spans whose last tag is 'query':
> sudo sysdig -c spy_logs evtin.span.tag[-1]=query
Combining filter fileds in arbitrary expressions offers a lot of flexibility in terms of slicing and dicing logs and isolating the specific parts of interest.
Note how this will pick up log writes generated by any containers running on the machine from the host or from inside the sysdig container.
All of the use cases described up to this point are command line-oriented and by their nature interactive. They focus on drilling down and pinpointing performance problems. However, you will often want to pipe trace and span latencies to your monitoring system of choce in order to display them in dashboards or create alerts on them.
Fortunately, there's a chisel for that!
Just run:
> sudo sysdig -c tracers_2_statsd "<ip> <port>"
Where ip and port are the statsd server endpoint information.
Again, Note how this will pick metrics not only from the host, but from any container as well.