WM payload timings on different workflow types - dmwm/WMCore GitHub Wiki
WM payload timings on different workflow types
This wiki section analyzes different workflow types timing metrics in order to identify potential areas of improvement, in terms of efficiency of the payloads at runtime. The following github issue added some time metrics at the payload level. This is meant to address https://github.com/dmwm/WMCore/issues/11746
Some timing related definitions
First, let's define the metrics used from the JobArchiver reports that we use.
WMTiming.WMTotalWallClockTime
This is the wallclock time measured from the job wrapper
Step wallclock times
Each workflow step (e.g.: cmsRun1, StageOut1, etc) in the JobArchives report has a stopTime and startTime. We use this to measure the wallclock time spent in each step.
cmsRun times
There are two that we use in this wiki:
- WMCMSSWSubprocess.wallClockTime: This is the wallclock time of the subprocess call in the CMSSW executor. The starting and stopping times are define HERE. The difference between WMCMSSWSubprocess.wallClockTime and a cmsRun step wallclock time as a whole is mainly the fact that the latter also counts the other things running in the CMSSW executor in overall, like running the pre-scripts to do pset tweaking, configuring the scram environment, adding values to the job report after executing cmsRun, etc.
- performance.cmssw.Timing.TotalJobTime: This is the wall clock time from the beginning of main() to end of endJob transition. It misses the wall clock time spent before main(), and in the shutdown of the framework (i.e. from end of endJob to the end of the process. E.g.: when adding these metrics to the report)
Payload timing evaluation on different workflow types
Using the reports from JobArchiver from different workflows, the metrics from above were collected and roughly studied to check for runtime efficiency.
The following efficiency values are defined for this test:
Efficiency of SumOfAllSteps vs Wrapper (WC time)
If a workflow is composed of the following steps:
- cmsRun1
- stageOut1
- logArch1
Then, we add up the wallclock times of all these steps and compare it to the overall wallclock time from the wrapper (WMTiming.WMTotalWallClockTime).
Eff_sumAllSteps_vs_wrapper = (wcTime[cmsRun1] + wcTime[stageOut1] + wcTime[logArch1]) / WMTiming.WMTotalWallClockTime * 100%
Total Efficiency of cmsRuns SubProcess WC Times vs Wrapper WC Time
This value compares the sum of all the wallclock times of subprocess calls executing cmsRun steps compared to the overall wallclock time from the wrapper. It is useful to see how much we spend in actual data processing vs other things (stageout, log archiving, etc).
Eff_AllcmsRunsSubProcess_vs_wrapper = (WMCMSSWSubprocess.wallClockTime[cmsRun1] + WMCMSSWSubprocess.wallClockTime[cmsRun2] + ... ) / WMTiming.WMTotalWallClockTime * 100%
So, in the example above, with only a single cmsRun1 executable, we simply have:
Eff_AllcmsRunsSubprocess_vs_wrapper = WMCMSSWSubprocess.wallClockTime[cmsRun1] / WMTiming.WMTotalWallClockTime * 100%
Efficiency of cmsRun step TotalJobTime vs WMCMSSWSubprocess
This value compares (for a single cmsRun step) the totalJobTime vs the subprocess call wallclock time.
Eff_cmsRun_vs_subprocess = TotalJobTime[cmsRun1] / WMCMSSWSubprocess[cmsRun1]
Efficiency of cmsRun subprocess wallclock time vs CmsRun step wallclock time
This value will tell us how efficient the subprocess call is, compared to the whole cmsRun executor step, which includes tweaking of the psets, managing job reports, calling condor chirp to inject classads via condor, etc.
Collecting the metrics for different Workflow types
In order to collect the different timing parameters from the reports, the following script was written and the std output was saved as a log file.
ReReco
The following workflows were used:
- https://cmsweb.cern.ch/reqmgr2/fetch?rid=pdmvserv_Run2022F_MinimumBias_JMENano12p5_231113_205421_1560
- https://cmsweb.cern.ch/reqmgr2/fetch?rid=llavezzo_Run2023D_ParkingDoubleMuonLowMass4_22Sep2023_v2_231110_184109_4096
- https://cmsweb.cern.ch/reqmgr2/fetch?rid=llavezzo_Run2023C_NoBPTX_22Sep2023_v4_231110_181323_1042
- https://cmsweb.cern.ch/reqmgr2/fetch?rid=pdmvserv_Run2017E_SinglePhoton_UL2017_MiniAODv2_BParking_231108_233223_2058
TaskChain
For TaskChain workflows, the following list was used:
- MC:
- GS, DIGI Premix, RECO, MINIAOD, NANOAOD
- https://cmsweb.cern.ch/reqmgr2/fetch?rid=pdmvserv_task_GEN-Run3Summer22wmLHEGS-00649__v1_T_231124_061031_2943. -
- https://cmsweb.cern.ch/reqmgr2/fetch?rid=pdmvserv_task_GEN-Run3Summer22EEwmLHEGS-00530__v1_T_231124_055947_3401
- https://cmsweb.cern.ch/reqmgr2/fetch?rid=pdmvserv_task_B2G-RunIISummer20UL18wmLHEGEN-02655__v1_T_231116_091118_6040 -
- https://cmsweb.cern.ch/reqmgr2/fetch?rid=pdmvserv_task_TOP-RunIISummer15wmLHEGS-00641__v1_T_231113_190859_2952
- MINIAOD, NANOAOD
- NANOAOD:
- https://cmsweb.cern.ch/reqmgr2/fetch?rid=wjang_task_BTV-Run3Summer22EENanoAODv12-00066__v1_T_231123_063631_3603
- https://cmsweb.cern.ch/reqmgr2/fetch?rid=pdmvserv_task_BTV-Run3Summer23BPixNanoAODv12-00061__v1_T_231123_092447_8304
- GS, DIGI Premix, RECO, MINIAOD, NANOAOD
StepChain
- MC
- https://cmsweb.cern.ch/reqmgr2/fetch?rid=cmsunified_task_GEN-Run3Summer22EEwmLHEGS-00551__v1_T_231220_062740_9436
- https://cmsweb.cern.ch/reqmgr2/fetch?rid=cmsunified_task_GEN-Run3Summer22wmLHEGS-00675__v1_T_231220_062502_4314
- https://cmsweb.cern.ch/reqmgr2/fetch?rid=cmsunified_task_GEN-Run3Summer23BPixwmLHEGS-00396__v1_T_231220_063047_9133
- https://cmsweb.cern.ch/reqmgr2/fetch?rid=cmsunified_task_GEN-Run3Summer23wmLHEGS-00410__v1_T_231220_062854_6990
- https://cmsweb.cern.ch/reqmgr2/fetch?rid=cmsunified_task_GEN-Run3Summer23wmLHEGS-00411__v1_T_231220_062726_3618
- https://cmsweb.cern.ch/reqmgr2/fetch?rid=haozturk_task_BPH-GenericGSmearS-00004__v1_T_231219_141016_1739
Results
The logfiles from the workflows above, as well as the script used to get these can be found in:
https://github.com/khurtado/wmcore-scripts/tree/main/logs_metricsCollector
Analysis
Workflow tarballs
All of the tarballs from JobArchiver used for this study can be found in the following repository.
https://gitlab.cern.ch/khurtado/wmcore-issue11746.git
These tarballs have the condor logfiles, wmagent logfile and the report used to collect the metrics.
ReReco
From the logfiles, we can see:
Efficiency of SumOfAllSteps vs Wrapper (WC time)
We compare the wallclock time of all steps combined vs the bash submit wrapper wall clock time in this case. The plots below show most of the efficiency values are above 95%. In fact, efficiency is above 99% for about 73% of the cases, and around 88% of them are above 95%.
The scatter plots show, some cases falling in the 25-40% efficiency range, some ~40-80%, etc. These will be described further.

- The jobs falling in the 25-40% are cleanup jobs These are very short jobs, so the 1-2 seconds extra time from the submit wrapper outside the job step itself (for bootstrapping, setting up the environment, unpacking the job, etc) represent a big fraction of the overall wallclock time. Jobs falling in the 40-95% are mostly logCollect jobs and above that.
Report file: ../llavezzo_Run2023C_NoBPTX_22Sep2023_v4_231110_181323_1042/JobCluster_3854/Job_3854980.tar.bz2
WMTimes collected: {'WM_wrapper': 2.0, 'cleanupUnmergedNANOEDMAODoutput': 0.6507425308227539}
Efficiency of SumOfAllSteps vs Wrapper (WC time) = 32.537126541137695 %

Report file: ../llavezzo_Run2023D_ParkingDoubleMuonLowMass4_22Sep2023_v2_231110_184109_4096/JobCluster_3929/Job_3929664.tar.bz2
WMTimes collected: {'WM_wrapper': 9.0, 'logCollect1': 7.047372102737427}
Efficiency of SumOfAllSteps vs Wrapper (WC time) = 78.3041344748603 %

Report file: ../pdmvserv_Run2022F_MinimumBias_JMENano12p5_231113_205421_1560/JobCluster_3771/Job_3771230.tar.bz2
WMTimes collected: {'WM_wrapper': 184.0, 'cmsRun1': 180.6218225955963, 'cmsRun1--WMCMSSWSubprocess': 157.50669932365417, 'cmsRun1--TotalJobTime': 155.497, 'stageOut1': 0.6426844596862793, 'logArch1': 0.6448183059692383}
Efficiency of SumOfAllSteps vs Wrapper (WC time) = 98.86376378328904 %
As for cmsRun jobs, which take longer, they were found to be between the 98.5-99.9% efficiency, which most of them being > 99.5 % range.
Report file: ../pdmvserv_Run2022F_MinimumBias_JMENano12p5_231113_205421_1560/JobCluster_3771/Job_3771230.tar.bz2
WMTimes collected: {'WM_wrapper': 184.0, 'cmsRun1': 180.6218225955963, 'cmsRun1--WMCMSSWSubprocess': 157.50669932365417, 'cmsRun1--TotalJobTime': 155.497, 'stageOut1': 0.6426844596862793, 'logArch1': 0.6448183059692383}
Efficiency of SumOfAllSteps vs Wrapper (WC time) = 98.86376378328904 %
- cmsRun metrics
[cmsRun1] Efficiency of cmsRun step TotalJobTime vs WMCMSSWSubprocess = 98.72405470225459
Efficiency of cmsRun step TotalJobTime vs WMCMSSWSubprocess
This efficiency compares the wallclock time as measured by CMSSW, compared to the wallclock time of the subprocess call our python runtime code. The plots below show most of them are close to 100% in terms of efficiency, with about 3 values in the 92-98% range.

A link to ElasticSearch for one of these jobs outlier jobs is provided HERE for further and deeper study.
GlobalJobId | vocms0255.cern.ch#24559.54#1699793120
Report file: ../llavezzo_Run2023C_NoBPTX_22Sep2023_v4_231110_181323_1042/JobCluster_3463/Job_3463914.tar.bz2
WMTimes collected: {'WM_wrapper': 781.0, 'cmsRun1': 772.5653328895569, 'cmsRun1--WMCMSSWSubprocess': 723.4739849567413, 'cmsRun1--TotalJobTime': 719.422, 'stageOut1': 4.440704584121704, 'logArch1': 0.7819702625274658}
Efficiency of SumOfAllSteps vs Wrapper (WC time) = 99.58873338491755 %
- cmsRun metrics
[cmsRun1] Efficiency of cmsRun step TotalJobTime vs WMCMSSWSubprocess = 99.43992665375748
Total Efficiency of cmsRuns totalJobTime vs Wrapper WC Time= 92.11549295774648 %
Total Efficiency of cmsRuns SubProcess WC Times vs Wrapper WC Time = 92.63431305464037 %
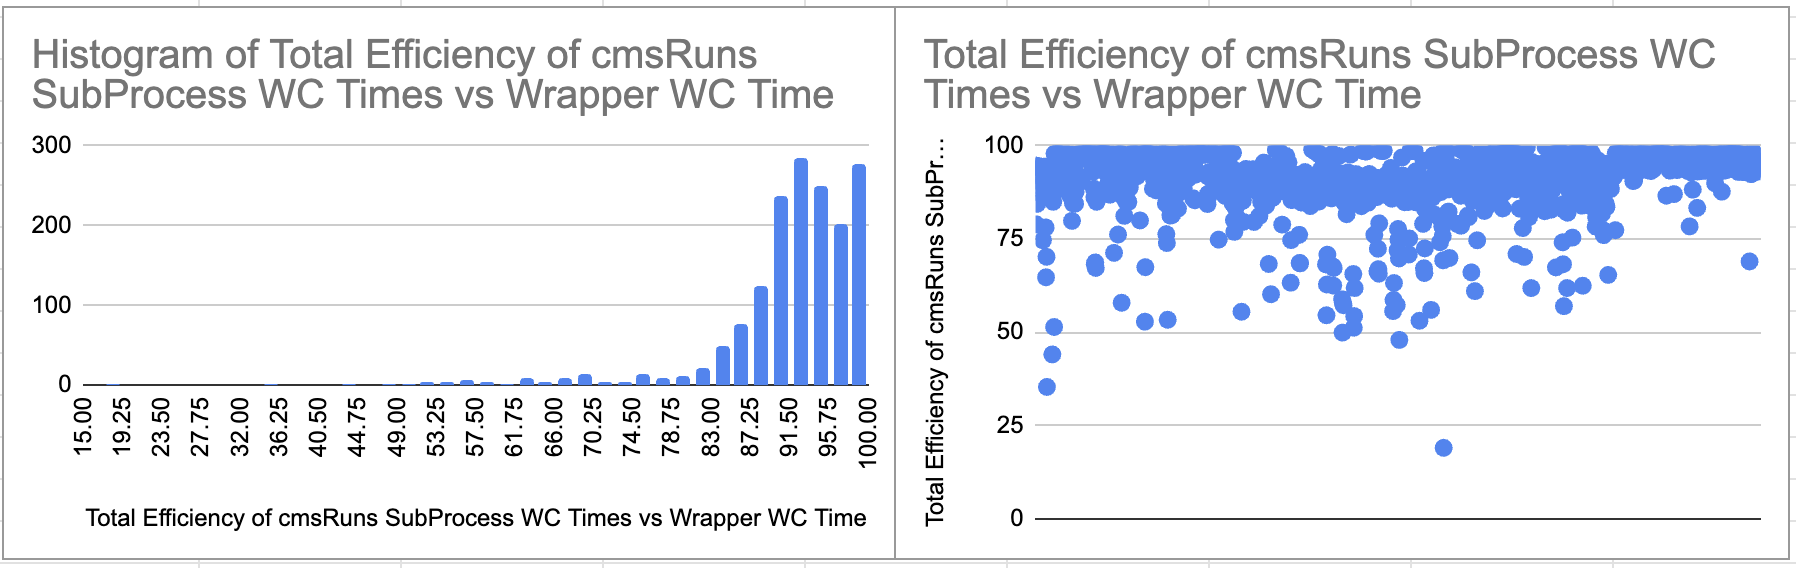
Total Efficiency of cmsRuns SubProcess WC Times vs Wrapper WC Time
This section only counts jobs where we had cmsRun steps. Here, we compare the total time spent by the total wallclock time from the subprocess calls that execute all the cmsRun steps (only one in this case, for taskChain), compared to the total time spent by the submit wrapper. This is useful to see what fraction of time is spent for the physics processing step itself compared to the rest of the steps in the wrapper (logArch, stageOut, etc).
From the plots below, you can see most of the time (93% of the time), the fraction of time spent in the subprocess call executing the cmsRun steps is greater than 80%. The other 7% of the time, this fraction ranges from 35 to 76%.

Most of the cases ranging from 35 to 76% in the plot above came from the fact that other steps took a good fraction of the overall time. E.g.: For short runtimes (500s or so), the fraction of time we take on logArch became relevant (100s vs 500s). For longer runtimes, the stageOut step was noticed to take considerably longer than usual (maybe due to waiting times while transferring to specific stageout sites). See below for some examples.
Report file: ../llavezzo_Run2023D_ParkingDoubleMuonLowMass4_22Sep2023_v2_231110_184109_4096/JobCluster_3443/Job_3443241.tar.bz2
WMTimes collected: {'WM_wrapper': 713.0, 'cmsRun1': 544.1535294055939, 'cmsRun1--WMCMSSWSubprocess': 516.0152742862701, 'cmsRun1--TotalJobTime': 513.667, 'stageOut1': 57.72491645812988, 'logArch1': 109.78102517127991}
Efficiency of SumOfAllSteps vs Wrapper (WC time) = 99.8119875224409 %
- cmsRun metrics
[cmsRun1] Efficiency of cmsRun step TotalJobTime vs WMCMSSWSubprocess = 99.5449215549834
Total Efficiency of cmsRuns totalJobTime vs Wrapper WC Time= 72.04305750350632 %
Total Efficiency of cmsRuns SubProcess WC Times vs Wrapper WC Time = 72.37240873580227 %

Report file: ../pdmvserv_Run2017E_SinglePhoton_UL2017_MiniAODv2_BParking_231108_233223_2058/JobCluster_3130/Job_3130375.tar.bz2
WMTimes collected: {'WM_wrapper': 25251.0, 'cmsRun1': 14536.169100284576, 'cmsRun1--WMCMSSWSubprocess': 14459.253759860992, 'cmsRun1--TotalJobTime': 14455.9, 'stageOut1': 10634.352474451065, 'logArch1': 78.751708984375}
Efficiency of cmsRun subprocess wallclock time vs CmsRun step wallclock time
This value is useful to see the fraction of time spent in the subprocess call executing cmsRun, compared to the cmsRun step wallclock time overall.
The plot below shows the timing difference between both (subprocess and step wallclock time), which goes from 0 to 3 minutes, being less than one minute more frequent case.

Looking at the efficiency plots, it can be seen that most of the time, this value goes above 90%. The few cases when this efficiency is low, is related to the fact the whole cmsRun step was short in comparison to other jobs in the same group.

Here are some examples of these job instances when this efficiency value was low vs high:
## Low efficiency examples:
Report file: ../llavezzo_Run2023C_NoBPTX_22Sep2023_v4_231110_181323_1042/JobCluster_3491/Job_3491141.tar.bz2
WMTimes collected: {'WM_wrapper': 151.0, 'cmsRun1': 146.13596558570862, 'cmsRun1--WMCMSSWSubprocess': 97.0088803768158, 'cmsRun1--TotalJobTime': 93.744, 'stageOut1': 0.6682217121124268, 'logArch1': 0.8234491348266602}

Report file: ../llavezzo_Run2023C_NoBPTX_22Sep2023_v4_231110_181323_1042/JobCluster_3388/Job_3388253.tar.bz2
WMTimes collected: {'WM_wrapper': 114.0, 'cmsRun1': 109.53393459320068, 'cmsRun1--WMCMSSWSubprocess': 43.89081883430481, 'cmsRun1--TotalJobTime': 40.8089, 'stageOut1': 1.3474843502044678, 'logArch1': 1.009159803390503}

## Higher efficiency example
Report file: ../llavezzo_Run2023C_NoBPTX_22Sep2023_v4_231110_181323_1042/JobCluster_3392/Job_3392875.tar.bz2
WMTimes collected: {'WM_wrapper': 4366.0, 'cmsRun1': 2403.6794939041138, 'cmsRun1--WMCMSSWSubprocess': 2324.237240076065, 'cmsRun1--TotalJobTime': 2314.12, 'stageOut1': 1675.252389907837, 'logArch1': 284.4559304714203}
As it can be seen, the overall time for the job in the cases where the efficiency was low was very short compared to the higher efficiency ones, which explains why the efficiency was low. These are Merge jobs. An ES link to one of these jobs is given HERE, for reference.
TaskChain
MonteCarlo
This section will take a look at all the MonteCarlo workflows gathered for this study, which includes all physics type jobs, hence some of them won't require any input data (e.g.: GS) and some others will.
Efficiency of SumOfAllSteps vs Wrapper (WC time)
The plot below shows the efficiency values for this sample for all jobs (cmsRun or not). About 92% of the sample had an efficiency of 95% or above. The other 8% of the jobs show efficiency that go as low as 1% to 90+%.

While looking into this 8% job sample, it was noted that almost all of them were cleanup jobs that have a short nature, hence the low efficiency. Jobs in the ~50+ % range were logCollect jobs. E.g.:
Report file: ../pdmvserv_task_TOP-RunIISummer15wmLHEGS-00641__v1_T_231113_190859_2952/JobCluster_5812/Job_5812680.tar.bz2
WMTimes collected: {'WM_wrapper': 8.0, 'cleanupUnmergedPREMIXRAWoutput': 1.1074304580688477}
Efficiency of SumOfAllSteps vs Wrapper (WC time) = 13.842880725860596 %

Report file: ../pdmvserv_task_HIG-Run3Summer22EEMiniAODv4-00018__v1_T_231116_235905_8905/JobCluster_5793/Job_5793153.tar.bz2
WMTimes collected: {'WM_wrapper': 11.0, 'logCollect1': 8.134520769119263}
Efficiency of SumOfAllSteps vs Wrapper (WC time) = 73.9501888101751 %
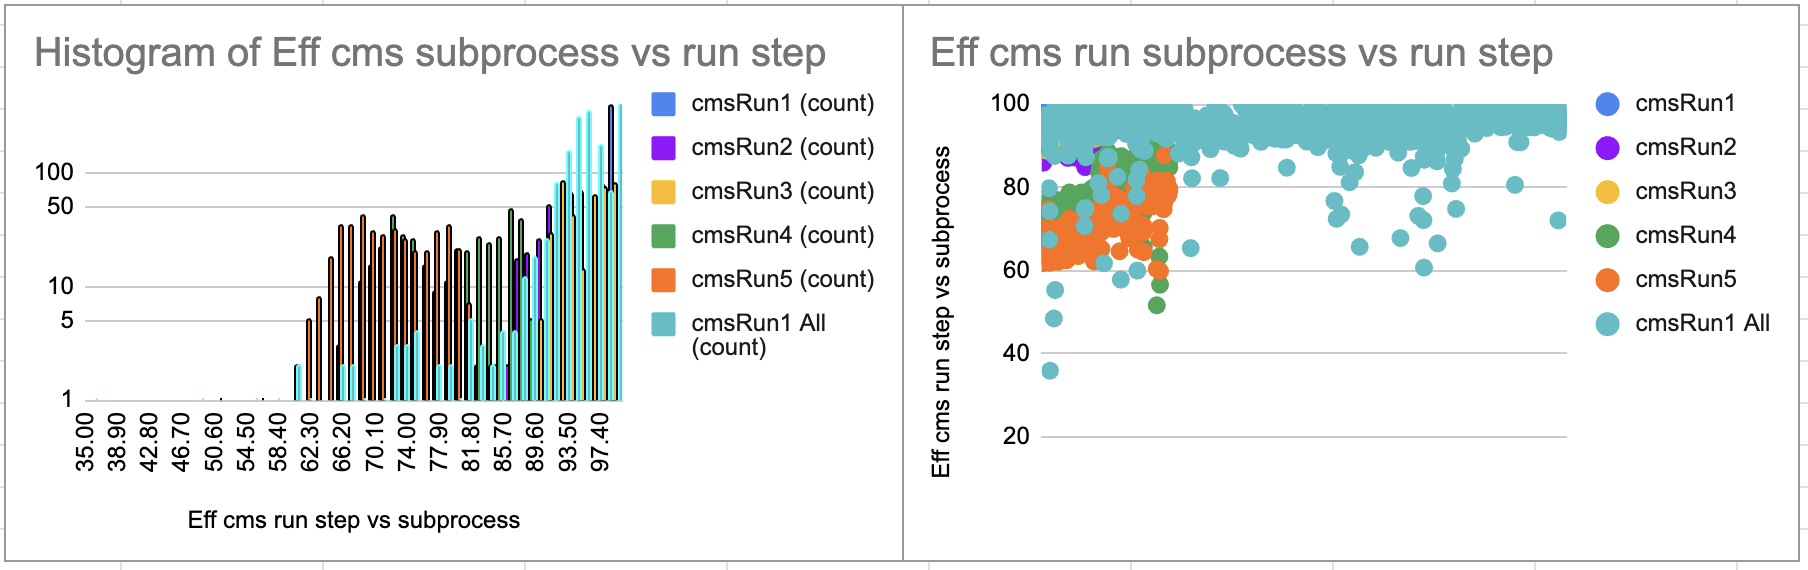
Efficiency of cmsRun step TotalJobTime vs WMCMSSWSubprocess
Here, we can see about 60% of the jobs had an efficiency of 95% or above, whith another 35% of the jobs between the 70-94 % range and the remaining 5% of jobs below that.

These low values come from the same workflow and are RECO jobs. Here is the output of some of these jobs:
Report file: ../pdmvserv_task_TOP-RunIISummer15wmLHEGS-00641__v1_T_231113_190859_2952/JobCluster_4523/Job_4523845.tar.bz2
WMTimes collected: {'WM_wrapper': 1925.0, 'cmsRun1': 1819.545009613037, 'cmsRun1--WMCMSSWSubprocess': 1490.7139554023743, 'cmsRun1--TotalJobTime': 377.886, 'stageOut1': 10.030207395553589, 'logArch1': 0.9243175983428955}
Efficiency of SumOfAllSteps vs Wrapper (WC time) = 95.0908849146459 %
- cmsRun metrics
[cmsRun1] Efficiency of cmsRun step TotalJobTime vs WMCMSSWSubprocess = 25.34933000597025

Report file: ../pdmvserv_task_TOP-RunIISummer15wmLHEGS-00641__v1_T_231113_190859_2952/JobCluster_4119/Job_4119394.tar.bz2
WMTimes collected: {'WM_wrapper': 1017.0, 'cmsRun1': 1012.4885587692261, 'cmsRun1--WMCMSSWSubprocess': 945.8419485092163, 'cmsRun1--TotalJobTime': 495.712, 'stageOut1': 0.9330346584320068, 'logArch1': 1.075000286102295}
Efficiency of SumOfAllSteps vs Wrapper (WC time) = 99.75384402298528 %
- cmsRun metrics
[cmsRun1] Efficiency of cmsRun step TotalJobTime vs WMCMSSWSubprocess = 52.409601919360185
Some ES links are provided here, to facilitate further study on these cases.
Total Efficiency of cmsRuns SubProcess WC Times vs Wrapper WC Time
Here, 80% of the jobs have an efficiency of 86% or above. The remaining 20% have values that go from 1% to ~80%.

While looking into these jobs, you can notice very large values in the stageOut and logArch steps, compared to the cmsRun step itself.
Report file: ../pdmvserv_task_HIG-Run3Summer22EEMiniAODv4-00018__v1_T_231116_235905_8905/JobCluster_5478/Job_5478811.tar.bz2
WMTimes collected: {'WM_wrapper': 6081.0, 'cmsRun1': 119.41565418243408, 'cmsRun1--WMCMSSWSubprocess': 82.74543523788452, 'cmsRun1--TotalJobTime': 79.3743, 'stageOut1': 3676.5141162872314, 'logArch1': 2283.1974952220917}
Efficiency of SumOfAllSteps vs Wrapper (WC time) = 99.96920351408909 %
- cmsRun metrics
[cmsRun1] Efficiency of cmsRun step TotalJobTime vs WMCMSSWSubprocess = 95.9258958174637
Total Efficiency of cmsRuns totalJobTime vs Wrapper WC Time= 1.3052836704489394 %
Total Efficiency of cmsRuns SubProcess WC Times vs Wrapper WC Time = 1.3607208557455108 %
Some others though, were short jobs in nature and there was a difference between the cmsRun step wallclock time vs the subprocess call wallclock time. Eg.:
Report file: ../pdmvserv_task_HIG-Run3Summer22EEMiniAODv4-00018__v1_T_231116_235905_8905/JobCluster_5812/Job_5812749.tar.bz2
WMTimes collected: {'WM_wrapper': 74.0, 'cmsRun1': 71.45959043502808, 'cmsRun1--WMCMSSWSubprocess': 45.46871757507324, 'cmsRun1--TotalJobTime': 42.8639, 'stageOut1': 0.537647008895874, 'logArch1': 0.687631368637085}
Efficiency of SumOfAllSteps vs Wrapper (WC time) = 98.22279569265004 %
- cmsRun metrics
[cmsRun1] Efficiency of cmsRun step TotalJobTime vs WMCMSSWSubprocess = 94.2711875021053
Total Efficiency of cmsRuns totalJobTime vs Wrapper WC Time= 57.92418918918919 %
Total Efficiency of cmsRuns SubProcess WC Times vs Wrapper WC Time = 61.444212939288164 %
WM_subprocess_eff[cmsRun1] = 94.2711875021053 %
This case can be seen better in the section below.
Efficiency of cmsRun subprocess wallclock time vs CmsRun step wallclock time
Here, we can see while most values are above 90% of efficiency, there is a 22% of jobs below that value.

While looking into a difference comparison of the subprocess time vs the cmsRun step time, we can see the main differences come from the shortest jobs. Most of the 22% remaining jobs come from jobs that ran for less than 200 seconds, and the remaining between the 200-500s range.

StepChain
This section will study MC samples, which esentially execute multiple cmsRuns within the same job. Note Merge jobs also depend on cmsRun, so some cmsRun1 executions may be coming from Merge jobs.
Efficiency of SumOfAllSteps vs Wrapper (WC time)
Here, we can see about 64% of the jobs have an efficiency greater or equal to 99%. Another 31% of jobs are above 90% and only 90 out of 2302 jobs are below 90%. These low efficiency jobs are coming from cleanup jobs.

The examples below show 3 different cleanup jobs showing these low efficiencies coming from cleanup jobs and can be as low as e.g.: 20% or as high as 92%, depending on the length of the job. There seems to be a 1-3 seconds extra time from the wrapper, so very short jobs (e.g.: less than 5 seconds) are affected the most in terms of efficiency values.
Report file: workflows/cmsunified_task_GEN-Run3Summer22EEwmLHEGS-00551__v1_T_231220_062740_9436/JobCluster_8874/Job_8874970.tar.bz2
WMTimes collected: {'WM_wrapper': 33.0, 'cleanupUnmergedMINIAODSIMoutput': 30.560307264328003}
Efficiency of SumOfAllSteps vs Wrapper (WC time) = 92.60699171008486 %
- cmsRun metrics
---------------------------------
Report file: workflows/cmsunified_task_GEN-Run3Summer22EEwmLHEGS-00551__v1_T_231220_062740_9436/JobCluster_8874/Job_8874665.tar.bz2
WMTimes collected: {'WM_wrapper': 3.0, 'cleanupUnmergedNANOEDMAODSIMoutput': 0.6350774765014648}
Efficiency of SumOfAllSteps vs Wrapper (WC time) = 21.169249216715492 %
- cmsRun metrics
---------------------------------
Report file: workflows/cmsunified_task_GEN-Run3Summer22EEwmLHEGS-00551__v1_T_231220_062740_9436/JobCluster_8874/Job_8874971.tar.bz2
WMTimes collected: {'WM_wrapper': 2.0, 'cleanupUnmergedMINIAODSIMoutput': 0.8139863014221191}
Efficiency of SumOfAllSteps vs Wrapper (WC time) = 40.69931507110596 %
Efficiency of cmsRun step TotalJobTime vs WMCMSSWSubprocess
The plot below shows that cmsRun step TotalJobTime compared to its WMCMSSWSubprocess counter part. Here, merge jobs that run cmsRun executables are also included. From there, you can see the number of merge jobs is greater than the number of MC processing related cmsRuns and their efficiencies vary way more than the rest.
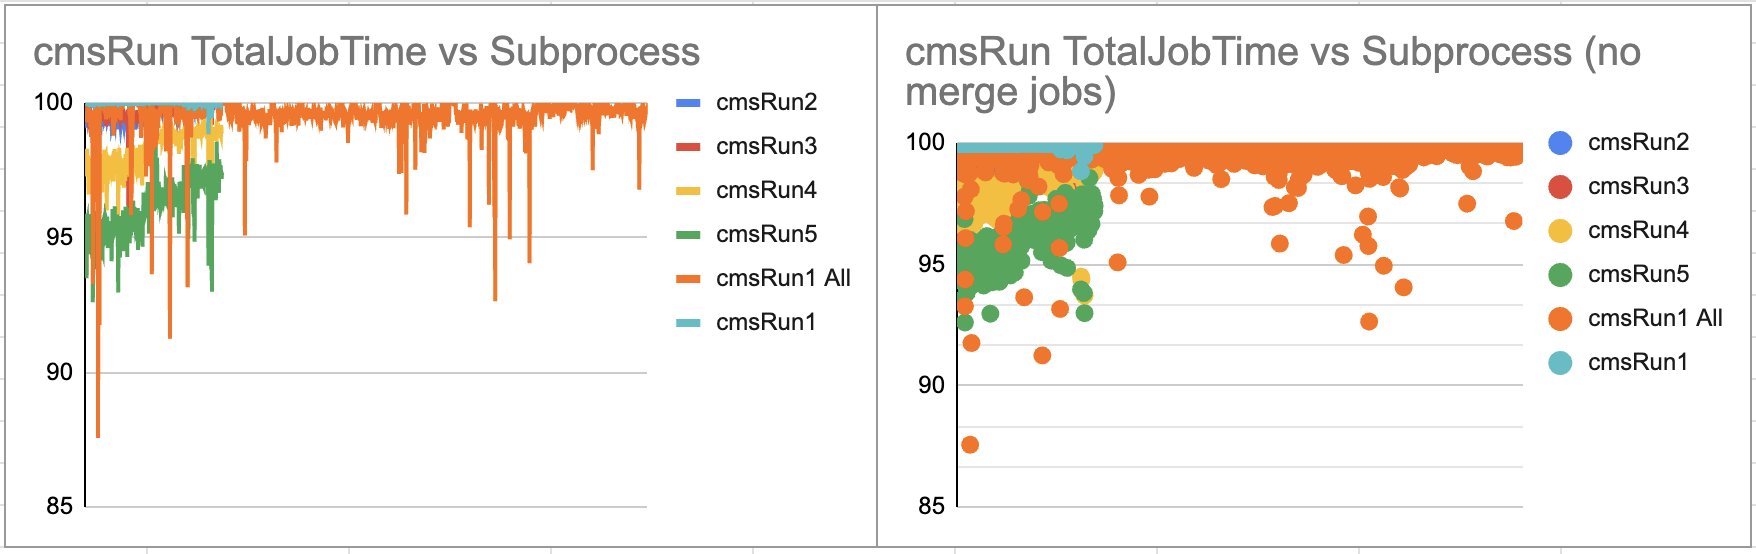
The plot below excludes these merge jobs. From here, you can see efficiencies are between 95-100%. It is interesting to note though, how cmsRun1-3 tend to have higher efficiencies (+99%) whole cmsRun4 jobs are around 97-98% and cmsRun5 jobs around 95-96%. cmsRun4 jobs represent miniAOD processing jobs while cmsRun5 represent NanoAOD processing jobs.
Total Efficiency of cmsRuns SubProcess WC Times vs Wrapper WC Time
Here, we see about 4% of jobs have efficiencies below 75% (73 out of 1621 jobs) and another 27% of jobs from 75-90% range. These are all Merge jobs and cleanup jobs. All of the cmsRun processing related jobs were in the 90-100% range.
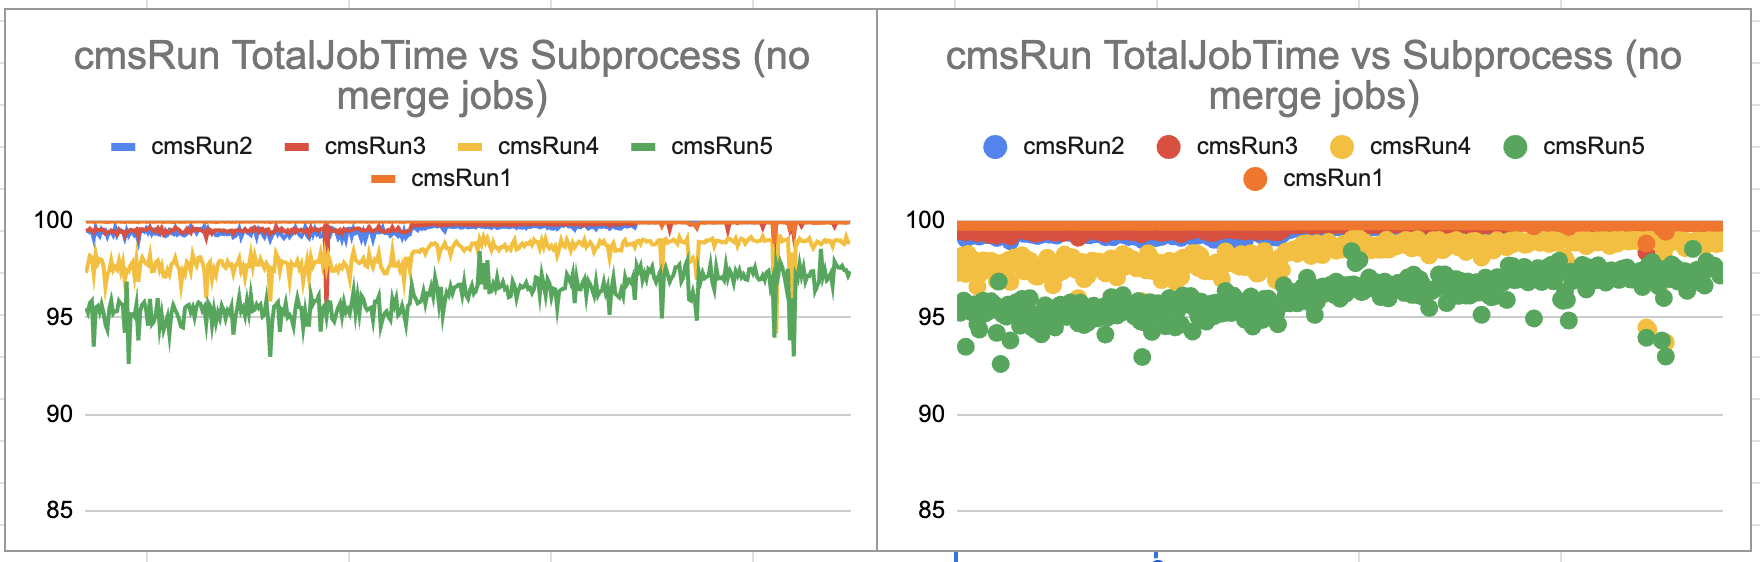
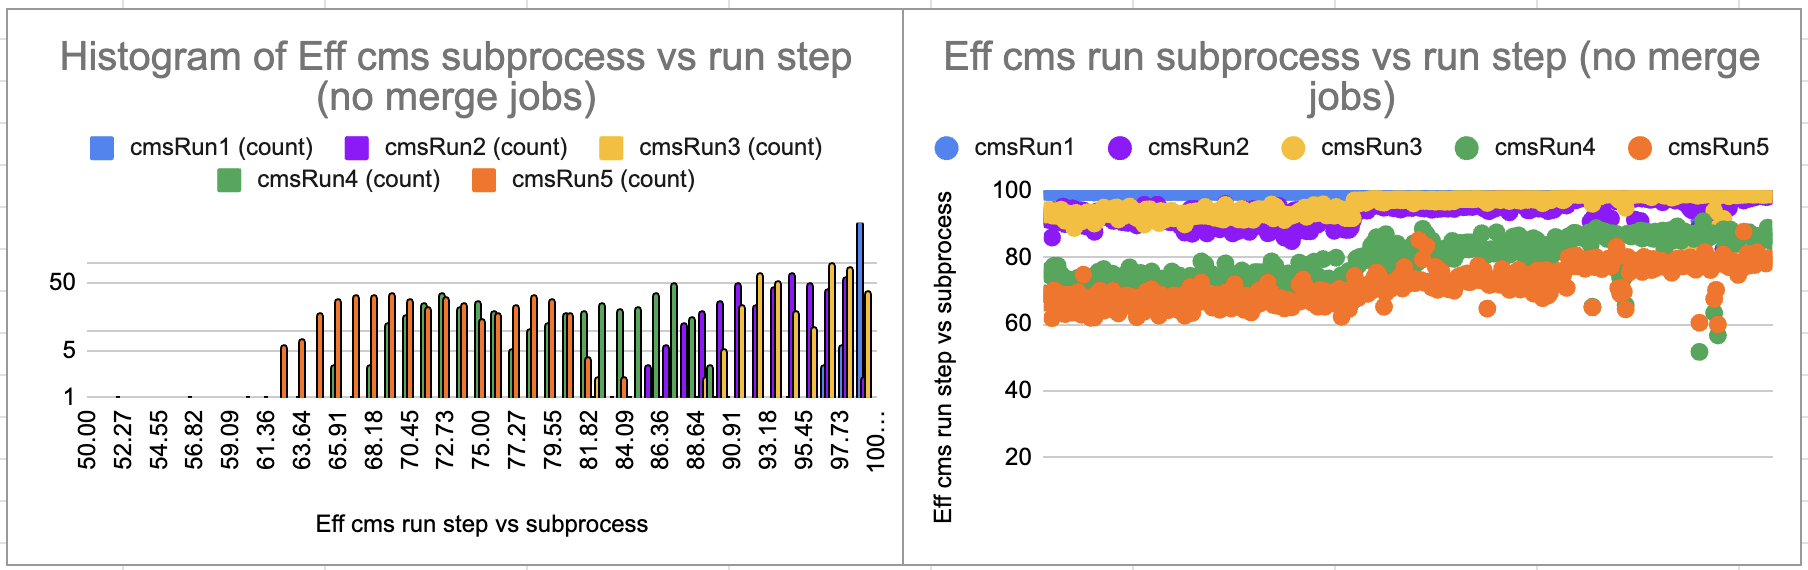
Efficiency of cmsRun subprocess wallclock time vs CmsRun step wallclock time
The first plot shows all of the cmsRun related jobs, including merge jobs, which are the majority in terms of numbers. Merge jobs are also the ones where efficiency varies the most.
The second plot excludes such merge jobs. Here, we see cmsRun1 is the best efficiency values, above 95%. cmsRun2 and cmsRun3 jobs are above 85%, while cmsRun4 and cmsRun5 are between 60 to 90% in terms of efficiency. Again, here: cmsRun4 and cmsRun5 are miniAOD and NanoAOD jobs.
Conclusions
- cleanup and logCollect jobs, when short in nature, were shown to have low efficiencies. This was noticed when comparing the sum of the wallclock time of all steps vs Wrapper wallclock time.
- Some RECO jobs were noted to also have lower efficiencies in TaskChain MC jobs. This was noticed when comparing the cmsRun step TotalJobTime vs the WMCMSSWSubprocess.
- Some Merge jobs had also lower efficiencies in ReReco and TaskChain DATA processing jobs. This was noticed when comparing the CMSSW subprocess vs the CMSRun step wallclock time.
ReReco
Overall, the efficiency for these kind of workflows is high. The jobs that tend to have lower efficiency are short in nature. E.g.: cleanup or logCollect jobs. Some Merge jobs were also noticed to have a relatively low efficiency.
For cmsRun jobs, there are some cases where the TotalJobTime value coming from CMSSW is significantly different to the subprocess call wallclock time. The analysis section provides links to some of these cases. Besides the Elastic Search links, please note the tarballs for all the jobs are also provided in a gitlab repository. It is important to note, however, that these were only 3 jobs out of 112 in the sample, representing less than 3% of the sample.
Cases when the time difference between the subprocess call wallclock time and the cmsRun step wallclock time were not trivial were usually related to stageOut was high, or because the jobs were short overall, compared to other cmsRun jobs in the same workflow. It would be good to check whether we do a better job avoid these kind of short cmsRun jobs.
TaskChain
The conclusions for this sample are similar to the ReReco sample. Example jobs for the TotalJobTime vs Subprocess differences have also been given in the analysis section. Note some RECO jobs were also noted to have low efficiency in this case.
StepChain
Similarly to the other types (ReReco/TaskChain), cleanup and merge jobs tend to be the jobs with wider range of efficiencies and the ones that have the lowest efficiencies. This is in part due to many of them being short in nature.
When comparing TotalJobTime vs Subprocess times, it is interesting to see MiniAOD and NanoAOD jobs have lower efficiencies than the previous steps (GEN/SIM, DIGI, RECO) and this is also true when comparing the subprocess wallclock times vs the cmsRun step wallclock times. Further study on these two steps in order to understand the reason would be beneficial.