MEGA2560 EthernetW5500 Online Graph for Sensor - dimaatmelodromru/techdoc GitHub Wiki
In the following example, we will create a sketch that turns your Mega ETH board to a Web Server that serves a graphical representation of a valure provided by a connected sensor (light sensor for this example). Since microcontroller resources are very limited, it is a common practice to use additional web services for more complex tasks like graphical representation of information. But if we don't want to depend on an external service, free or commercial, we might want to try to implement everything using nothing but the board, which is actually possible.
We connect a photoresistor to 5V, GND and A0 pins of Mega 2560 ETH in such a way that the minimum light intensity is zero, while the maximum is 1024.

Let's create a simple HTML page and store it on an SD card using your computer and a card reader. While you can use almost any text editor to write HTML code, it will be much easier if it can highlight the HTML syntaxis and automatically close HTML tags. Geany (geany.org) is an example of such an editor available on almost all operating systems. Create the following web page in the editor:
<!DOCTYPE HTML>
<html>
<head>
<meta http-equiv="Content-Type" content="text/html; charset=utf-8">
<title>Super Graphing Data Logger!</title>
<script type="text/javascript" src="http://ajax.googleapis.com/ajax/libs/jquery/1.8.2/jquery.min.js"></script>
<script type="text/javascript">
function getDataFilename(str){
point = str.lastIndexOf("file=")+4;
tempString = str.substring(point+1,str.length)
if (tempString.indexOf("&") == -1){
return(tempString);
}
else{
return tempString.substring(0,tempString.indexOf("&"));
}
}
query = window.location.search;
var dataFilePath = "/data/"+getDataFilename(query);
$(function () {
var chart;
$(document).ready(function() {
// define the options
var options = {
chart: {
renderTo: 'container',
zoomType: 'x',
spacingRight: 20
},
title: {
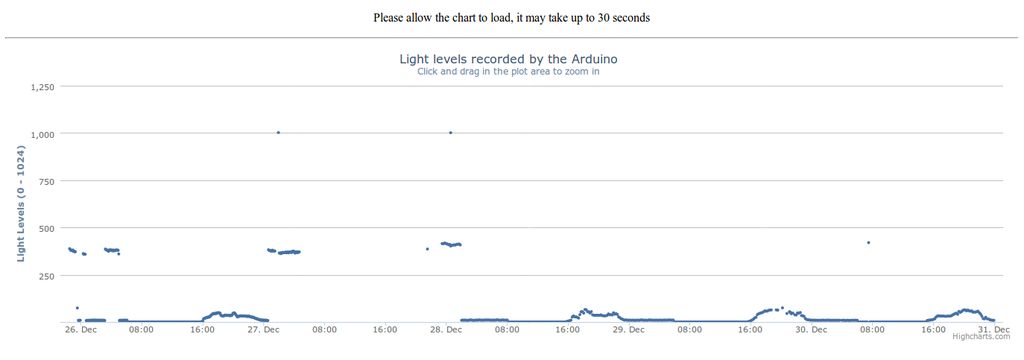
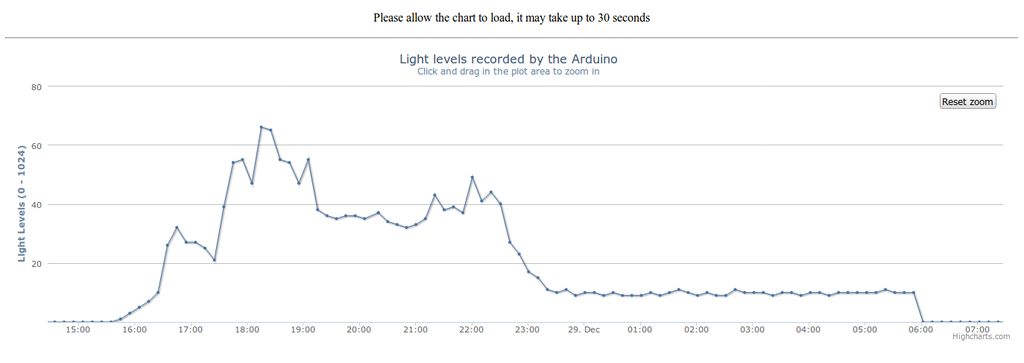
text: 'Light levels recorded by the Arduino'
},
subtitle: {
text: 'Click and drag in the plot area to zoom in'
},
xAxis: {
type: 'datetime',
maxZoom: 2 * 3600000
},
yAxis: {
title: {
text: 'Light Levels (0 - 1024)'
},
min: 0,
startOnTick: false,
showFirstLabel: false
},
legend: {
enabled: false
},
tooltip: {
formatter: function() {
return '<b>'+ this.series.name +'</b><br/>'+
Highcharts.dateFormat('%H:%M - %b %e, %Y', this.x) +': '+ this.y;
}
},
plotOptions: {
series: {
cursor: 'pointer',
lineWidth: 1.0,
point: {
events: {
click: function() {
hs.htmlExpand(null, {
pageOrigin: {
x: this.pageX,
y: this.pageY
},
headingText: this.series.name,
maincontentText: Highcharts.dateFormat('%H:%M - %b %e, %Y', this.x) +':<br/> '+
this.y,
width: 200
});
}
}
},
}
},
series: [{
name: 'Light Levels',
marker: {
radius: 2
}
}]
};
// Load data asynchronously using jQuery. On success, add the data
// to the options and initiate the chart.
// http://api.jquery.com/jQuery.get/
jQuery.get(dataFilePath, null, function(csv, state, xhr) {
var lines = [],
date,
// set up the two data series
lightLevels = [];
// inconsistency
if (typeof csv !== 'string') {
csv = xhr.responseText;
}
// split the data return into lines and parse them
csv = csv.split(/\n/g);
jQuery.each(csv, function(i, line) {
// all data lines start with a double quote
line = line.split(',');
date = parseInt(line[0], 10)*1000;
lightLevels.push([
date,
parseInt(line[1], 10)
]);
});
options.series[0].data = lightLevels;
chart = new Highcharts.Chart(options);
});
});
});
</script>
</head>
<body>
<p style="text-align:center;">Please allow the chart to load, it may take up to 30 seconds </p>
<hr/>
<script src="http://cdnjs.cloudflare.com/ajax/libs/highcharts/2.3.5/highcharts.js"></script>
<!-- Additional files for the Highslide popup effect -->
<script type="text/javascript" src="http://www.highcharts.com/highslide/highslide-full.min.js"></script>
<script type="text/javascript" src="http://www.highcharts.com/highslide/highslide.config.js" charset="utf-8"></script>
<link rel="stylesheet" type="text/css" href="http://www.highcharts.com/highslide/highslide.css" />
<div id="container" style="min-width: 400px; height: 400px; margin: 0 auto"></div>
</body>
</html>Store it on the SD card in the root directory as index.html.
Our sketch will be placed in EEPROM and will make use of 2 extra libraries: EEPROMAnything and Time library.
/* ************************************************************************
 * ***            Super Graphing Data Logger - EEPROM config            ***
 * ************************************************************************
 * Everett Robinson, December 2012.
 *
 * The following extra non standard libraries were used, and will need to be
 * added to the libraries folder:
 * - EEPROMAnything:  http://playground.arduino.cc/Code/EEPROMWriteAnyt...
 *
 * This sketch helps you set the values in EEPROM which are necessary for
 * Super Graphing Data Logger. It should only need the be run once before
 * the first time you set up SGDL, or in the unlikely event that the EEPROM
 * becomes corrupted.
 *
 * Please ensure that the values in configuration config are appropriate for
 * your project before uncommenting the EEPROM_writeAnything(0, config); line.
 *
 */

#include <EEPROM.h>
#include <EEPROMAnything.h>

typedef struct{
    unsigned long newFileTime;
    char workingFilename[19];
  } configuration;

//This is a one off thing, so everything is in setup
void setup(){
  Serial.begin(9600);

  //Create the config struct to write to EEPROM, change values as appropriate
  //Make sure your filename is not too long for the workingFilename char array
  configuration config = {1356912000L,"/data/25-12-12.csv"};
  //Write the values to the EEPROM
  //EEPROM_writeAnything(0, config);       //Uncomment when you're sure everything is correct
  configuration config2;                   //Create a second config struct for verification
  EEPROM_readAnything(0,config2);
  Serial.print("The value read from EEPROM for newFileTime is: ");
  Serial.println(config2.newFileTime);
  Serial.print("The value read from EEPROM for workingFilename is: ");
  Serial.println(config2.workingFilename);
  Serial.println("If those values are correct then everything went as planned. Otherwise,");
  Serial.println("please double check that the values declared for the struct config are");
  Serial.println("correct and that that EEPROM_writeAnything line is uncommented.");
}


void loop(){
}
Please mind the commented line //EEPROM_writeAnything(0, config); - uncomment itwhen you are sure that everything is correct.
You will need to do a few adjustments to the code, like MAC and IP addresses. You can also adjust the timeserver address to your liking.
The code is set up to make measurements every 10 minutes, and to create a new datafile every week. Data files use a dd-mm-yy.csv format.
/* ************************************************************************
* *** Super Graphing Data Logger ***
* ************************************************************************
* Everett Robinson, December 2012. More at: http://everettsprojects.com
*
* This sketch relies on the SD and ethernet libraries in arduino 1.0 or newer.
* The following extra non standard libraries were also used, and will need to
* be added to the libraries folder:
* - Time: http://everettsprojects.com
* - EEPROMAnything: http://everettsprojects.com
*
* If this is your first time setting up this project, please go get the
* EEPROM_config sketch from http://everettsprojects.com so that you can
* configure the config struct in the EEPROM memory. Usage of the EEPROM
* is needed to make the project resiliant against a temporary loss of power.
*
* You must also ensure that you have the HC.htm file in the root directory
* of your SD card, as well as a data directory where the datafiles will be
* stored.
*
* This sketch combines the functionality of an existing fileserver example
* which can be found at http://everettsprojects.com
* with the Datalogger example that comes with the new SD library from 1.0,
* as well as some code from the UdpNtpClient example that cones with the
* ethernet library.
*
* Added to all of these are some tricks to make it manage and serve up the
* datafiles in conjunction with a page which uses highcharts JS to graph it.
* This is basically accomplished using the arduino by itself. Because I
* actually host the highcharts.js files externally, this is true more in
* theory than in actual practice, but oh well. It should work just fine to
* have the highcharts.js file on the arduino's SD card, though loading the
* page will be painfully slow.
*
* Some of the code this was derived from may or may not be under a GPL
* licence; I'm not entirely sure. I suppose anyone using this should treat
* it like it is too, but I don't really care too much.
* Also if one intends to use this for commercial applications, it may be
* necessary to purchase a license for Highcharts.
*
* Changes: -------------------------------------------------------------
* January 2013: Updated so that the dd-mm-yy.csv file format is properly
* followed, all single digit days, months, and years will have a leading
* zero now.
*
*/
#include <sd.h>
#include <ethernet.h>
#include <ethernetudp.h>
#include <spi.h>
#include <string.h>
#include <time.h>
#include <eeprom.h>
#include <eepromanything.h>
#include <avr/pgmspace.h>
/************ ETHERNET STUFF ************/
byte mac[] = { 0x90, 0xA2, 0xDA, 0x00, 0x4C, 0x64 };
byte ip[] = { 192,168,1, 100 };
EthernetServer server(80);
/************** NTP STUFF ***************/
unsigned int localPort = 8888; // local port to listen for UDP packets
IPAddress timeServer(132, 163, 4, 101); //NIST time server IP address: for more info
//see http://everettsprojects.com
const int NTP_PACKET_SIZE= 48; //NTP time stamp is in the first 48 bytes of the message
byte packetBuffer[ NTP_PACKET_SIZE]; //buffer to hold incoming and outgoing packets
EthernetUDP Udp;
/*** DATA LOGGER AND TIMER CONTROLS ****/
const int analogPin = 0;
unsigned long lastIntervalTime = 0; //The time the last measurement occured.
#define MEASURE_INTERVAL 600000 //10 minute intervals between measurements (in ms)
unsigned long newFileTime; //The time at which we should create a new week's file
#define FILE_INTERVAL 604800 //One week worth of seconds
//A structure that stores file config variables from EEPROM
typedef struct{
unsigned long newFileTime; //Keeps track of when a newfile should be made.
char workingFilename[19]; //The path and filename of the current week's file
} configuration;
configuration config; //Actually make our config struct
// Strings stored in flash mem for the Html Header (saves ram)
prog_char HeaderOK_0[] PROGMEM = "HTTP/1.1 200 OK"; //
prog_char HeaderOK_1[] PROGMEM = "Content-Type: text/html"; //
prog_char HeaderOK_2[] PROGMEM = ""; //
// A table of pointers to the flash memory strings for the header
PROGMEM const char *HeaderOK_table[] = {
HeaderOK_0,
HeaderOK_1,
HeaderOK_2
};
// A function for easy printing of the headers
void HtmlHeaderOK(EthernetClient client) {
char buffer[30]; //A character array to hold the strings from the flash mem
for (int i = 0; i < 3; i++) {
strcpy_P(buffer, (char*)pgm_read_word(&(HeaderOK_table[i])));
client.println( buffer );
}
}
// Strings stored in flash mem for the Html 404 Header
prog_char Header404_0[] PROGMEM = "HTTP/1.1 404 Not Found"; //
prog_char Header404_1[] PROGMEM = "Content-Type: text/html"; //
prog_char Header404_2[] PROGMEM = ""; //
prog_char Header404_3[] PROGMEM = "<h2>File Not Found!</h2>";
// A table of pointers to the flash memory strings for the header
PROGMEM const char *Header404_table[] = {
Header404_0,
Header404_1,
Header404_2,
Header404_3
};
// Easy peasy 404 header function
void HtmlHeader404(EthernetClient client) {
char buffer[30]; //A character array to hold the strings from the flash mem
for (int i = 0; i < 4; i++) {
strcpy_P(buffer, (char*)pgm_read_word(&(Header404_table[i])));
client.println( buffer );
}
}
void setup() {
Serial.begin(9600);
pinMode(10, OUTPUT); // set the SS pin as an output (necessary!)
digitalWrite(10, HIGH); // but turn off the W5100 chip!
// see if the card is present and can be initialized:
if (!SD.begin(4)) {
Serial.println("Card failed, or not present");
// don't do anything more:
return;
}
Serial.println("card initialized.");
// The SD card is working, start the server and ethernet related stuff!
Ethernet.begin(mac, ip);
server.begin();
Udp.begin(localPort);
EEPROM_readAnything(0,config); // make sure our config struct is syncd with EEPROM
}
// A function that takes care of the listing of files for the
// main page one sees when they first connect to the arduino.
// it only lists the files in the /data/ folder. Make sure this
// exists on your SD card.
void ListFiles(EthernetClient client) {
File workingDir = SD.open("/data");
client.println("<ul>");
while(true) {
File entry = workingDir.openNextFile();
if (! entry) {
break;
}
client.print("<li><a href=\"/HC.htm?file=");
client.print(entry.name());
client.print("\">");
client.print(entry.name());
client.println("</a></li>");
entry.close();
}
client.println("</ul>");
workingDir.close();
}
// A function to get the Ntp Time. This is used to make sure that the data
// points recorded by the arduino are referenced to some meaningful time
// which in our case is UTC represented as unix time (choosen because it
// works simply with highcharts without too much unecessary computation).
unsigned long getTime(){
sendNTPpacket(timeServer); // send an NTP packet to a time server
// wait to see if a reply is available
delay(1000);
if ( Udp.parsePacket() ) {
// We've received a packet, read the data from it
Udp.read(packetBuffer,NTP_PACKET_SIZE); // read the packet into the buffer
//the timestamp starts at byte 40 of the received packet and is four bytes,
// or two words, long. First, esxtract the two words:
unsigned long highWord = word(packetBuffer[40], packetBuffer[41]);
unsigned long lowWord = word(packetBuffer[42], packetBuffer[43]);
// combine the four bytes (two words) into a long integer
// this is NTP time (seconds since Jan 1 1900):
unsigned long secsSince1900 = highWord << 16 | lowWord;
// Unix time starts on Jan 1 1970. In seconds, that's 2208988800:
const unsigned long seventyYears = 2208988800UL;
// subtract seventy years:
unsigned long epoch = secsSince1900 - seventyYears;
// return Unix time:
return epoch;
}
}
// send an NTP request to the time server at the given address,
// necessary for getTime().
unsigned long sendNTPpacket(IPAddress& address){
// set all bytes in the buffer to 0
memset(packetBuffer, 0, NTP_PACKET_SIZE);
// Initialize values needed to form NTP request
// (see URL above for details on the packets)
packetBuffer[0] = 0b11100011; // LI, Version, Mode
packetBuffer[1] = 0; // Stratum, or type of clock
packetBuffer[2] = 6; // Polling Interval
packetBuffer[3] = 0xEC; // Peer Clock Precision
// 8 bytes of zero for Root Delay & Root Dispersion
packetBuffer[12] = 49;
packetBuffer[13] = 0x4E;
packetBuffer[14] = 49;
packetBuffer[15] = 52;
// all NTP fields have been given values, now
// you can send a packet requesting a timestamp:
Udp.beginPacket(address, 123); //NTP requests are to port 123
Udp.write(packetBuffer,NTP_PACKET_SIZE);
Udp.endPacket();
}
// How big our line buffer should be for sending the files over the ethernet.
// 75 has worked fine for me so far.
#define BUFSIZ 75
void loop(){
if ((millis() % lastIntervalTime) >= MEASURE_INTERVAL){ //Is it time for a new measurement?
char dataString[20] = "";
int count = 0;
unsigned long rawTime;
rawTime = getTime();
while((rawTime == 39) && (count < 12)){ //server seems to send 39 as an error code
delay(5000); //we want to retry if this happens. I chose
rawTime = getTime(); //12 retries because I'm stubborn/persistent.
count += 1; //NIST considers retry interval of <4s as DoS
} //attack, so fair warning.
if (rawTime != 39){ //If that worked, and we have a real time
//Decide if it's time to make a new file or not. Files are broken
//up like this to keep loading times for each chart bearable.
//Lots of string stuff happens to make a new filename if necessary.
if (rawTime >= config.newFileTime){
int dayInt = day(rawTime);
int monthInt = month(rawTime);
int yearInt = year(rawTime);
char newFilename[18] = "";
char dayStr[3];
char monthStr[3];
char yearStr[5];
char subYear[3];
strcat(newFilename,"data/");
itoa(dayInt,dayStr,10);
if (dayInt < 10){
strcat(newFilename,"0");
}
strcat(newFilename,dayStr);
strcat(newFilename,"-");
itoa(monthInt,monthStr,10);
if (monthInt < 10){
strcat(newFilename,"0");
}
strcat(newFilename,monthStr);
strcat(newFilename,"-");
itoa(yearInt,yearStr,10);
//we only want the last two digits of the year
memcpy( subYear, &yearStr[2], 3 );
strcat(newFilename,subYear);
strcat(newFilename,".csv");
//make sure we update our config variables:
config.newFileTime += FILE_INTERVAL;
strcpy(config.workingFilename,newFilename);
//Write the changes to EEPROM. Bad things may happen if power is lost midway through,
//but it's a small risk we take. Manual fix with EEPROM_config sketch can correct it.
EEPROM_writeAnything(0, config);
}
//get the values and setup the string we want to write to the file
int sensor = analogRead(analogPin);
char timeStr[12];
char sensorStr[6];
ultoa(rawTime,timeStr,10);
itoa(sensor,sensorStr,10);
strcat(dataString,timeStr);
strcat(dataString,",");
strcat(dataString,sensorStr);
//open the file we'll be writing to.
File dataFile = SD.open(config.workingFilename, FILE_WRITE);
// if the file is available, write to it:
if (dataFile) {
dataFile.println(dataString);
dataFile.close();
// print to the serial port too:
Serial.println(dataString);
}
// if the file isn't open, pop up an error:
else {
Serial.println("Error opening datafile for writing");
}
}
else{
Serial.println("Couldn't resolve a time from the Ntp Server.");
}
//Update the time of the last measurment to the current timer value
lastIntervalTime = millis();
}
//No measurements to be made, make sure the webserver is available for connections.
else{
char clientline[BUFSIZ];
int index = 0;
EthernetClient client = server.available();
if (client) {
// an http request ends with a blank line
boolean current_line_is_blank = true;
// reset the input buffer
index = 0;
while (client.connected()) {
if (client.available()) {
char c = client.read();
// If it isn't a new line, add the character to the buffer
if (c != '\n' && c != '\r') {
clientline[index] = c;
index++;
// are we too big for the buffer? start tossing out data
if (index >= BUFSIZ)
index = BUFSIZ -1;
// continue to read more data!
continue;
}
// got a \n or \r new line, which means the string is done
clientline[index] = 0;
// Print it out for debugging
Serial.println(clientline);
// Look for substring such as a request to get the root file
if (strstr(clientline, "GET / ") != 0) {
// send a standard http response header
HtmlHeaderOK(client);
// print all the data files, use a helper to keep it clean
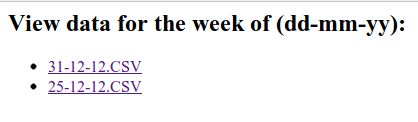
client.println("<h2>View data for the week of (dd-mm-yy):</h2>");
ListFiles(client);
}
else if (strstr(clientline, "GET /") != 0) {
// this time no space after the /, so a sub-file!
char *filename;
filename = strtok(clientline + 5, "?"); // look after the "GET /" (5 chars) but before
// the "?" if a data file has been specified. A little trick, look for the " HTTP/1.1"
// string and turn the first character of the substring into a 0 to clear it out.
(strstr(clientline, " HTTP"))[0] = 0;
// print the file we want
Serial.println(filename);
File file = SD.open(filename,FILE_READ);
if (!file) {
HtmlHeader404(client);
break;
}
Serial.println("Opened!");
HtmlHeaderOK(client);
int16_t c;
while ((c = file.read()) > 0) {
// uncomment the serial to debug (slow!)
//Serial.print((char)c);
client.print((char)c);
}
file.close();
}
else {
// everything else is a 404
HtmlHeader404(client);
}
break;
}
}
// give the web browser time to receive the data
delay(1);
client.stop();
}
}
}