phase diagram - diglet48/restim GitHub Wiki
Phase diagram
The phase diagram is used as a 2D representation of the generated signal:
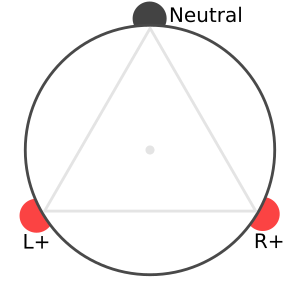
A position in the phase diagram represents one particular sensation:
| position | effect |
|---|---|
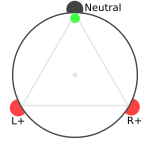 |
Strong sensation in neutral electrode, weak sensation other electrodes |
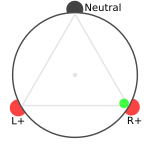 |
Strong sensation in right electrode |
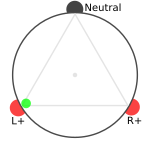 |
Strong sensation in left electrode |
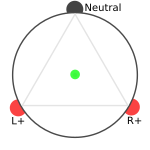 |
Strong sensation in all electrodes |
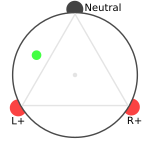 |
Strong sensation in neutral and left electrodes, weak right |
The main idea is that changing the position changes the location of the sensation, but the intensity stays constant. This greatly simplifies the creation of funscripts. To achieve this, the user has to calibrate his individual setup once.
Technical details
The position is expressed in the coordinates alpha and beta. The center is (0, 0). Alpha is towards the neutral electrode, beta is perpendicular, with the positive to the left. Only values inside the circle are valid. See the details tab in the software for the precise translation of position to audio.