Backend Performance Profiling - department-of-veterans-affairs/caseflow GitHub Wiki
| Owner | Date |
|---|---|
| Ferris | 6/25/2020 |
This page describes how to use KCachegrind/QCachegrind (macOS) to profile Caseflow in your developer environment.
The easiest way to setup QCachegrind on macOS is using the Homebrew package:
$ brew install qcachegrindYou can install KCachegrind on Fedora with dnf:
$ dnf install kcachegrind(Untested)
You can install KCachegrind on Ubuntu with apt:
$ apt-get install kcachegrindCaseflow leverages the ruby-prof gem to capture performance on a per-route basis.
Performance profiling can only be enabled in the dev environment. Caseflow will only capture performance metrics if you start the server with PERFORMANCE_PROFILE=1. Note: the environment variable can be set to anything, since the server is just checking if it is set at all.
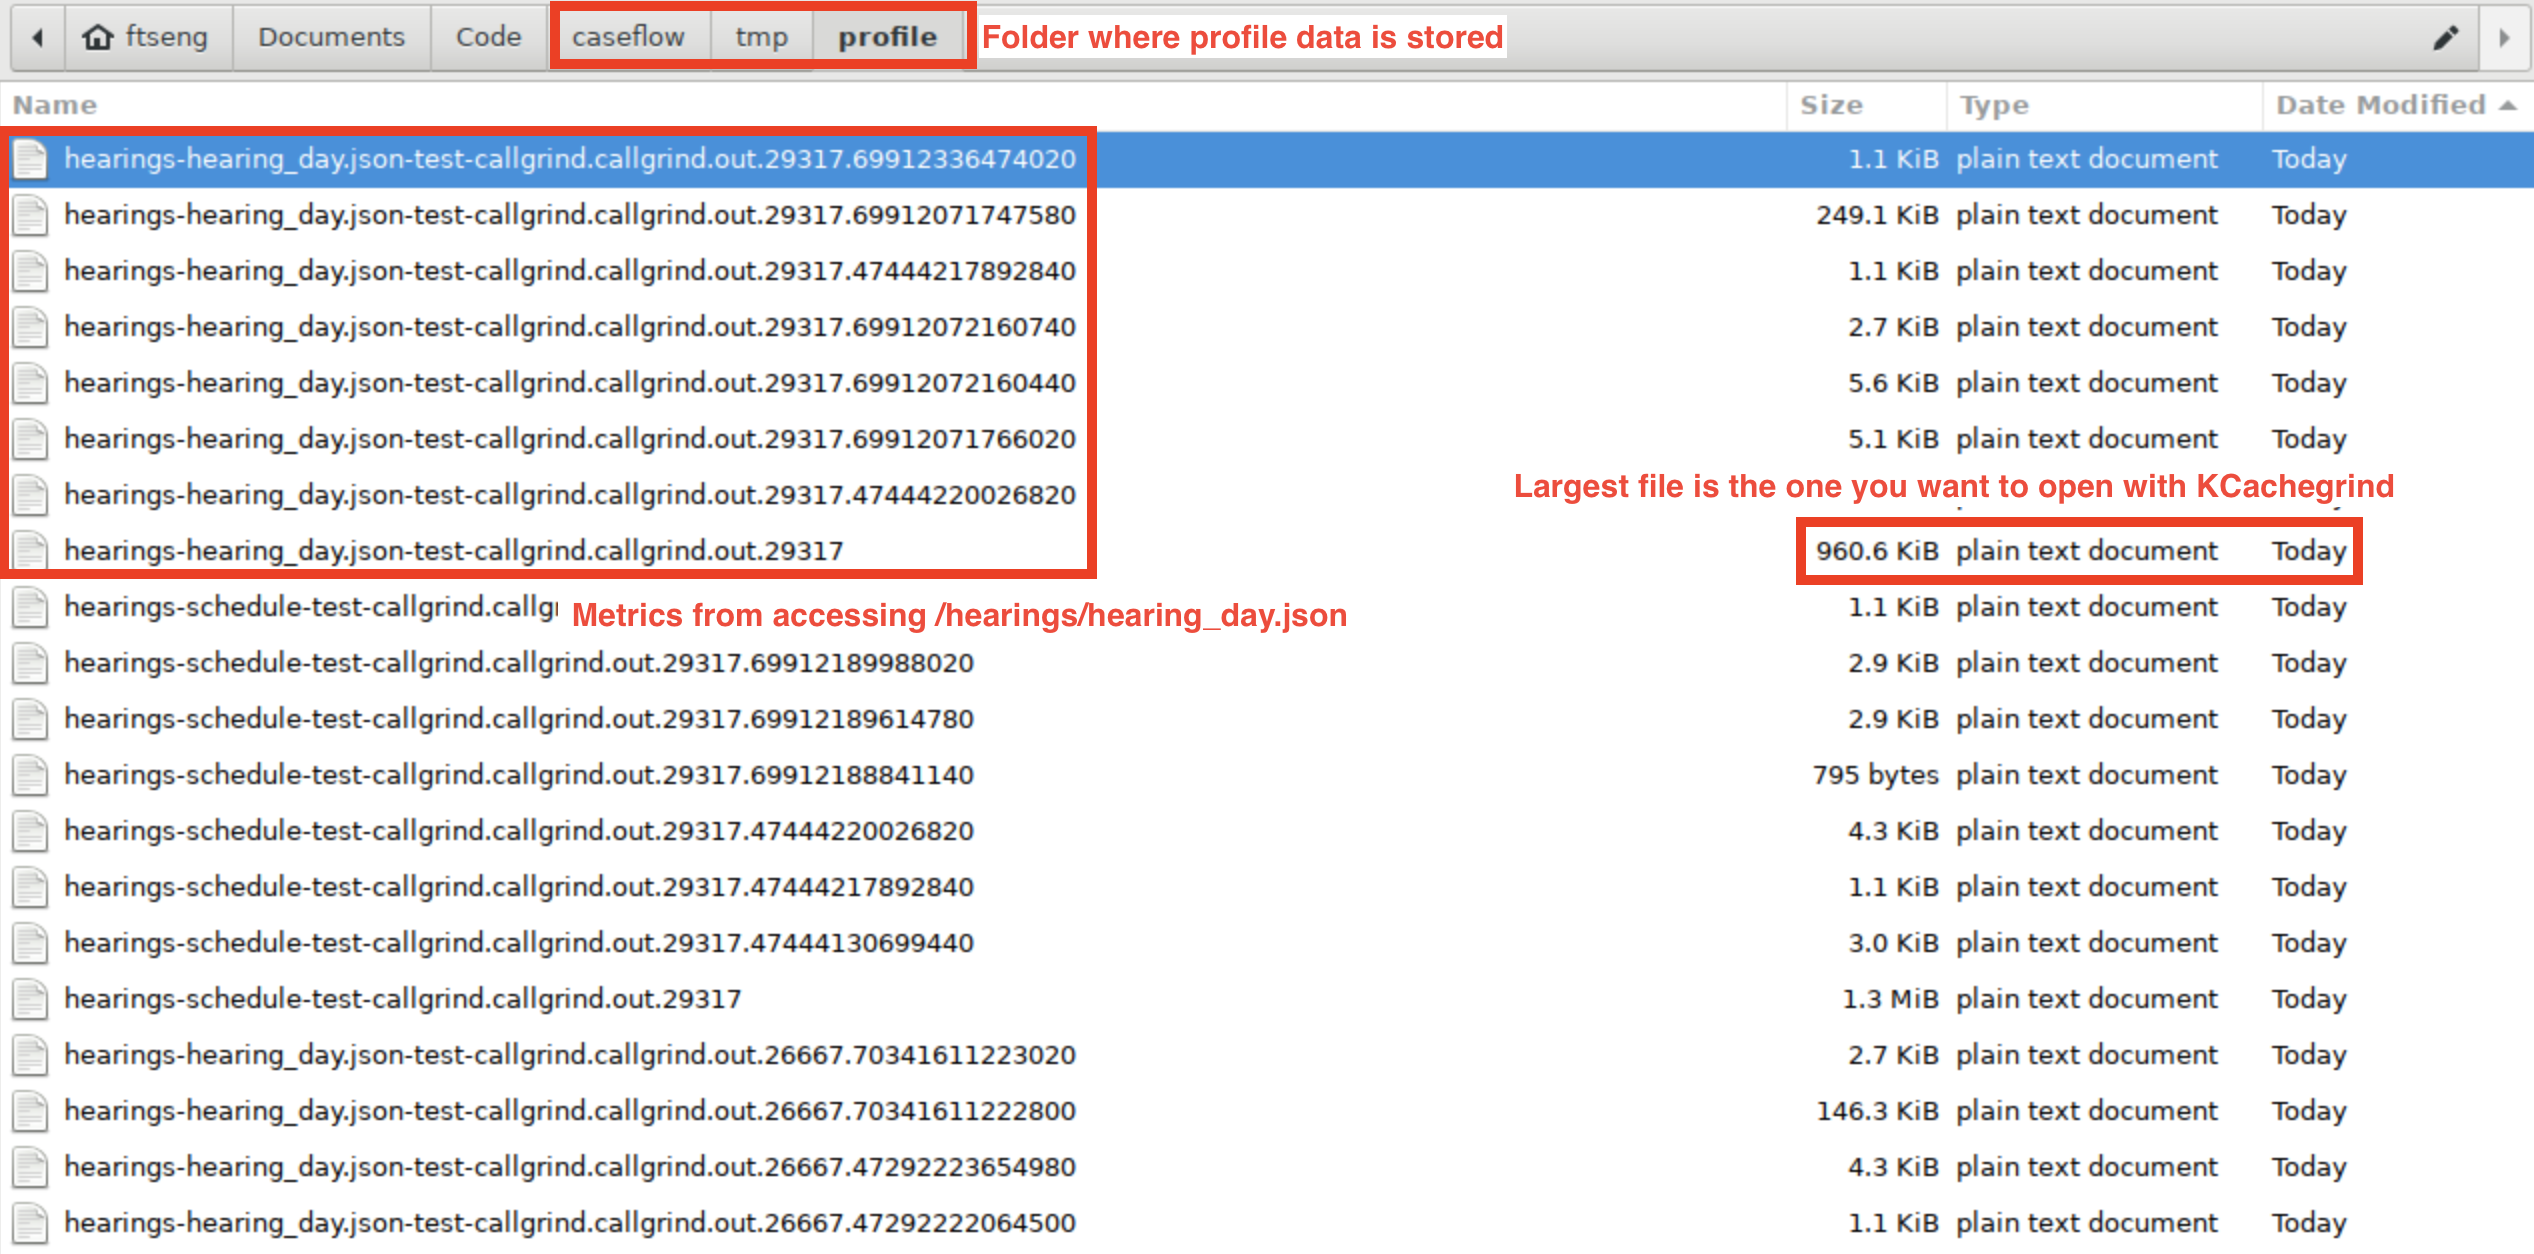
$ PERFORMANCE_PROFILE=1 make -f Makefile.example run-backendProfiling data gets dumped into ./tmp/profile. You'll see a bunch of files get created each time the application calls a backend route. The names of each file should reflect the route that was called and the time it was accessed:
When you open a data profile in KCachegrind, you should see something like this:
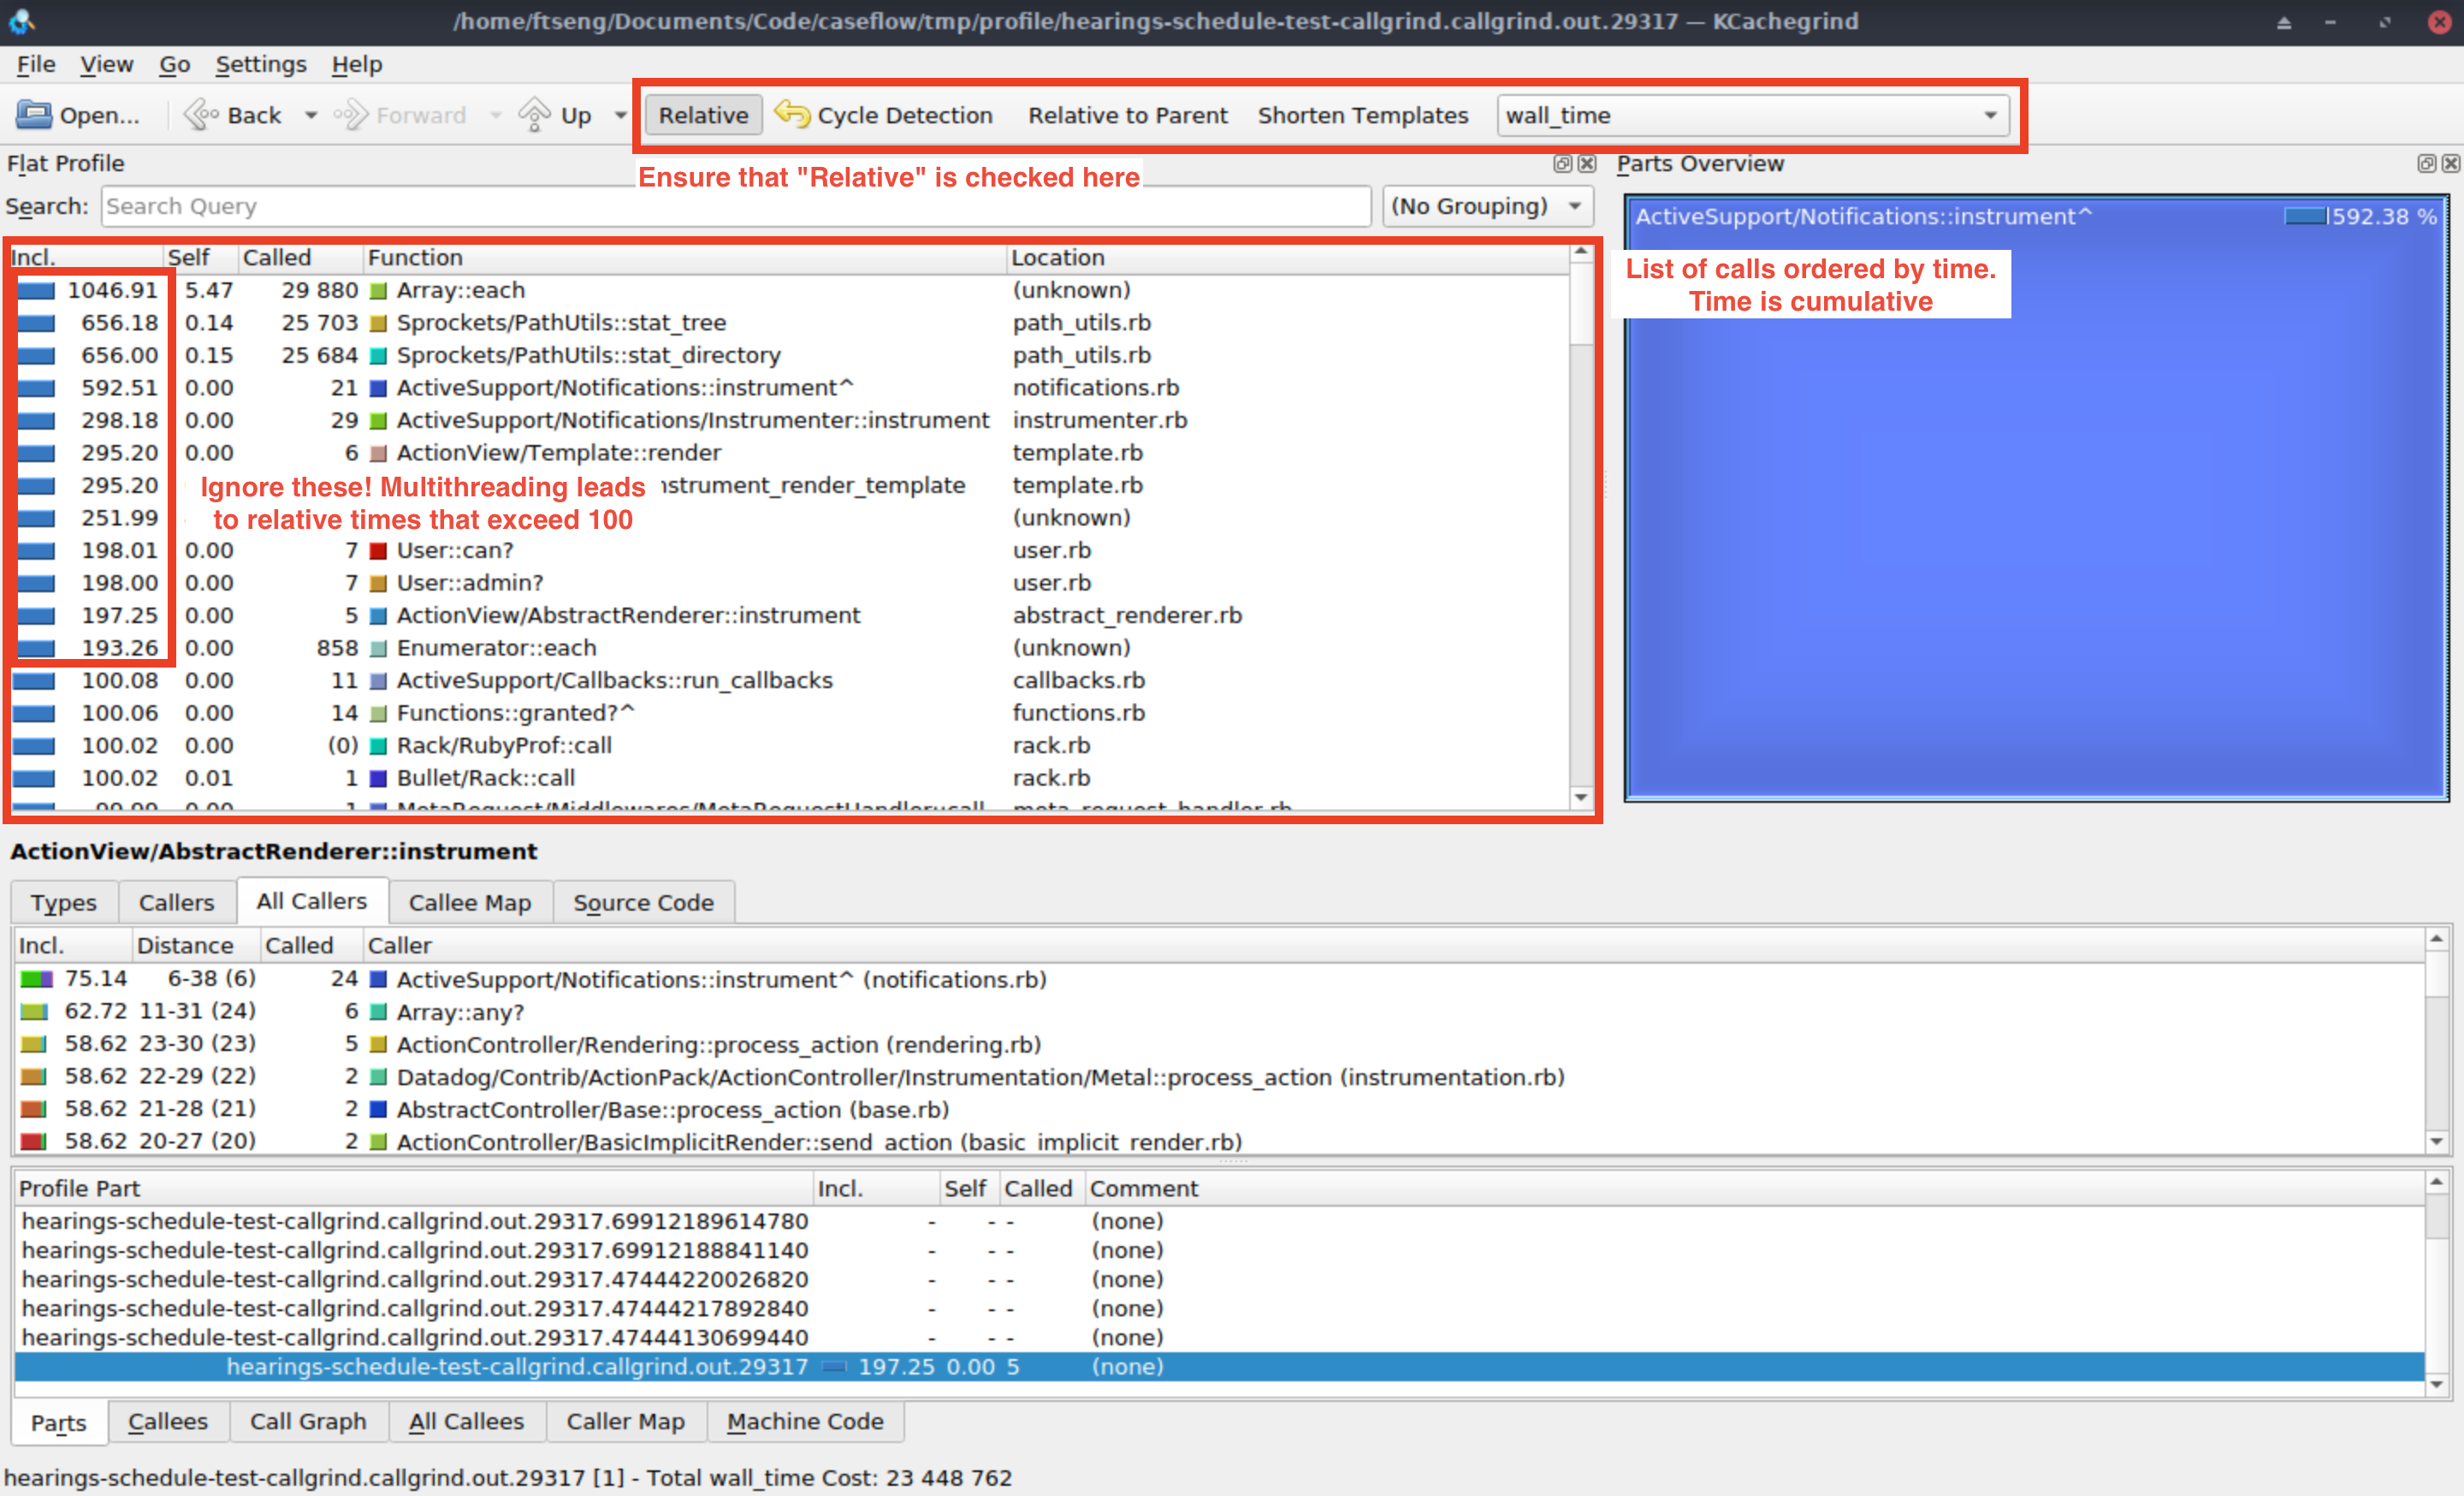
Ensure that you have "Relative" toggled, which shows the time in each function relative to the total time. Occasionally you'll see functions that show that their relative time exceeds 100%, which I think is a side-effect of how threaded functions are captured. I will generally ignore these since they have rarely been useful for me.
The best place to start is usually by trying to find the controller function that corresponds to the route you're profiling. Because the relative time represents the cumulative time of a function, the controller function is usually among the top records in the list:
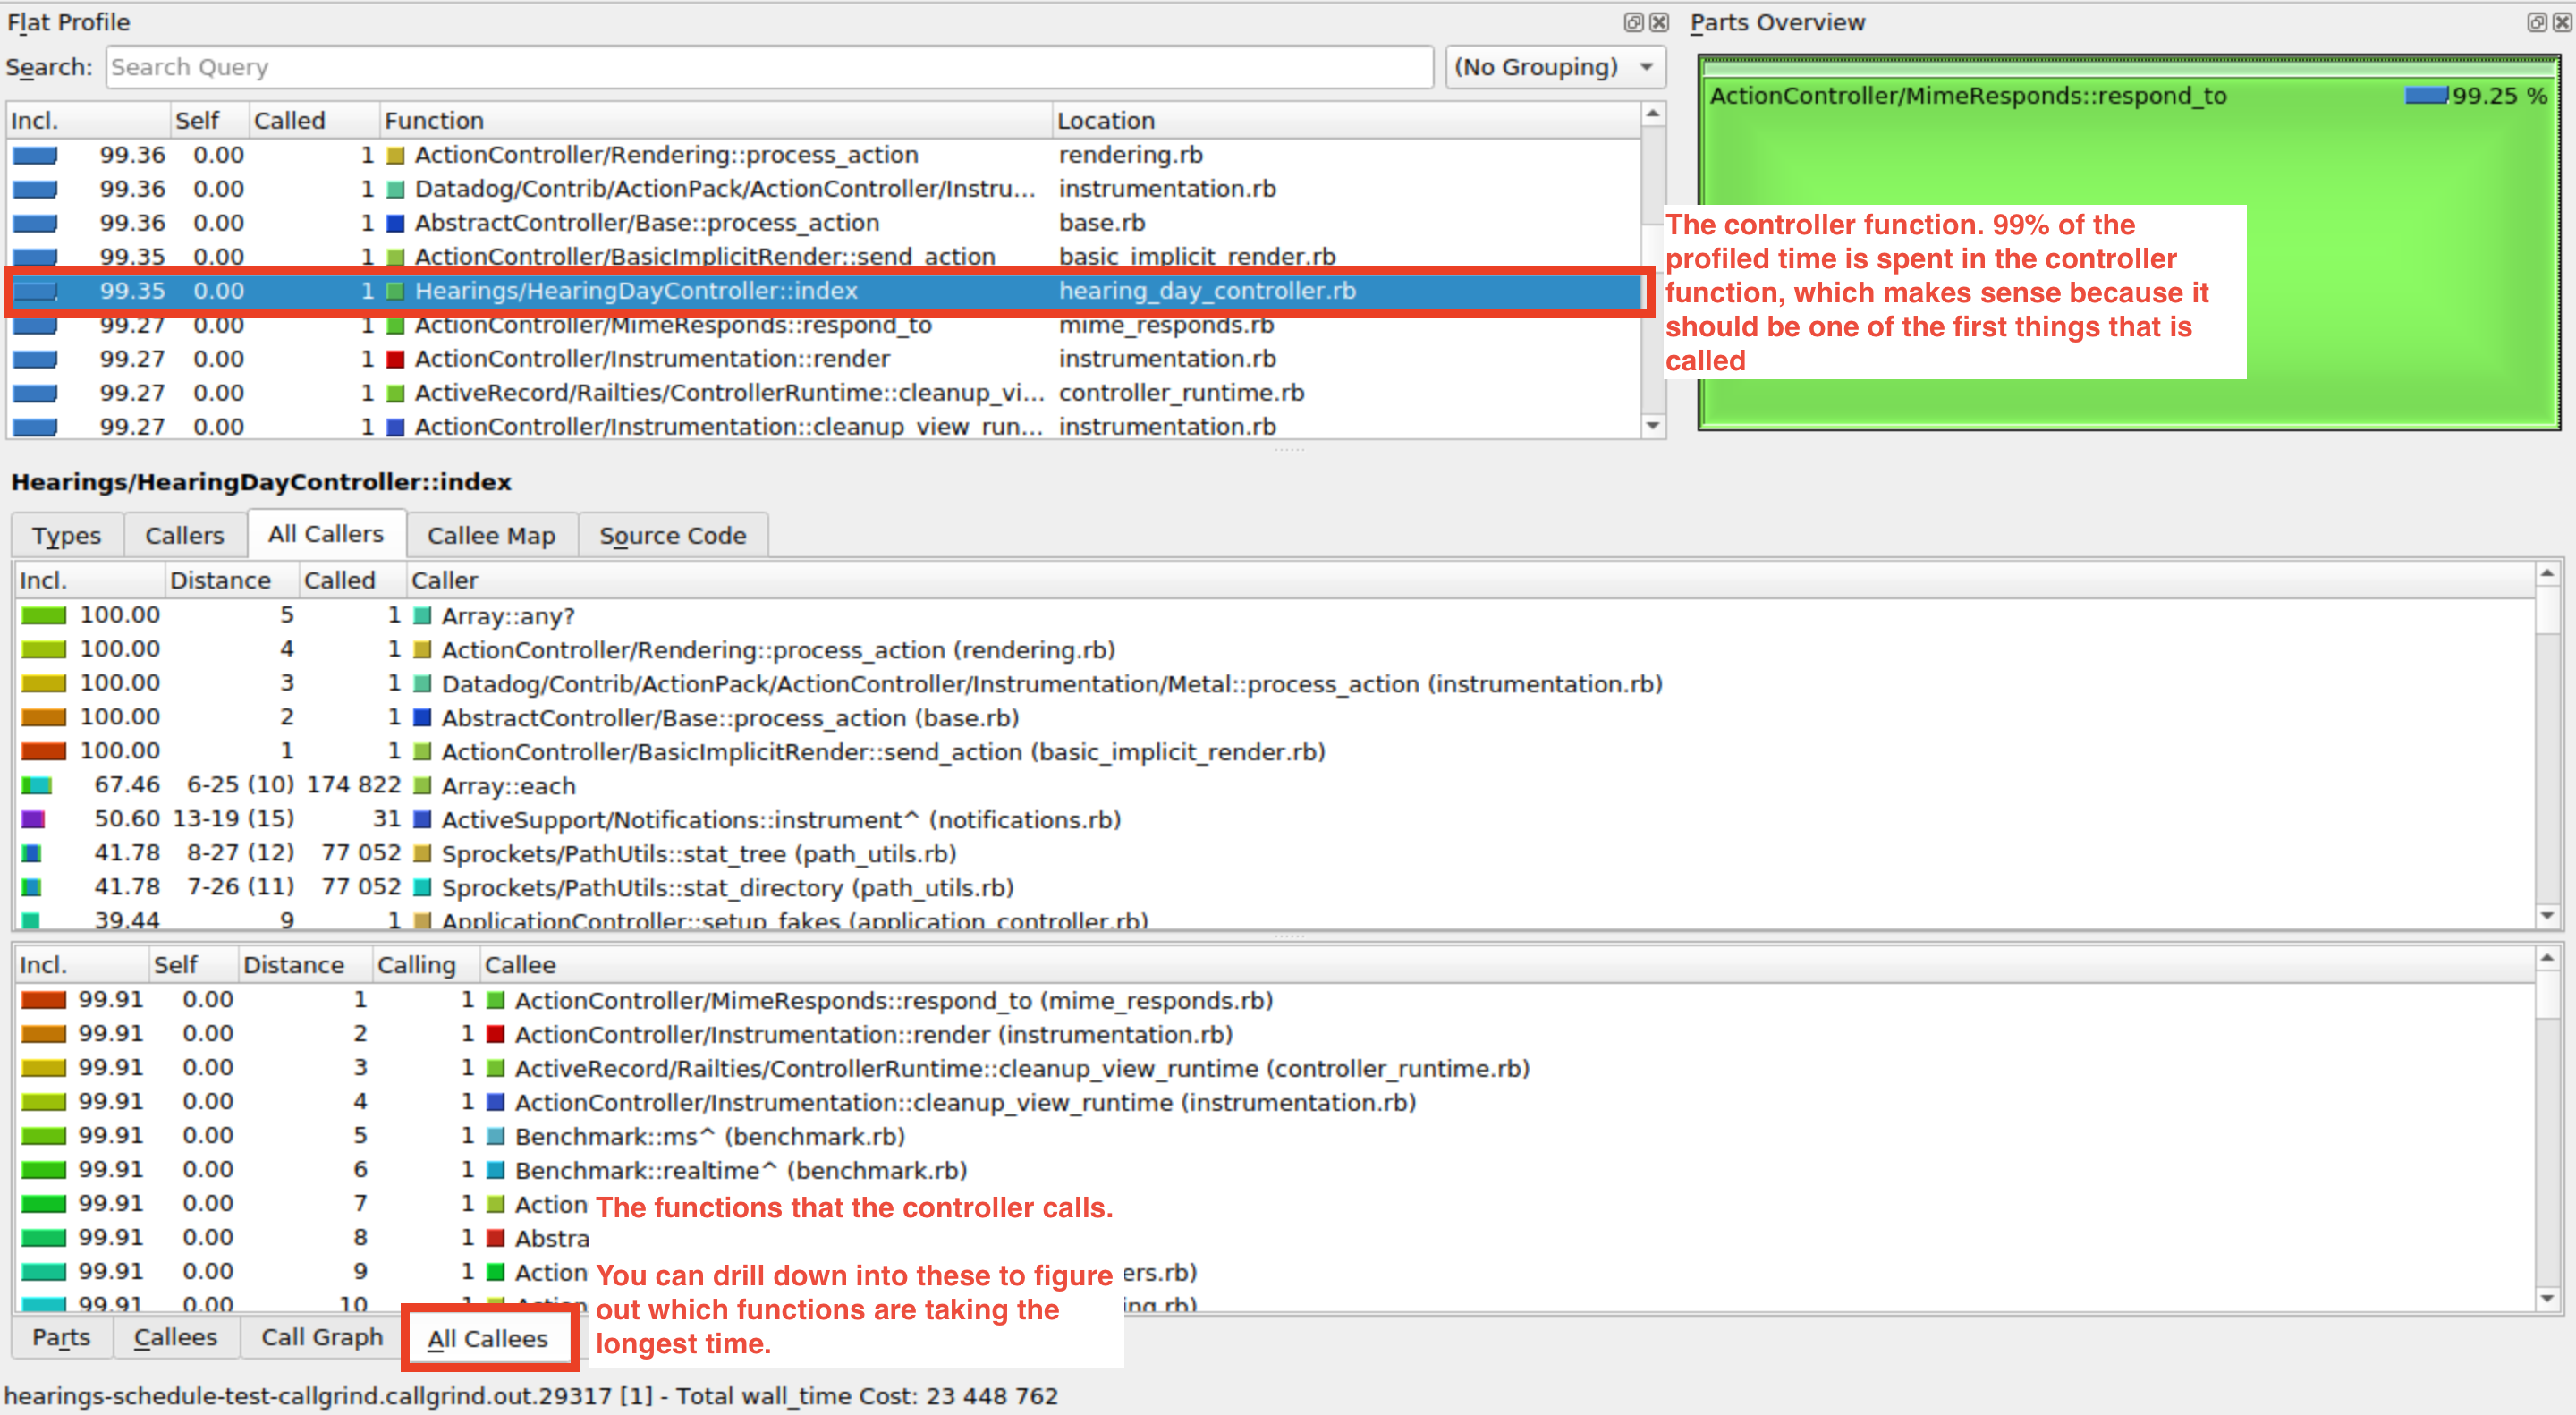
When you find the controller function, you can drill into the functions that it calls, and look for any bottlenecks by looking at the time each function takes. One common case that I've run into is finding routes where a good chunk of time is spent in the serializer code. In every cirucmstance, I've traced this down to the serializer loading associated data from an external system. Focusing the serializer down to only what is needed by the frontend or prefetching data is a good way to optimize these cases.
In many cases, slow performance in production can be traced to slowness in an external systems (e.g. BGS). If you suspect an external service could be the culprit, a good place to start is by confirming that in New Relic.
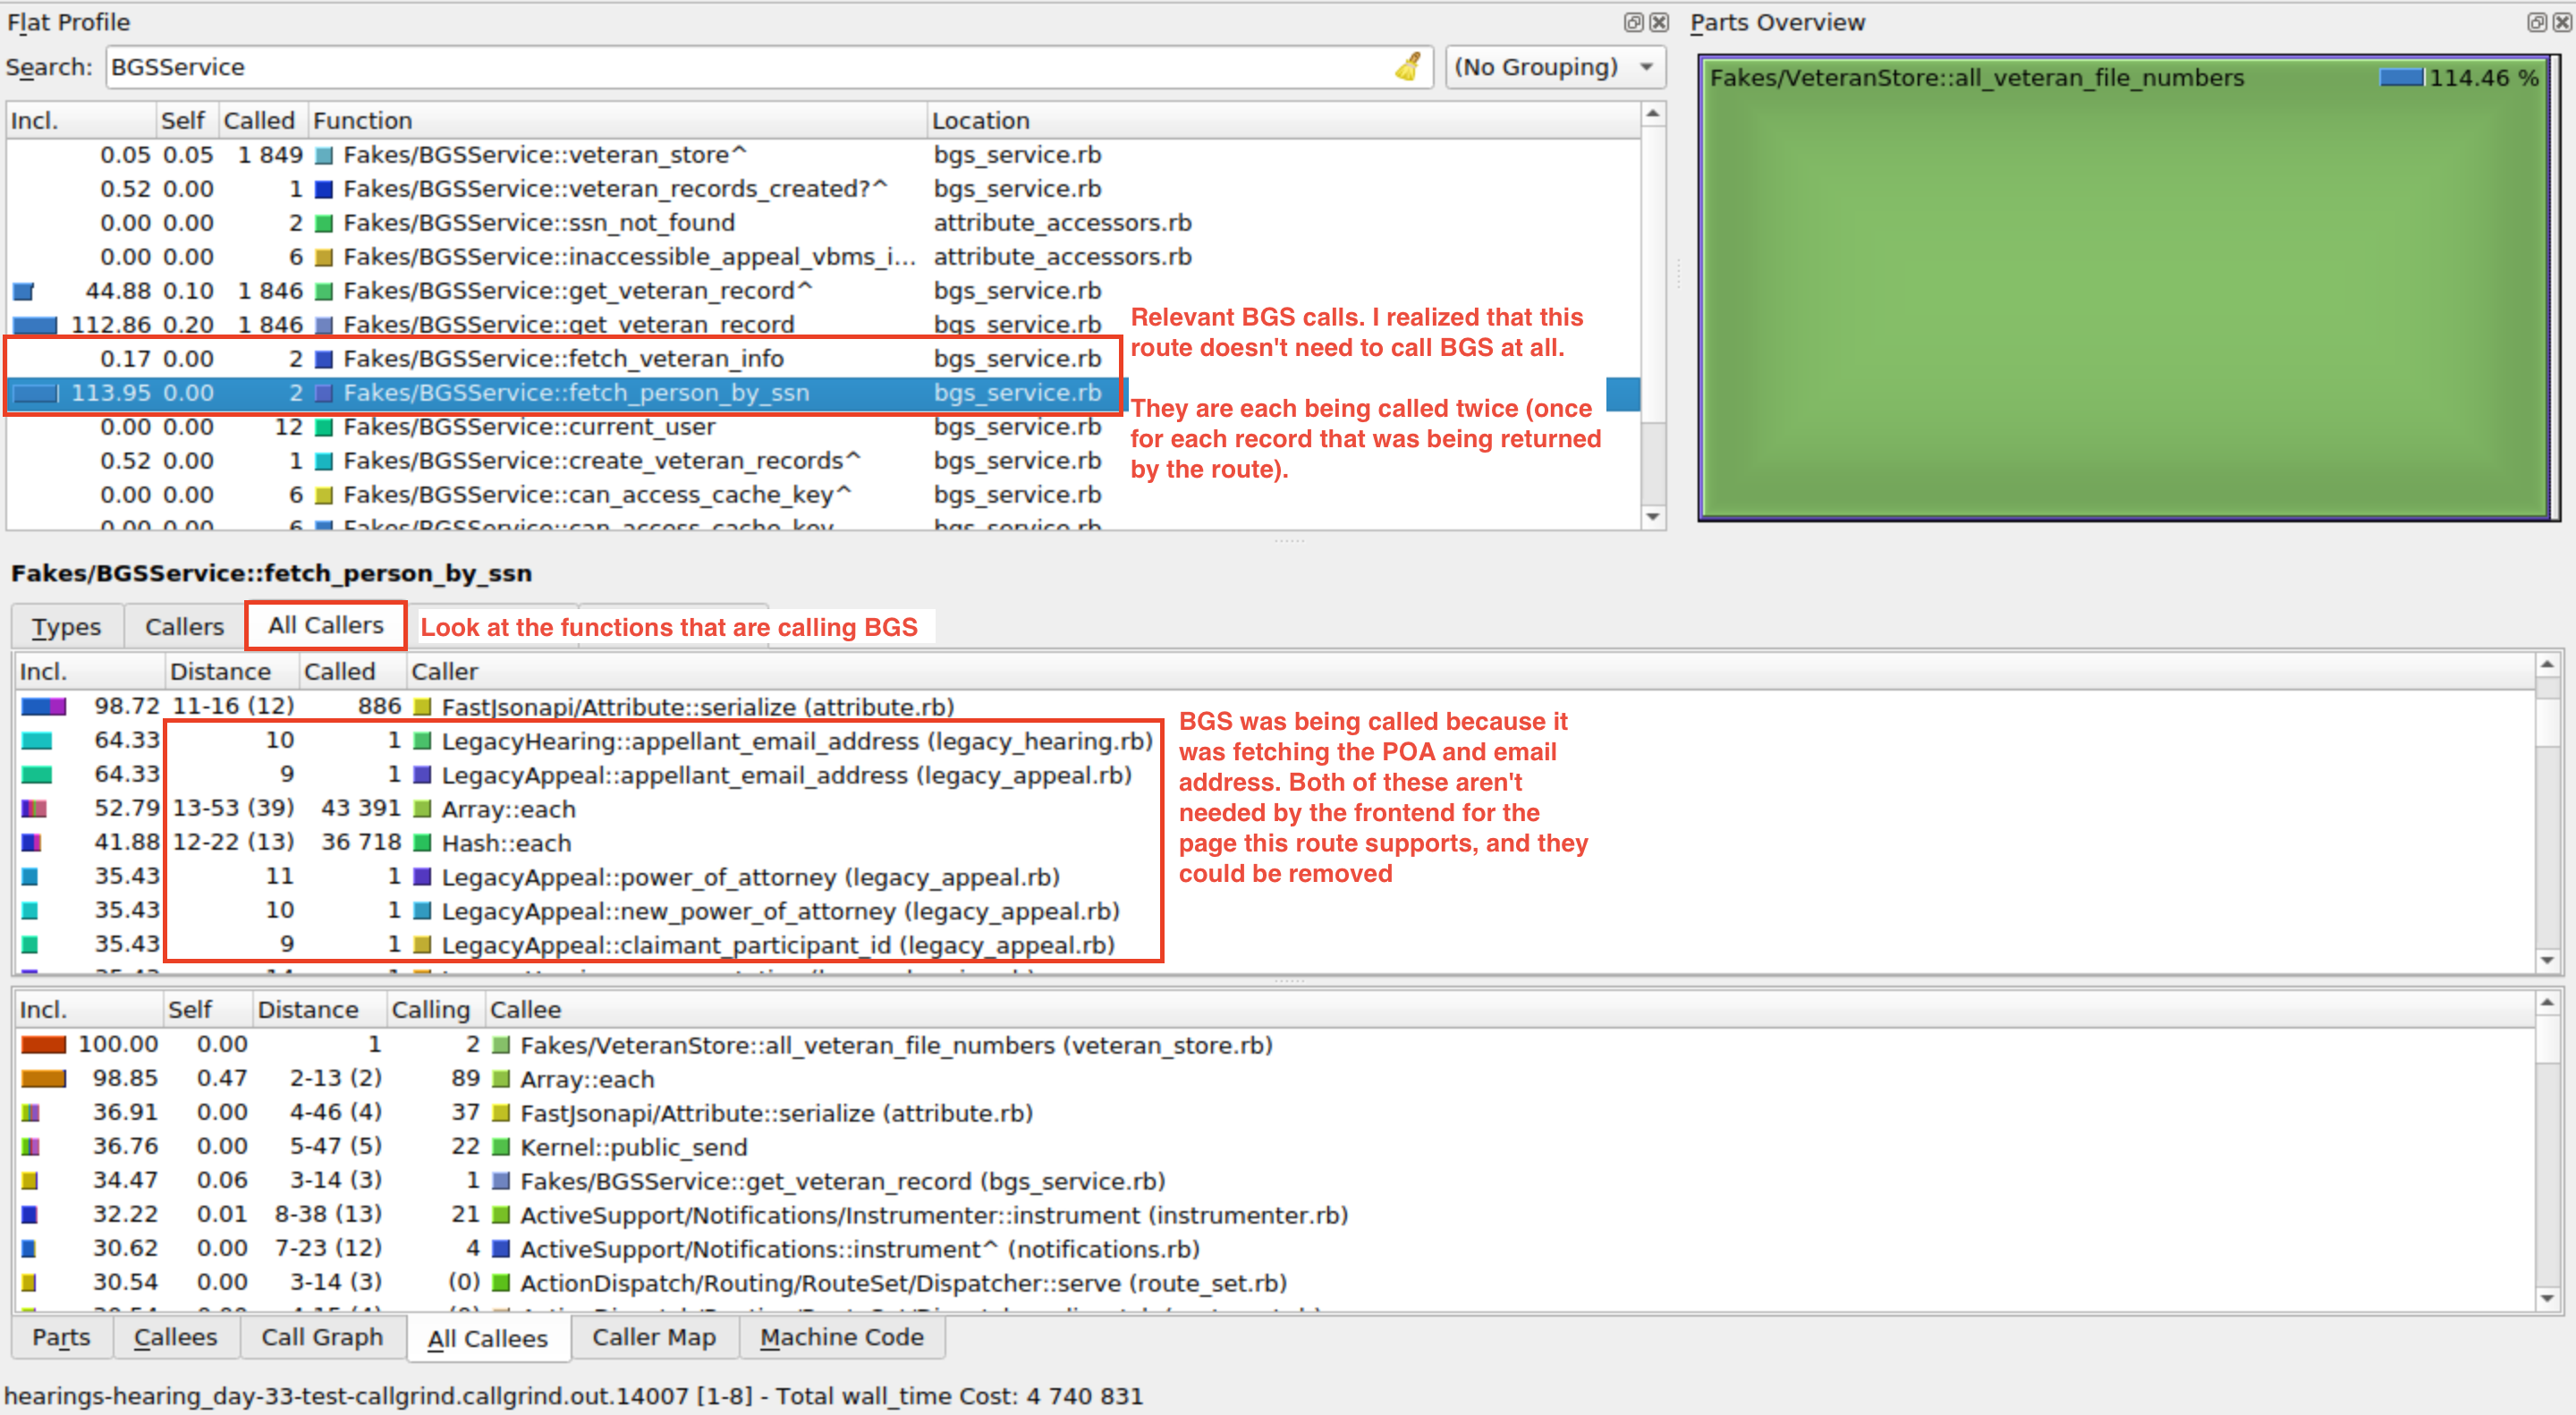
While it's difficult to replicate the slowness of external services in your development environment, you can use KCachegrind to identify places where BGS calls are happening, and determine if those calls are actually necessary. You can do this by searching for BGSService, and inspecting any calls to the external service. You should be able to access all the methods that call into the BGSService (either directly or indirectly), and figure out from there whether or not your route needs that data.
The Called column is really useful here, and can flag if too many BGS calls are being made:
- Performance in Caseflow isn't that consistent. I've run into cases where I think something is causing the issue, but there is no evidence in the code that suggests that it should be an issue. If you run into that, sometimes the best approach is to generate a new profile. Also, this could also be an indicator that the slowness is being caused by an external system.
Here are some PRs where I have used this technique to diagnose bottlenecks in Caseflow: