Parts of a chart - dc-js/dc.js GitHub Wiki
This screenshot shows which properties and accessors control which text in a chart.
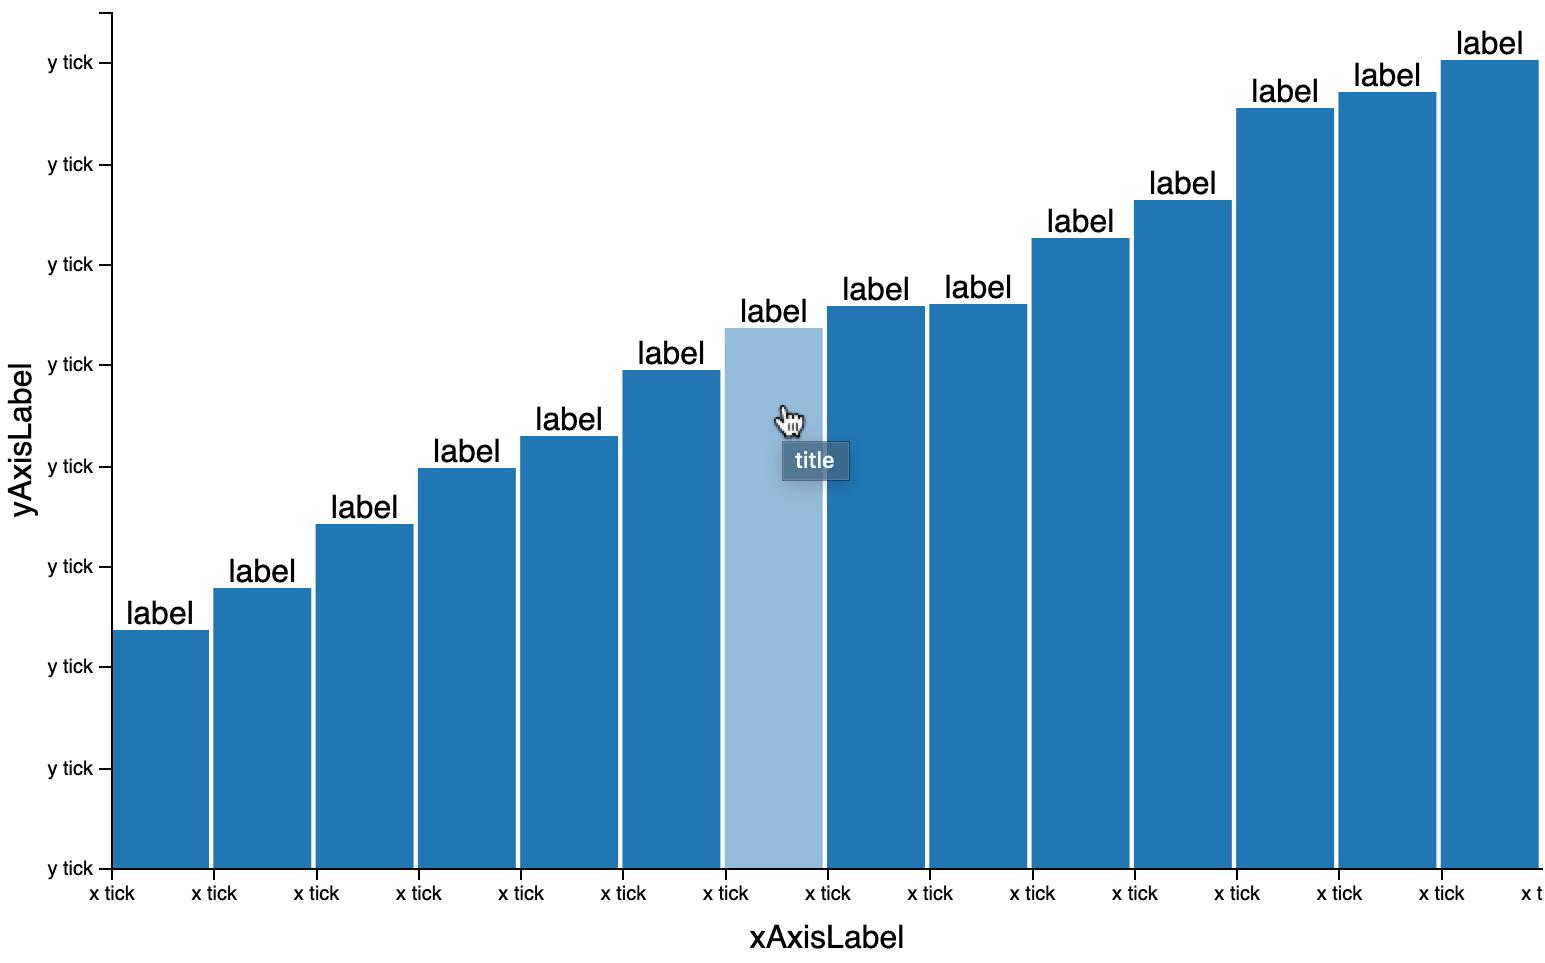
(fiddle)
To change axis labels, first get the axis object using .xAxis() or .yAxis(). Then use .tickFormat() or other d3-axis methods to change the text. Be sure to do this in a separate statement or confusion may occur.