X10. London prototype: Testing manual data capture - colouring-cities/manual GitHub Wiki
Testing manual methods of generating open building attribute data for London. Author Polly Hudson.
Introductory remarks
This section describes testing of ease of manual capture/upload of data to a GIS interface, for specific types of building attribute currently restricted or unavailable in the UK. Attribute collection tested related to building address (‘Location' category); age, façade date and historical sources (‘Age' category); current land use including mixed use (‘Land Use’ category), original land use (‘Type’ catgeory), and storeys (‘Size’ category).
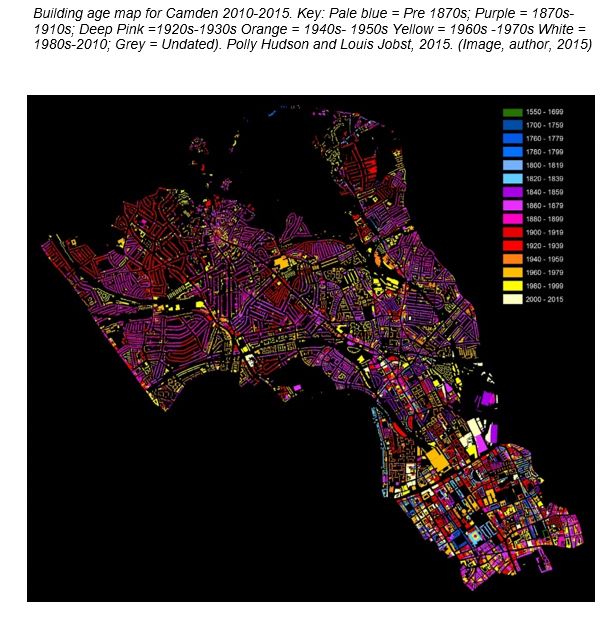
Testing initially began using data from a building age map (produced in 2010 by Polly Hudson, working in collaboration with Louis Jobst and the London Borough (LB) of Camden, to explore the use of typology and age data in improving efficiency in retrofit targeting) as the database's foundation. The age map was produced by rapid comparison of historical maps on a split screen (for 20 year intervals from the mid 19th century to the end of the 20th century). A colour was assigned to each current Ordnance Survey building footprint depending on the map interval within which the current building first appeared. However from 2015, discussions with UCL Energy Institute and highlighted the importance of more precise dating of buildings, with problems of integrating and sharing age data from multiple sources, captured for specific, different date intervals, also quickly becoming apparent. A review of the value of data for use in dynamic simulations of stock dynamics and of loss of diversity and resilience over time also showed the importance of accurate age and lifespan collected at building level. This required a completely different approach to data capture with painstaking research required for each building involving multiple sources, and for these sources to need to be recorded to allow for verification. Other data types were identified as needing to be collected at the same time for age data to maximise value and usefulness. Open address data for example was needed, as (until 2020) spatial reference data (UPRNs and TOIDS) were restricted by Ordnance Survey (the UK's natural mapping agency). Current use, and original use (able to be used to infer building typology) were also noted, combined with age, footprint and storey information were identified as being able to provide detailed information on a building's 3D form, size, lifespan and current use.
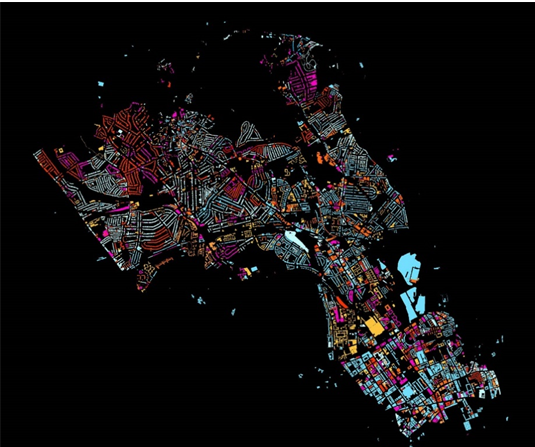
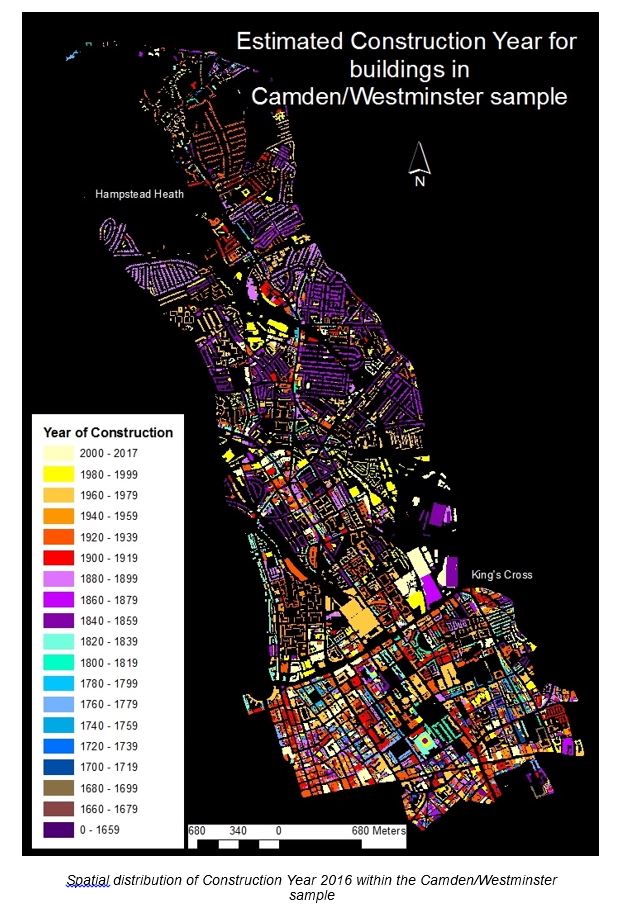
The 2010 map below visualises date generated using historical interval assessment methods for all but the south east tip where buildings have begun to be dated year. The change to building level analysis shown in the southern tip of the second map reveals much greater complexity and diversity of age and form at play.
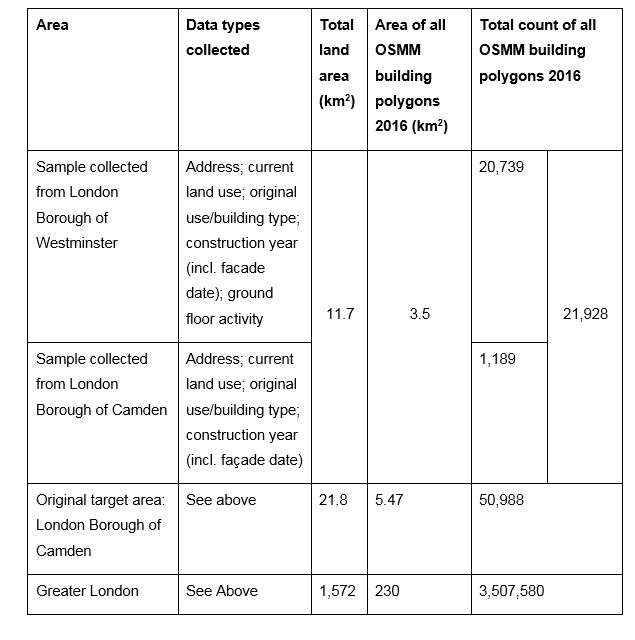
Between 2015 and 2017, building attribute data for 21,928 OSMM contiguous building polygons, falling within the London Borough of Camden and the City of Westminster, was manually generated by Polly Hudson. Through this process, over 100,000 new data points were made available for open release. Data production was carried out using ArcGIS sofware, and relied on access to Ordnance Survey MasterMap footprints accesssed via UCL’s public mapping agreement with Ordnance Survey and the Greater London Authority. Though data collection was carried out over two years less than half of Camden’s total stock was able to be assessed. The process provided a good indication of the amount and quality of age, land use and typology data able to be produced by motivated individuals with expert historical knowledge of the stock and with access to footprints and street images as provided by Bing and Google. OSMM polygons were ‘coloured-in’ with data, working from the south of Camden to the north.
Types and quantities of data collected and London context
The Table below provides a summary of types and quantities of data collected in the context of the London Borough of Camden and Greater London.
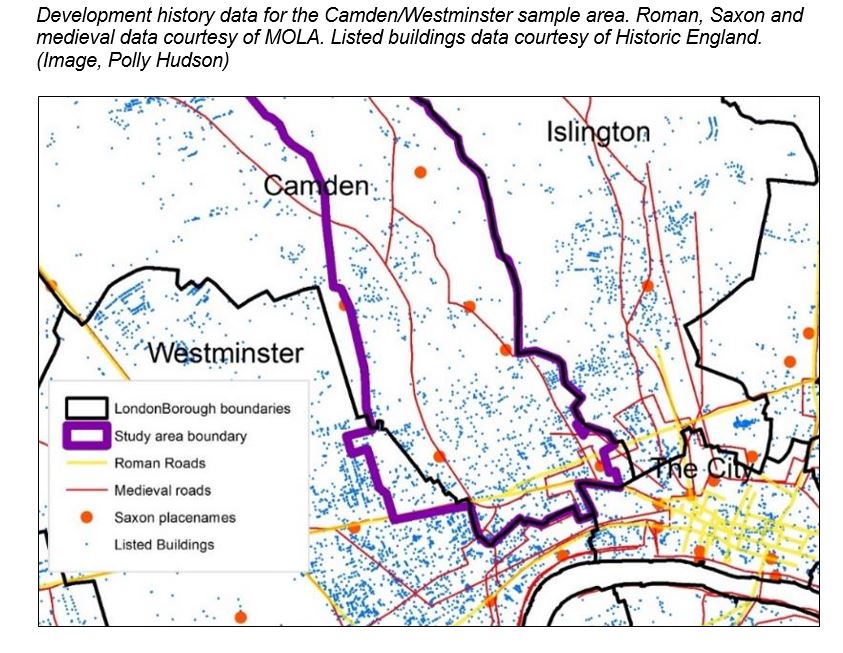
Camden/Westminster sample context
The images below shows the location of the sample in the context of Greater London (LB Camden is highlighted in blue, and polygons for which data were collected, in white).
An image giving the historical context of the sample area was also produced in advance of data collection to ensure that the sample area was as representative as possible. The sample included areas of potential fast dynamics (e.g. high value city centre sites) areas of slow dynamics (e.g. designated areas and buildings), examples of detached, terraced and semi-detached stock from diverse periods, many kinds of non-domestic building, and examples of ‘static’, ‘elastic’ and ‘campus’ tissue (add ref). The sample’s main limitation was in that only a small area of the sample represented the dominant interwar suburban housing type found in Outer London (see Appendix N ADD ref). Vectorised street network data for the Roman and medieval periods was provided by Museum of London Archaeology, and for 1786 by K. Stanilov and M.Batty, as used for their 2011 study described in the paper 'Exploring the Historical Determinants of Urban Growth Patterns through Cellular Automata' .
Overview of data collection principles and methods
The data collection method is summarised as follows:
- Downloading of OSMM Topography Layer from EDINA into ArcGIS and extract building footprints;
- Overlaying into to an open OS background raster map to allow street names to be read and other urban features to be seen.
- Generation of feature classes in ArcGIS, for principle attribute fields, relating to the following data types: Building address; building age; current land use; original land use, and number of storeys. Add secondary attribute fields where necessary.
- Formatting decision for each data type;
- Production of colour keys
- Assessment of issues relating to deriving statistical data from assessment of publicly accessible, but not open, building images.
Address information was added at the same time as age data, with land use, typology/original land use, and storey data added slightly later. Each building footprint was first assessed/checked against a Google Street View image. Bing’s Bird’s Eye facility was used where a 3D view was necessary, as at this time Google had not produced a 3D version for London. (OSM streetview was also tested but not found to be useful as cameras were set at the time on dashboards looking along the road rather than at buildings either side). Google Street View was also the main source of information used to assess land use and storey number/type and to make initial assessments with regard to building age and original use. Though Google's terms and conditions indicate that Google does not have rights over data inferred from their images, terms are relatively opaque. It was concluded that platforms should be aware that terms and conditions relating to public accessible commercial products such as Google Maps could be changed at any time.
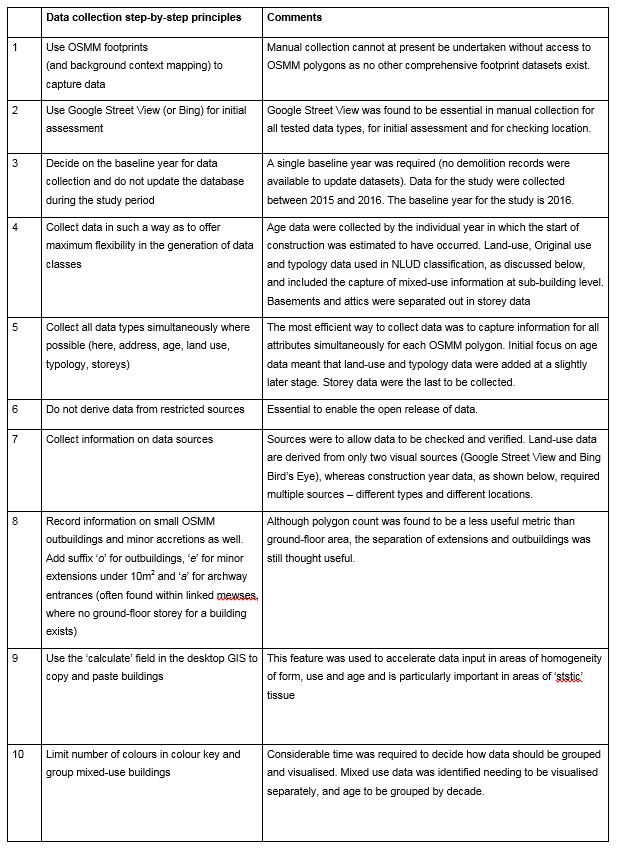
The methods for collecting each type of data tested were developed by trial and error, and adjusted as work progressed. Data entry for some data types was found to be laborious and data types were as a result, separated into those, (e.g. address), for which live streaming from existing (restricted) government databases was considered as essential, and where relatively limited opportunities for enrichment by the crowd were identified; and those (e.g. age) where crowdsourced datasets produced by historians were likely to be far superior to (existing restricted) government datasets held by taxation departments. Storeys and land use were found to be the simplest and quickest to add, making them ideal for school and general public engagement. Age was concluded to be the most difficult and time consuming to add of the five data types tested, owing to the need to refer to and reference specialist text sources. General data collection principles are summarised in the table below:

Collection methods for specific data types
Address data collection
The initial intention was to collect detailed address data for all OSMM polygons/footprints in the sample area. This procedure was needed to provide open spatial location data, and to reduce errors in matching data to the correct polygon. At the time of collection [2015–2016] OS had not opened up UPRNs or OSMM TOIDs data meaning that no spatial reference could be linked to generated datasets. An open basemap with streetnames, and Google Street View were found to be needed to work out which building was which. Addresses were surprisingly difficult to add as the exact polygon had to be selected without building numbers being available. Building numbers on base maps were found to be very important. It was identified relatively quickly that manually entering building name or number, street name and postcode for all polygons was unfeasible within the timeframe. It was also dull and laborious to carry out. Time was considered much better spent on the specialist task of dating buildings. In the end, a compromise was made; street names were collected, along with one or two building names or numbers per street, if easily visible using Google Street View. This ensured collected data could still be released as open spatial data even if TOID ID was removed.
Storey data collection
Storey data were only collected for 1,186 polygons for the Westminster/Fitzrovia sample. This was done using Google Street View and Bing Bird’s Eye, and was relatively straightforward. Basement and attic storeys, as well as core storeys, were collected to support floorspace calculation and 3D typology generation, as basements could not be picked up by LiDAR. Attics were also seen as a useful indicator of 3D form and age. In the Westminster sample, where pavements were built right up to front doors, glass bricks within pavements were a helpful indicator of a basement storey. The need to accommodate rarer examples of multiple basements and multiple attic storeys in the open data platform was also noted, as was the need to separate storey data into ‘basements’, ‘core storeys’ and ‘attics’. An additional category for ‘semi-basements’, commonly built in later nineteenth-century Victorian terraces (Muthesius, 1982), was also identified as necessary.
Building age data collection
Building Age collection principles were as follows:
Age data was by far the most complicated to collect of all data types tested. It required not only access to specialist sources but also relied heavily on Polly Hudson background in architectural history. A key finding was that platforms designed to capture age and other types of historical data, through crowdsourcing, need to involve historians and historic building specialists in their design. Recognising a building’s age from an image, knowing where to access historical sources, and being able to differentiate for instance between an original example, a pastiche or a revival, all require significant experience of observing and dating many buildings of a similar type. A dropdown feature of common sources was also considered to be of potential value. It was also thought that through this feature a catalogue of key sources of historical data on London’s buildings could be built up over time. It was concluded that in terms of crowdsourcing age the process ideally needed to be broken down into small achievable chunks allocated to local historic building groups, all working simultaneously on the same city canvas, with live colouring by one group/individual increasing motivation for others.
Before revisions to the 2010 Camden dataset had began in 2015, the author had convened a meeting of historic building specialists to discuss the dating method proposed, as well as to identify London sources of relevance. This was attended by representatives from the Survey of London (Peter Guillery and Amy Spencer), the Institute of Historical Research (Matthew Davies), the Centre for Metropolitan Studies (Mark Merry), and Museum of London Archaeology (Peter Rauxloh), and by Philip Steadman from UCL Energy Institute and Carlo Molinero from CASA. Separate meetings were also held with Charles O’Brien, co-editor of the Pevsner Guides, and David Hayes, editor of Camden History Society’s (CHS) Streets series, as the author anticipated that data could possibly be collected most quickly using these two sources.
Data for four attribute fields of interest were captured, as shown below: estimated construction year; known construction period (allowing uncertainty of age to be accommodated); façade date; and data source.

Steps used to date buildings are illustrated in Figure 7.6 and recorded in Table 7.4. The process began with an assessment of the building facade using a Google Street View or Bing image and an initial estimate of age based on the author’s knowledge of architectural history and of London’s buildings. This process was also applied when checking for small, later building insertions in homogenous areas – where the ‘calculate’ tool had been used to apply multiple dates at once.
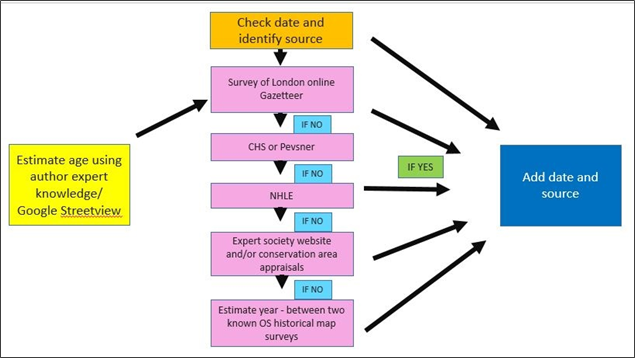
If the building did not fall into an area covered by a Survey of London building age gazetteer, the appropriate CHS printed volume was referred to. Normally, a date was found, if not the relevant Pevsner Guide was checked. The full CHS Street series and the two relevant Pevsner Guides were purchased for this purpose. Where the building date could not be found, but was estimated by the author to have been built before 1840, the NHLE was checked. If built after 1840, a brief online search of expert historical society websites was undertaken. If no date could be located, a date interval was sought from the OS historical County Series and National Grid maps using EDINA Digimap Ancient Roam. Within the interval selected, a single year of construction was then estimated by the author based on her assessment of the Google Street View /or Bing image. The estimated construction date, known construction interval, façade data and sources were then all entered as separate attribute fields.
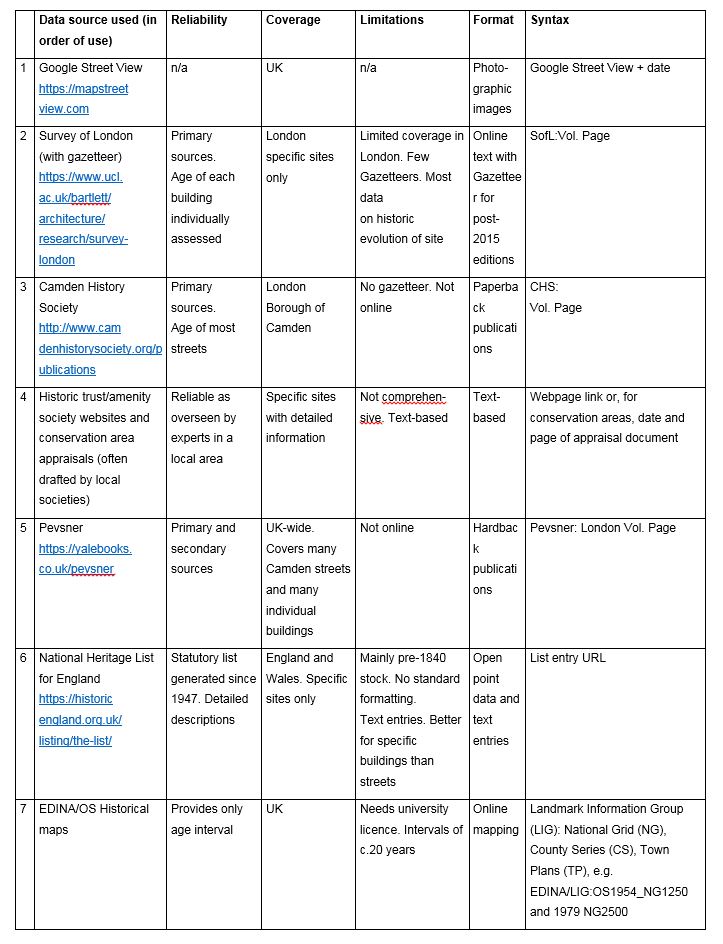
Diverse sources of data for building age, and original building use, were found to be required. Sources needed to be included to allow for data to be checked and verified by others in future, which added considerably to data entry time. Primary sources for construction year were not used, owing to time constraints. Street-age gazetteers were found to be ideal in that they allowed spatial age datasets to be generated very quickly as here date of construction is simply listed next to address. Although rare, these were available for specific areas of the sample from recent Survey of London publications. The main age data source for the sample was the Camden History Society’s Street series. These local history guides were exceptionally useful, combining comprehensive coverage of Camden with accuracy and brevity of description and scholarly research. David Hayes, the series editor noted, in discussion, that the series had taken over thirty years to complete (CHS, 2019).
Principal sources are provided in below. These are listed in order of usefulness, along with comments on reliability, coverage, limitations, format and syntax used in Arc. NB The order balances scholarship and ease of access and is not intended to imply which is the ‘best source’.
Land use and typology data collection
Land use data were collected much more quickly than age, using only a visual assessment of each building’s facade from Google Street View. For both land use and storey data Google Street View was the only source required to be referenced. Expert knowledge was not required. However during the collection process, a considerable amount of experimentation, cleaning and reclassification was needed. This included testing of lad use classification systems. In the end the selection of NLUD system which was chosen owing to its simplicity, logic, breadth and compatibility with the Eurostat Land Use/Cover Area-Frame Survey. The latter attribute was considered particularly important in the context of prototype reproduction. NLUD ‘Order’ includes primary classes such as ‘residential’, ‘community’, ‘retail’, etc., and ‘Group’ includes secondary classes such as ‘dwellings’, ‘medical and health services’ and ‘shops’. Both classifications were used. NLUD ‘class’ was only applied to data collection in relation to ‘Type’. However the NLUD system though developed as part of UK government to harmonise land use classification systems in the UK, has not yet been adopted. The UK continues to grapple with a range of land use classification systems the main ones being the UK Planning use classes, UK property taxation land use classes, and Ordnance Survey /the UK's national mapping agency's land use classes.
As land-use collection and visualisation progressed, a strong relationship between mixed-use and retail stock, and the pre-urban historical road networks began to be observed. As a result, two new mixed-use attribute columns were added for the entire sample; mixed use ‘Order’ and mixed use ‘Group’. Under ‘Group’, combinations of land uses were captured. In a significant amount of cases only one example of each type of mixing was found, which made the mixed ‘Group’ data very difficult to visualise. This was addressed by also creating a column for mixed use ‘Order’, which simply recorded whether a building was mixed use or not.
Using Google Street View, the presence of curtains was used to help identify residential use on a specific floor, with blinds, ‘to let’ signs, and strip lights used to identify offices. Number of doorbells was also useful to estimate number of self-contained units and thus number of potential uses in a building. Though relatively crude, the data provides the only open mixed use data available for London, though far more accurate (but restricted) data have, as noted in Chapter 5, been generated by UCL Energy Institute. Some of the hardest classes to differentiate were purpose-built offices, and flats, built from the late twentieth century onwards. Light industrial, manufacturing and storage buildings were also problematic, while utility buildings rarely had signage or could not be seen clearly from the street, probably for security reasons.
The Arc ‘calculate’ field, as with construction year, was found to be particularly important in accelerating homogeneous land use data collection, especially in residential areas (Steadman et al., 2020). However, even where the ‘calculate’ field was used, a building facade image was still always checked to try to pick up infill and errors.
Typology and original-use data collection
Estimation of the original use of buildings was used to generate information on typology and 3D form. This was done using Google Street View/Bing for non-domestic buildings, and often simply building footprint for domestic buildings. If a terraced building had originally been a house but now had its ground floor converted to a shop with flats above (as analysed by Kalla 4) typology would be classified as ‘terraced house’ (whereas land use would be classified as ‘mixed-use’ ‘Order’ and as ‘retail/residential’ for ‘Group’). However, in some non-domestic cases, OS historical maps containing text descriptions for larger buildings (accessed via EDINA Historic Roam or other historical sources) were referred to. NLUD ‘classes’ were found useful to produce simplified typology descriptions i.e. ‘terraced house’, ‘hospital’ and ‘supermarket’ etc. New classifications had to be added however where typologies had become obsolete (i.e. drill halls).
Summary of findings in relation to manual data collection at building level
Comments
-
Feasibility: Once collection methods had been established, data capture was relatively straightforward for all datasets other than age. As well as providing open datasets that could be used and tested in the set-up of the prototype platform, this process also allowed for spatial patterns of land use and age, distribution in London to be observed at a geographic scale, and level of detail, not previously possible outside the VOA. This was also important in developing hypotheses relevant to the testing of semi-automated computational methods;
-
Basic requirements for mappers: Each data type tested was possible to crowdsource, provided that building footprints, a base map, and a basic mapping interface, and access to Google Street View/Bing or another source of current geolocated building images were available;
-
Collection speed and copy tool requirement: * Of the five types of data tested the order of ease of capture was as follows: Land use, Storeys, Address, Typology/Original building use, Age; Collecting a specific type of data for many buildings is much faster and more interesting than collecting all data types building by building; Identifying and classifying land uses within the domestic stock proved to be a far quicker process than for non-domestic and mixed-use buildings. * Time taken to collect data was also found to be provide a good indicator of the diversity of building age, use and form in the location worked on. Data collection, for example, in areas of significant age and land use diversity, i.e. along elastic’ tissue found close to the historic core, along major historical routes, and within ancient nucleated ‘villages’, was exceptionally labour-intensive. Collection of data for homogenous tissue was very quick but required use of Arc ‘calculate’ tool. Access to a copy tool within open data platforms was identified as essential to maintain motivation particularly when colouring domestic area.
-
Building Age data issues: Capturing building age is extremely difficult and time consuming and least 2/3 of time spent on all data capture was taken up by age data. Expert knowledge of historians and building conservation specialists in terms of age data, expert knowledge of older buildings, of footprint shape, and of historical sources, were found to be needed to date buildings. It was concluded that it would be difficult for non-experts to collect these age data without specific guidance. Referencing multiple sources is also time consuming but essential to allow data to be verified. Though errors will have occurred, it is considered that age datasets generated through this method are likely to be more accurate and precise than age data within VOA property tax datasets, and commercial age datasets, as they are collected at building level and checked against at least one historical source. This was later confirmed by UCL Energy Institute’s selection of Colouring London age data as its age data source of choice for the LBSM (Steadman et al., 2020). It was also noted that if the author could, herself, date 20,000 buildings in 18 months, then historians and historic building experts, collectively, if properly coordinated and motivated, could likely generate comprehensive age data for Greater London in under two years, especially in the light of the scale of voluntarily time already provided by this sector.
-
Address data issues: collection was found to be exceptionally time consuming, and dull, with the process of collection, unlike with other categories, failing to add to the user’s understanding of the stock. The importance of open release of UK address data by government was also confirmed.
-
Land use data issues, a reasonable level of accuracy was found to be possible from Google Street View/Bing images. As such these data types differ significantly from age data in that they can be crowdsourced from non-experts, including schools. Manual capture of land use data is suitable for rapid engagement of non-specialists and involvement of audiences of diverse ability and age. Land use data classes are not harmonised across government departments within the UK causing problems in selecting a single data classification system. Access to current _and _original land use, allow for rapid assessment of likely reactivity and stability of specific land uses over time.

-
Storey data issues: The need to separate out attics and basements was identified, and, in some cases, to accommodate for multiple examples. The potential use of basement and attic data as indicators of the adaptability of a typology was also noted. Address and building ID data are not suitable for manual collection and should be sought from updated public sources. User satisfaction in contributing this type of data also only likely to apply to specialist groups;
-
Building typology/original use data issues:
-
Updating: Demolition data are necessary to ensure datasets do not go out-of-date;
-
Colour and motivation: Seeing the buildings colour instantaneously, and revealing hidden patterns is a significant incentive to add more data; expert advice is needed on clear, and beautiful, colour palettes to maximise motivation to upload. Colour is important, not only to define classes but in terms of the beauty of the data visualisation and the way in which patterns revealed as part of the colouring process were found to motivate the contributor to add more;
-
Outbuildings: The issue of how data on outbuildings and extensions are captured needs further thought;
-
Formatting: Consultation with those likely to use specific data types is necessary to address content and formatting issues;
-
Derived data; Care are needs to be taken to ensure data are not generated from restricted sources, or from sources currently accessible but which may become restricted/charged-for;
-
Data should not be collected on the interior of buildings
-
Visualisation: Visualisation of data at the microspatial level is critical in allowing and interesting diverse stakeholders to co-work more efficiently on specific urban issues and to inform automated approaches - A strong relationship for example can be seen between mixed-use and retail stock, and the pre-urban historical road networks;
-
Performance assessment: Data captured were also found to be relevant to public auditing of local stocks and their performance.
-
Contributors: The data collection process highlighted the need to engage diverse types contributors in uploading and updating specific data types e.g. the historic environment sector (in relation to age and lifespans), the construction industry (materials and construction systems), the planning authorities (planning data). Age data for example is not suitable for collection by schools other than for very small areas with substantials supervision The historic environment sector was identified as most important to target initially owing to its interest in composition, dynamic and performance at local and national level. Schools were also identified as potential uploaders of land use data.
-
Data quality/coverage: Crowdsourcing on its own was considered insufficient to produce the coverage and quality of data required for academic use.
-
Imporatnce for automated approaches: As well as providing open datasets that could be used and tested in the set-up of the prototype platform, the process of data upload, and the visualisation of spatial patterns was also important in understanding attribute relationships required in algorithm development for automated data capture methods. See also N4 Appendix.
Summary findings in relation to spatial distribution
Findings in relation to spatial distribution of age data for Camden
The visualisation of age data in Camden and Westminster in Inner London paints a very different picture from HM Revenue & Customs property tax data which is aggregated at Lower super Output level. Where construction/age data are captured and visualised by building, a rich mix of recent and older buildings can be seen, particularly close to the ancient Roman core, with the number of age bands represented high. This is also true outside the historic core, in nucleated pre-urban villages, along major/ pre-urban routes, and in mewses. Outside these areas diversity can be seen to decrease with distance from the city centre. South of King’s Cross, protected pre 1840 stock can be seen jostling for space with new build.
Mean construction year within the sample was found to be 1897, and modal year 1880. This is explained by the fact that much of the residential urban tissue in the northern half of Camden, shown in purple, consists of Victorian and Edwardian terraced houses, built in periods of relatively rapid development. This type of suburban tissue is interspersed with ‘campus’ tissue comprising post-war estates, as well as low-rise infill, in part caused by Second World War bomb damage. Relatively high levels of post-1980s infill development can be seen at the city centre and along major routes, with major schemes, including those on unbuilt land, generally found to cluster along historic rail and canal routes.
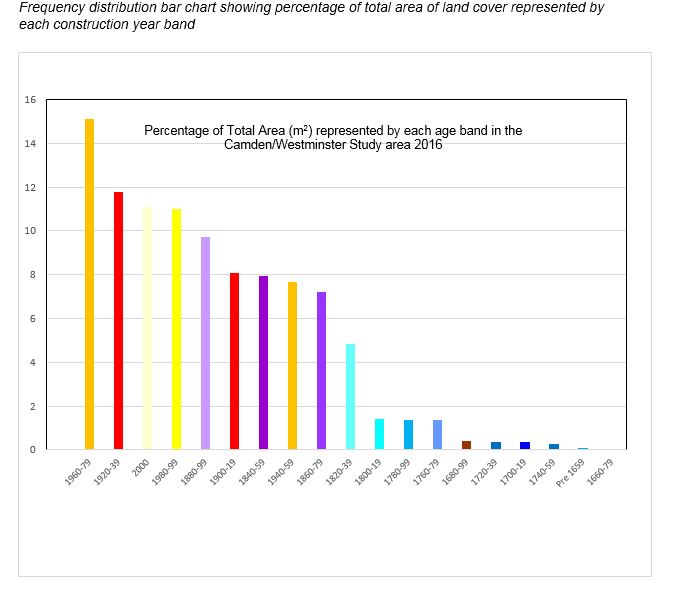
Buildings built between 1960 and 1979, referred to in Chapter 1, as being particularly vulnerable to demolition, hold the largest share of OSMM footprint area, comprising 15% of the total sample. Total polygon area for each band, number of polygons and mean polygon size are provided. Thirty-seven per cent of total OSMM footprint area is recorded as being built since 1960. This would, it is likely, represent a much higher percentage when measured by total floor area. Interwar (1920–1939) stock, interestingly, has the second-highest frequency of all construction-year bands, despite the sample being located within Inner rather than Outer London where interwar development, as shown in Chapter 5, is most common. These buildings comprise a mix of suburban housing, typical London County Council low-rise flats, low-rise blocks of private flats, and a variety of non-domestic types. Buildings built before 1840 represent only 11% of the total in the sample, and buildings built before 1800, 4.1%.
Modal age frequency for five 50 year intervals is shown for the sample area, in the diagrams below, at both LSOA and at Output Area level, to further illustrate the problem of visualising attribute data at these more aggregated scales. At LSOA level, post-2000 development is not visible at all. The oldest building polygon identified in the Camden and Westminster sample was 832 years old, and the youngest, under a year.

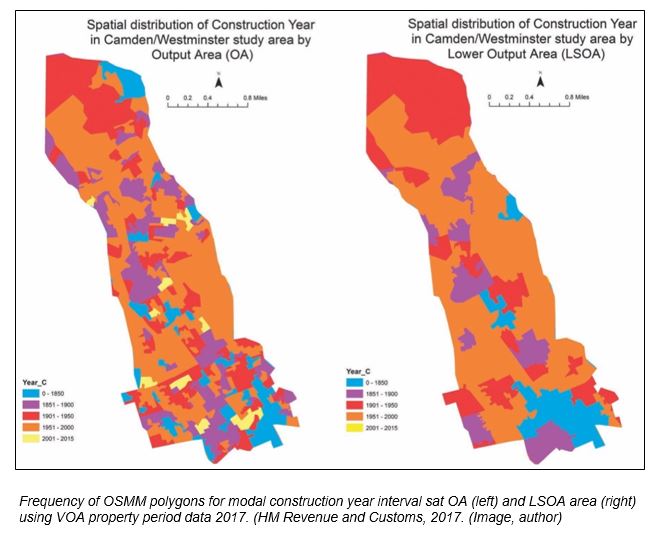
8% of buildings were built before 1816. 40% (8,842) were under 100 years old, and 22% (4,716 polygons) under 50 years old. 20 outliers were recorded as over 350 years old. The modal age was 140 years old. Results however could not be verified using existing government property tax data or commercial dataset owing to access restrictions.
.

Findings in relation to spatial distribution of land use data
Spatial patterns of land use diversity were found to be very similar to those relating to building age. As a general rule, the further the building lay from the historic centre, the greater the homogeneity of use, and the faster and easier land use and typology were to classify. Exceptions to this, as in age, related mainly to nucleated pre-urban ‘villages’ locations (such as Highgate) and to pre-urban routes. Classification was particularly challenging and time-consuming for mews buildings as these comprised many small polygons with a variety of uses, many of which were difficult to assess by façade alone. In these areas, and south of Euston Road, the ‘calculate’ tool had little value. Nineteenth-century mixed use terraces, with retail below (and either offices, retail, storage or dwellings above), were found to cluster heavily along the ‘elastic’ commercial tissue and major older routes as shown in Figure 7.11, as also shown in the LBSM. Upper flats along these traffic heavy routes were noticed to often be poorly maintained. Rundown, relatively recently built student accommodation buildings were observed in a number of locations, highlighting the value of local area auditing and assessment using open data platforms to identify poor performing buildings and typologies, and ownership types, potentially vulnerable to demolition.

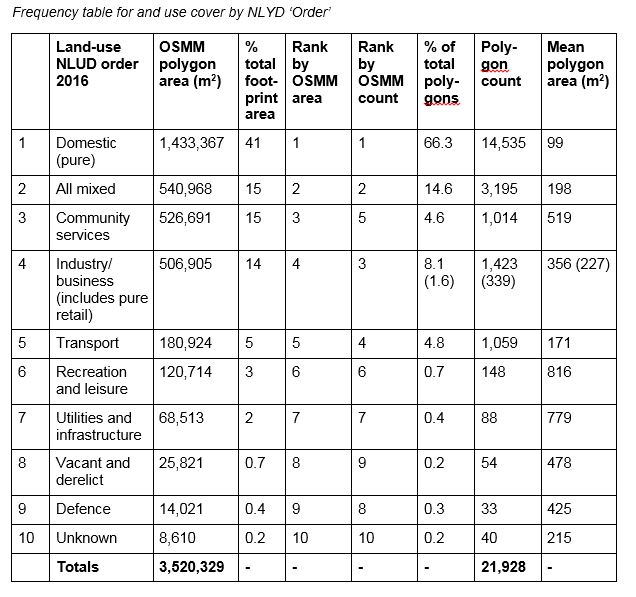
Land-use frequency for Camden and Westminster is shown below. Frequency is measured by both OSMM polygon area and by total number of OSMM polygons. Here, although domestic land use still dominates, there is a relatively high ratio of non-domestic to domestic buildings compared to other areas of London (as seen in the LBSM). This is explained by the Central London location of the sample, where conversion from residential to commercial or mixed uses has been common. Mixed-use buildings (including much retail), community services and industry/business uses, all took a similar, significant, share of OSMM polygon area, followed, in decreasing size, by transport, recreation and leisure, utilities, vacant and derelict buildings, and defence. Mean polygon size indicates that domestic buildings are on average five times smaller in footprint than those built for community use; seven times smaller than for utilities and infrastructure buildings; and eight times smaller in footprint than recreation and leisure buildings. Over 14,000 OSMM polygons were recorded as domestic buildings, compared to 3,000 for mixed use (the next highest), 1,500 for industry/business, and just over 1,000 for community buildings.
Findings in relation to spatial distribution of original use/typology data
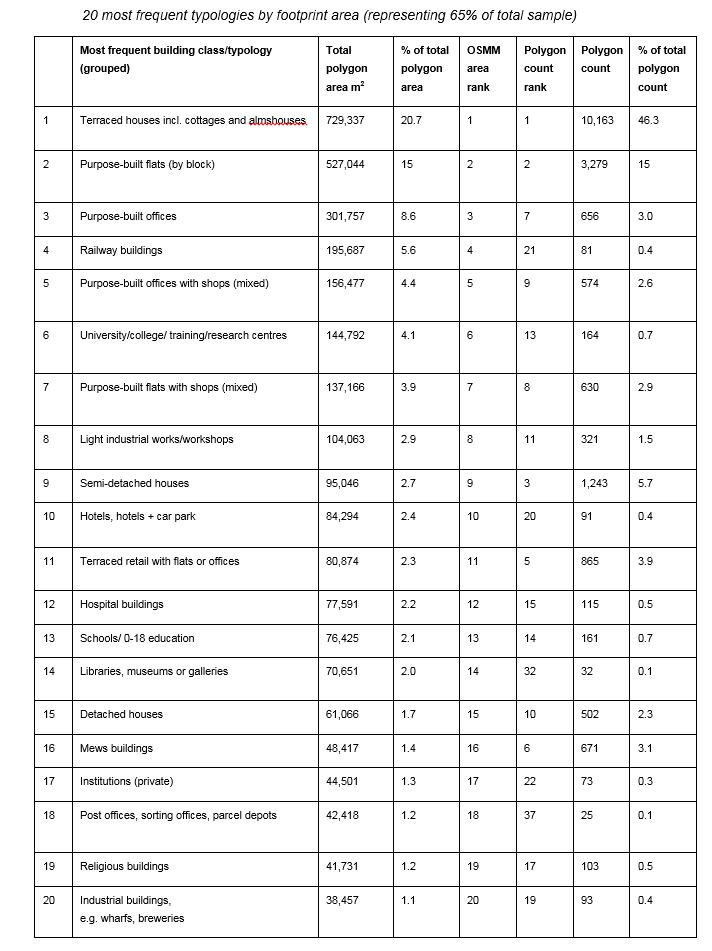
When measured by type, based on original use, and calculated by OSMM footprint area, domestic buildings, as expected, dominate the rankings, with terraced houses ranking highest (21% of total polygon area and 46% of polygon count), followed by purpose-built flats. The exceptionally high ratio of flats to houses can again be seen to relate to the sample’s Inner London location, where land prices and building density are high. Purpose-built offices are also in the top three typologies with a total footprint of over 30,000m2 representing 9% of total polygon area and only 3% of polygon count. Although ranking thirtieth by footprint area, garages were particularly interesting as these ranked fourth when measured by polygon, and were noted to commonly occur as small single-storey strips on many post-war estates, taking up a significant amount of land. Surviving factory buildings were also interesting in that they were found to be extremely adaptable, having commonly changed to residential or commercial use. Georgian buildings originally built as houses along older routes, had as previous noted, often converted to a retail/residential form.
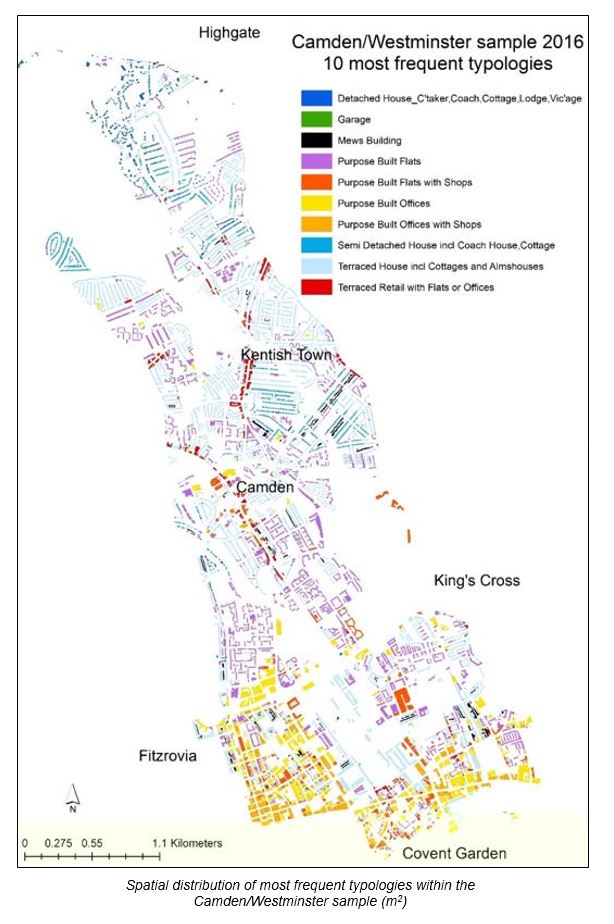
Below the spatial distribution of the top ten most common typologies, by NLUD Order, is shown. Here, most noticeable is the clustering of purpose-built offices close to the city centre, of terraced retail with flats or offices along older major routes, and of the broad distribution of purpose-built flats across the sample as a whole.