X06. London prototype: Literature review: Data needs in context of sustainability science - colouring-cities/manual GitHub Wiki
Author Polly Hudson, 2020.
1.1 Introduction
This section is the first of three that describes the process by which data subcategories relating to the composition, operation and performance, and dynamics of the building stock were selected for testing in Colouring London. In this section attention is paid to data required within platforms to support the analysis of energy and waste flow over time.
1.2 The building stock and energy and waste flows
At current rates, it is possible that the extent of land urbanised over the next fifty years will exceed all urbanisation in history (Mehaffy, 2017). Between 2018 and 2050 the percentage of the world’s population living in urban areas is expected to rise from 55% to 68% (United Nations, 2018), with 85% of Europeans already living in cities and towns (Roser et al., 2013). Over the last century, while population has increased fourfold, material and energy use has risen ten-fold (Weisz and Steinberger, 2010). The International Energy Agency records that ‘The building and buildings construction sectors combined are responsible for over one-third of global final energy consumption and nearly 40% of total direct and indirect CO2 emission’ (International Energy Agency, 2021). Direct emissions relate to those generated in construction, building operation, adaptation/refurbishment and demolition, and indirect emissions to those generated in the production of construction materials and technical installations (Sharma et al., 2011). The United Nations Framework Convention on Climate Change (UNFCCC) is now placing significant pressure on countries to accelerate the reduction of emissions and material waste, especially that generated by building stocks.
In mature industrial cities of Europe, the rate of churn (i.e. new buildings minus demolitions), is slow compared to rapidly developing areas of the world. New additions are estimated, on average, to be built at an annual rate of 1% (Hassler, 2009, p. 554), with demolition rates recorded at under 0.25% (Thomsen et al., 2009). Stocks are consequently relatively old, with half of European dwellings estimated to have been built before 1970 (European Commission, 2021; Meijer et al., 2009). UK dwellings are considered to have the longest average lifespans in Europe, of over a 100 years (ibid.).
In mature stocks, reductions in greenhouse gas emissions relating to stocks mainly focus on reducing levels of heat loss and electricity and gas use (Energy Savings Trust, 2021). Energy reduction is likely to be addressed, as in the case of the UK, though a mixture of planning policies and public education programmes relating to consumption reduction, retrofit and smart metering roll-out, a tightening of planning regulations, and the provision of financial incentives. Issues with material flows will generally relate to areas of high stock turnover (in London for example, in the financial core), and to the significant cumulative impact of adaptation small-scale addition and deletion with plots (Thomsen et al., 2011a) and will generally be dealt with through policies such as the EU Waste Directive of 2008 that prioritise reuse and life extension over recycling and new build (European Commission, 2008; Huukha and Lahedensivu, 2014). The shift in focus from new build to the existing stock is also a result of a slowing of growth in mature cities (including some shrinkage) and the need to increase refurbishment to support sustainable management. Though this is viewed by Nicklaus Kohler et al. as beginning to replace the European construction industry’s ‘longstanding fascination for continuous growth in input flows, and the ignorance of output flows and side-effects’ (Kohler et al., 2009, p. 449), in countries such as the UK, as noted in Chapter 1, refurbishment policies still remain weak.
In countries such as China, India, Mexico and Brazil, issues with energy and material flows lie more with the unprecedented scale and speed of new urban development (Krausman et al., 2009), and the impact of large-scale demolition programmes and shortened building lifespans on long-evolved urban ecosystems, cultural traditions, social identity, and on physical coherence in cities that helps support social cohesion (Xu et al., 2019). In Asia, the average building lifespan is estimated at only 25 to 30 years (Miatto, 2017). In these fast developing areas of the globe, new stocks, the quality of which is not yet fully understood, have doubled in some cases in 20 to 30 years, and may still double again within the century (Kohler and Yang, 2007). Many countries are also only at the start, or in the process of, transitioning to an industrial type of social system, meaning that already unprecedented global energy and waste flows (Krausmann, 2009), loss of building reserves and cultural assets, and population displacement, are all set to increase.
Christopher Kennedy et al. describe how the scale of material and energy flows may be affected by a city’s age, development stage, cost of energy, cultural make-up, climate, and population density (Kennedy et al., 2007). Abel Chávez et al. see the speed of urban change as closely linked to phases in a city’s life, classing urban communities and urban areas according to different ‘metabolic’ rates: ‘unbuilt communities’ in the global South classified as ‘rapidly growing’; ‘built communities’ in North America, Europe, Japan and Australia as ‘mostly stable’; and ‘unbuilding communities’ in the US rust-belt and Eastern Europe, as shrinking and ‘potentially poised for exemplary green infrastructure development’ (Chavez et al., 2018, p. 82). This view of the city as a dynamic system passing through a set of stages was also described by the American theorist and planner Kevin Lynch, ‘While it [the city] may be stable in general outlines for some time, it is ever changing in detail. Only partial control can be exercised over its growth and form. There is no final result, only a continuous succession of phases’ (Lynch, 1960, p. 2).
The formal study of material and energy flows in stocks and cities, caused by construction and demolition processes, is the focus of a branch of sustainability science known as Industrial Ecology (Hond, 2000). In Industrial Ecology, the sustainability, resilience and efficiency of industrial systems are studied (Chavez et al., 2018). Industrial metabolism studies were first carried in the US, in the 1960s, and measure many types of flow including those generated by structural materials, energy and carbon, water, fuel and toxic chemicals (Hond, 2000). Urban metabolism studies, which analyse flows within cities, view stocks as ecosystems in which each part is related to the whole, and promote closed loop systems, which rely on reuse (Chavez et al., 2018); Tanikawa and Hashimoto argue that ‘a sustainable society should minimize its environmental impact by reducing extraction of resources. To minimize extraction, existing stocked material should be used for as long as possible’ (Tanikawa and Hashimoto, 2009, p. 484). Urban metabolism is a rapidly growing field of research, and in relation to buildings is closely related to the study of building age, lifespans, demolition, adaptation, mortality and survival.
1.3 Modulating rates of change, and refurbishment of the existing stock
The need for data on the age of stocks and patterns of dynamic behaviour - i.e removals and additions, is also stressed by Yang and Kohler in their research on China in which they argue that the pace of development needs to be ‘modulated’ in areas of rapid growth, to counter flows and resource depletion, and declining quality in the stock owing to lack of refurbishment (Yang and Kohler, 2008, p. 16). They also state that emissions cannot simply be addressed through energy conservation and technical improvements alone (ibid.). Alessio Miatto et al. also advocate a ‘slow construction sector’ and recommend that the average lifespan of buildings be used as an indicator of the speed of change, by policy makers, to help promote adaptive reuse over demolition (Miatto et al., 2017). Demolition and reconstruction may have economic benefits in the short term, but in the long run will create a worse scenario for countries in terms of flows, and loss of finite socio-economic and cultural resources (ibid.). Mehmet Aksözen et al. also argue for an ‘optimal speed of transformation’, to prevent loss of older reserves with high embedded value (Aksözen et al., 2017, p. 256).
Kohler and Yang state that ‘Unlike other economic sectors producing consumption goods with short lifespans, the evolution of the building and infrastructure stocks depends significantly on the already existing part’; knowledge of this existing, older section is therefore essential (Yang and Kohler, 2008, p. 6). In 2011 the Building Performance Institute of Europe also commented on the scale and importance of the task of refurbishment of older buildings; ‘the most significant challenge in exploiting the energy saving potential within cities lies in the systematic renovation of older stock’ (BPIE, 2011). Ravetz argues, in the UK context, that ‘the energy performance of much of this [older] stock is generally low, while its economic, social and cultural values are often high’ (Ravetz, 2009, p. 4462). The economic value of older stock is also discussed in Chapter 3. Hassler describes older buildings as ‘goods with long-term usefulness’ (Hassler, 2009, p. 562), with incentives needed that discourage constant flux (often driven by changes to property ownership) (ibid. pp. 563–564). Stocks, she argues, are ‘complex resources and not simply financial assets; a long-term ‘resource-preserving approach’ and a ‘change of course back to repairable and long-term, stable systems’ is now required (ibid. p. 565). Kostourou and Pssara also stress the importance of adaptation and incremental development (which aids lifespan extension and slows development pace) and define a sustainable building as not necessarily one that lasts forever, ‘but rather one that extends its life capacity and avoids obsolescence or demolition while accepting changes’ (Kostourou and Pssara, 2017, p. 73–75).
As well as enabling spatial patterns of change and energy and waste flows to be tracked, to be tracked spatial typology data combined with spatial demolition data are also important in identifying locations where a conscious choice of removal is being made over building life extension (Huuhka and Lahdensivu, 2014), and allowing more detailed investigations of where specific typologies are vulnerable and why. Huuhka and Lahdensivu, who have undertaken extensive work on demolition in Finland, argue that buildings ‘are not natural creatures, they do not die naturally. Well-built and regularly maintained buildings could last virtually forever’ (ibid., p. 1). (Evidence of building longevity can be found in UNESCO’s World Heritage Site list which includes examples of buildings surviving well over a millennia, and of fully functioning urban areas over 500 years old (UNESCO, 2021). ) Most buildings are not demolished because they are old or decayed (Kohler and Hassler, 2002). This has been proven by a higher rate of demolition for non-domestic than domestic buildings, which cannot be explained by structural reasons alone (Bradley and Kohler, 2007). Reasons for the conscious shortening of building lifespans are complex and may include the need to maximise financial returns from rent and sales (Liu et al., 2014); difficulty in sourcing replacement components thus limiting long-term maintenance (Kohler and Hassler, 2002); constrained spatial limits in cities as saturation occurs (Aksözen et al., 2017); social reform and health policies (Power and Mumford, 1999; Yelling, 1986; Jacobs, 1961; Medhurst and Parry Lewis, 1969); and population decrease and deindustrialisation (Power, and Mumford, 1999; Thomsen et al., 2011a). Thomsen et al. describe demolition as ‘the most visible aspect’ of the ‘profound social process’ of industrial transformation, economic decline, property over-production and demographic change occurring in a country (Thomsen et al., 2011a). Reasons for lack of spatial tracking of demolition and lifespan shortening include: the construction industry’s focus on the initial construction phase (Kohler et al., 2009); the minor role and cost of demolition compared to construction costs as a whole (Thomsen and Van der Flier, 2009); lack of policy incentives to track loss, analyse survival rates and promote reuse; short-term planning horizons; and a long-held view of the stock as a resource for profit, rather than as an asset and reserve with significant embedded value (Hassler 2009; Abramason, 2016). Thomsen and Van der Flier’s conceptual model of obsolescence is a useful tool for understanding the processes leading to demolition (Thomsen and Van der Flier, 2011b).
Within the historic environment and conservation sector, the principle of building lifespan extension, and resource conservation, has been actively and systematically advanced for many years; in the case of the UK for well over a century (Delafons, 1997). Here the interdependence of parts within the stock as a system, the long-term knock-on effects of rapid change, and the need for long-term planning horizons, avoidance of finite resource depletion, tracking of survival, mortality and extinction rates, and the promotion of incremental adaptation to maintain and create diverse, sustainable and resilient systems, are all well understood. However despite this sector being in the vanguard of sustainable stock development, the vast knowledge base held within still remains little exploited by the scientific community (Hudson, 2016). Awareness of the need to capture data on the evolution of stocks and the way areas develop, and typologies mutate, over time, is however now beginning to change the research landscape, with a spotlight likely to be increasingly placed on historic environment sector knowledge in coming years. At the same time interest in a more rigorous, scientific approach to data curation, collection and analysis, as long championed within urban morphology, is also growing within the sector itself (National Trust for Historic Preservation, 2014). Mechanisms to support the historic environment sector in adding and checking data, as well as encouraging download and analysis, therefore need to be built into open dat platforms in older harness knowledge particularly on composition, operation in terms of how well buildings work in local areas for communities, and dynamic behaviour. Owing to relevance of the sector’s input to so many data areas specific attention to the needs of this sector need to be made.
Opportunities also exist to tap into knowledge of building age in architecture, with interest in refurbishment of urban stocks, (rather than the previous focus on new build) now growing. In 2020 Oliver Wainwright, writing on architect-driven initiatives in the Netherlands tracking material reserves, posed the question, ‘What if every existing building had to be preserved, adapted and reused, and new buildings could only use what materials were already available? Could we continue to make and remake our cities out of what is already there?’ (Wainwright, 2020). In 2016 Daniel Abramson, in his book Obsolescence, explored the economic drivers in the US behind the promotion of building obsolescence from the 1920s, and the idea that new buildings will always outperform old (Abramson, 2016). In Buildings Must Die, published in 2014, Cairns and Jacobs address why building mortality and decay have been so little explored in architecture (Cairns and Jacobs, 2014), citing Kevin Lynch’s argument, from 1960, that future remodelling, demolition or dismantling of buildings should always be considered at the building design stage (ibid.). Stewart Brand, in How Buildings Learn, in fact argued, in the 1990s, that architecture should be rebranded as ‘the design-science of the life of buildings’ with reuse placed at the forefront of its work (Brand, p. 210). He described the benefits of incremental, extension and adaptation, and of the process of trial-and-error in building, stating that ‘slow is healthy’ (ibid.). Brand believed that ‘designers should study the present the way historians study the past- diachronically, in terms of changes over time’. (ibid., 1994, p. 210). He also called for much greater discussion of building vulnerability, mortality and failure. ‘We need failure analysis that is systemic over the full scope of building-related activities and the entire life of buildings’ (ibid., p. 214). The need for a wider discussion of failure was also raised by Stephen Groak, who in 1990 described an ‘epidemic’ of building failure ‘in the past 30 or so years’ (Groák, 1990, p. 163). Longevity, reuse and adaptability were also all advocated in the 1960s by William Howell. In his review, in 1967, of Jane Jacob’s RIBA lecture of the same year, he stated, ‘We cannot afford the waste of national resources involved in knocking down buildings with good life in them and which in any case may be housing social and economic activities which would not survive transplantation…we are never in our foreseeable economic future going to be able to afford to treat buildings like Kleenex’ (HKPA, 2016).
Opportunities now exist to harness knowledge held within the historic environment sector, and the construction industry, (and the growing interest of the former in data analytics, and of the latter in building reuse), to bring together knowledge from science, humanities and the arts to support the development of open building attribute data platforms. This requires partnerships to be developed across sectors and for features to be specifically designed to support sector engagement as tested in Chapter 9.
1.4 Summary of building attribute datasets identified to be of relevance in sustainability research on building stocks
To quantify, model and analyse the sustainability of stocks, as described above, data on the history, location, physical characteristics and dynamic behaviour of buildings is therefore required. These are needed to allow information on the past and present to be linked to create knowledge of the current operation of stocks, and how they could develop in future. Basic questions can also be asked, such as, ‘How many buildings of what type, use, age and size are located where?’; ‘Do some types perform better, and last longer, than others? If so why? Is this the same across cities and countries?’; ‘Which buildings need to be retrofitted where?’; ‘‘How fast are different types of building being lost/replaced and why? What is the impact of this in socio-cultural, economic and environmental terms?’ and ‘Which types of building work best in cities and should be retained, adapted and refurbished for use by future generations?’ Specific kinds of information required to answer these questions include data relating to location (addresses, coordinate and footprint data); land use; building age; typology (including 3D form and geometric relationship with other buildings); size (including volume, floor area and storeys); materials and construction; performance; protection; construction and demolition rates (to calculate current churn); and historical constructions and demolitions (to calculate lifespans and survival rates). These are each discussed in detail in the context of London in Chapter 5. 100% data coverage is also a priority as small samples cannot sufficiently represent the amount of variation found in stocks (Steadman et al., 2020). Of all current building attribute types, building age data are considered the most likely to grow in value over the coming years, as the scale of applications become more widely understood (Hudson, 2010; 2015; 2016; Roumpani et al., 2018). Examples of these are discussed briefly below.
In 2013, Tooke et al. developed algorithms to explore the relationship of age to roof complexity, shape and slope, wall area, building volume, and height, in their study of Vancouver, within which reference was also made to difficulties and costs of accessing property tax data (Tooke et al. 2013). Buildings were found to have increased in height and size during the 20th century, while roof complexity and steepness of slope decreased. Age was concluded to be a good predictor of these attributes as well as of insulation, glazing, ventilation and construction materials. In 2018 machine learning approaches were used by Rosser et al. in a UK study which used fifteen attributes, including footprint area, shape and perimeter, height and roof slope, to predict five generalised age bands Rosser, 2019. Like Tooke, Rosser found that building age closely correlated with building size and roof pitch, with level of footprint complexity also significant. The authors called for more accurate training data to be made available to support machine-learning approaches. The importance of building age data has also been recorded in other energy related studies (Mavrogianni et al., 2012; Evans et al., 2017; Aksözen et al., 2015).
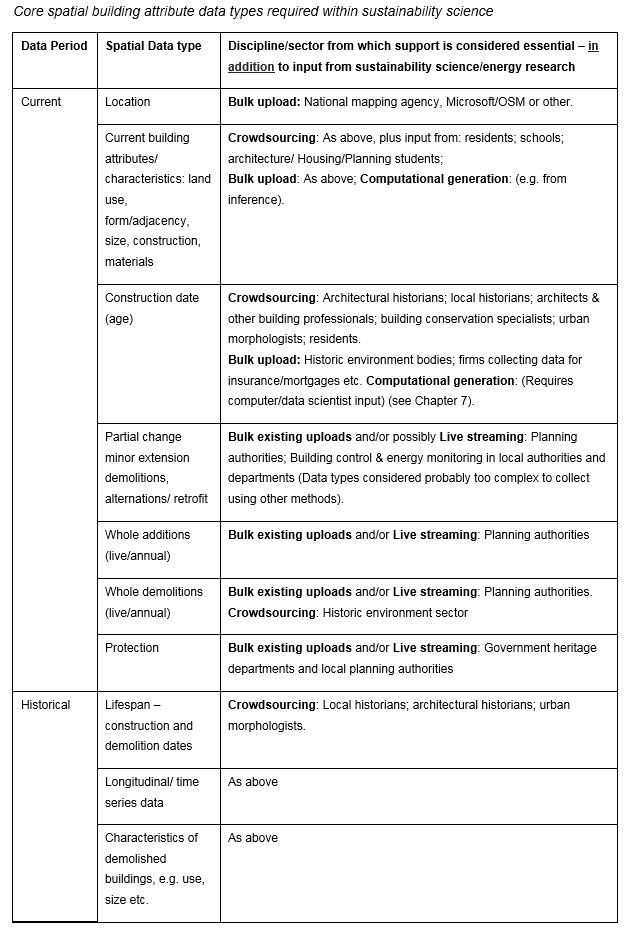
Age data are also relevant to the prediction of internal plan layouts (Brown and Steadman, 1987) and of health risks associated with construction types, for example material toxicity, acoustic quality and steepness of stairs (Haaselaar, 2009); and to building size, with for example taller buildings having an increased risk of occupant death from cardiac arrest on upper floors (Drennan et al., 2016). In addition, age data can be used to geolocate typologies to increase efficiency in targeting appropriate retrofit measures. In Chapter 3, the potential of age data as an indicator for stock resilience is also discussed, and in Chapter 4, their importance in the generation of 3D procedural models. Age data are also necessary for building lifespan and life expectancy calculations for the current stock, as discussed in section 2.5 below. Open building attribute data platforms will now need to develop new methods of generating high quality, accurate, comprehensive age and dynamics datasets, and of engaging historians, and others with expert knowledge of age, in this process. Table 3.1 forms a first step in the process of building a detailed picture of data types needing to be released by open building attribute platforms. This is then expanded in Chapters 3-5. Each type listed within the table is then expanded on
1.5 Types of Dynamics data required
Once data on current stock composition are made available, three types of spatial data are required to keep attribute datasets updated and to track change going forward.
1.5.1 Current planning status including designation
The last spatial data type identified as necessary for collection within the ‘current’ section of Table 3.1, relates to information on building designation and protection. These are needed to understand the location of buildings and typologies, and areas, where the speed of change is being slowed artificially; where building lifespans are being extended indefinitely; and where specific
3.5.2 New build
The first relates to information on new build. This data type is necessary to understand the scale of, and geolocation and form of, new additions to the stock; to calculate rates of growth, churn and shrinkage in cities, and to track the impact and performance of new types of construction and materials over time. In most European countries non-spatial data on new constructions for dwellings are available as they are needed to measure and track housing supply (Thomsen et al., 2009). However spatial statistics on the location and characteristics of new buildings in the domestic, and particularly the non-domestic stock (Bradley and Kohler, 2007; Meijer et al., 2009) are hard to find. Though assessment has been limited in this study, it appears that real-time mapping of new build insertions, within centralised planning platforms, though seemingly obvious, is not common, an issue further discussed in the context of London in Chapter 5.
1.5.3 Current demolitions
The second type of data required to track spatial change in current stocks is spatial demolition data. Demolition data, as noted above, are required to quantify loss and are essential to keep databases on stock characteristics up-to-date. Though non-spatial data on annual dwelling demolitions are, like new build, commonly available in Europe owing to their importance to governments in terms of understanding housing supply (Thomsen et al., 2009), spatial demolition data, for reasons described above are not. Finland is the only country known to capture spatial demolition data, annually, for all buildings (Huuhka and Lahdensivu, 2014). In the UK, research undertaken by Kimon Krenz since 2018 has tested the use of OSMM identifiers (TOIDs) as potential trackers of demolition (Krenz, 2021 forthcoming) (as further discussed in Chapter 5). Spatial demolition data also need, as is done in Finland, to be linked to current building attribute datasets, so that characteristics of demolished buildings can be understood, and detailed patterns of mortality and survival analysed. Methods of spatially recording demolition within a prototype open data platform, to build an up-to-date, rounded picture of change and loss, and to facilitate updating, therefore also need to be tested.
1.5.4 Adaptation
The most complicated type of current building attribute data to collect relate small-scale additions and demolitions, and to retrofit. Minor alterations will commonly occur during a building’s lifetime, caused by incremental adaptation and maintenance. This process enables a building to remain fit for purpose and to lengthen its life. It can, however, generate considerable waste flows which Thomsen et al. observe are rarely recorded and that may, for buildings with long lifespans, exceed waste from whole-building demolition (Thomsen et al., 2011a). These types of data are however complex to collect, generate and visualise owing to the fact that individual differences between each building need to be captured at building level, for the city as a whole. Problems relating to the capture of spatial information on incremental change are further discussed in Chapter 4. However, it is considered that the use of Artificial Intelligence to restructure and simplify planning data; the future introduction of certificates showing retrofit status, and the development of 3D rule-based models for cities (also discussed in Chapter 4), will all be required to address this issue.
1.5.5 Lifespan data
Building lifespan data, as described earlier in the chapter, are necessary to understand rates and scales of energy and waste flows; rates of building mortality and survival; life expectancy; and potential vulnerability or resilience. Lifespan data relating to specific locations can also assist in the identification of spatial patterns of change, and cycles, occurring in cities across time (as described in Chapter 7). Where data on the form, size and use of demolished buildings is also available, resilience, vulnerability and persistence of specific types of form may be spatially tracked.
Lifespan data are relevant to many other applications including building lifecycle assessment and costing, estimation of service-life of individual components, building maintenance and refurbishment planning, and stock valuation (Aksözen et al., 2017). In addition, they are important to understand hierarchies of change within the urban fabric, as discussed in Chapter 4. The lifecycle of a building comprises five stages and processes: construction, use, obsolescence, decay and demolition (Larkham, 1996), though obsolescence may lead directly to demolition without decay (Abramson, 2016; Thomsen and van der Flier, 2011b). To measure building lifespans, data on the beginning and end of a building’s lifecycle is required – i.e. its date of construction and of demolition. To accurately estimate average lifespans, and survival rates, for age cohorts, historical demolition and construction dates are needed for as many buildings in each cohort as possible.
Owing to the extent of fragmentation of information on historical constructions and demolitions, and the fact that this will often be embedded within difficult to access images and texts, comprehensive data of this type, even for a single age cohort in a stock will rarely be available. If data are available, these are likely to be for very new cities only. The more mature the city the more archive information will need to be relied on. Measuring and monitoring industrial flows caused by demolitions and constructions has long been acknowledged to require ‘enormous amounts of data which are costly to collect’ (Hond, 2000, p. 64). Krausmann et al. note that though economy-wide material flow assessments have been compiled for historical periods for a number of countries, very few cover more than several years or decades, or include periods before 1970, as ‘time series data for the material extraction during earlier periods of industrial development is scarce’ (Krausmann et al., 2009, p. 2697). Hassler comments on how, ‘Often surviving individual buildings are badly documented (including the buildings which have disappeared and why they have disappeared’ (Kohler and Hassler, 2002, p. 230). Huuhka and Lahdensivu agree, noting that data on lifespans, age and demolition rates are often assumed in dynamics modelling, ‘because there is lack of data on real lifetimes and demolition times’ (Huuhka and Lahdensivu, 2014, p. 3). Lack of demand for accurate lifespan data, until recently, will also have played a part.
However increasing accuracy in, and availability of lifespan data is now urgently needed for urban metabolism and mortality studies. In metabolism models even small differences in projected lifespan/survival can result in very different estimations of rates of energy and carbon flows (Meijer et al., 2009). Inaccuracies will also impact on calculations relating to resilience and vulnerability of specific building types. Liu’s work in China has shown discrepancies between the average service life of buildings, (the length of time a building performs as intended), estimated to be fifty years, and actual lifespans, which are closer to thirty (Liu et al., 2014). O’Conner states that buildings will often be demolished well before the end of their useful life (O’Connor, 2004), and Aksözen et al. that realistic models must now be underpinned with a detailed understanding of building mortality (Aksözen et al., 2016; 2017).
‘Service life’ is one a number of descriptors commonly used within the development industry, which are summarised in Appendix 3 and which also include definitions of the ‘economic life’, and ‘technological life’ of a building. These relate to the length of time a building is considered to be useful judged against specific criteria, not to how long it could or will actually last. The calculation of ‘service lifespans’, is closely related to lifecycle assessments, which are used to assess and maximise a new building’s long-term environmental performance, for its entire service life (Sharma et al., 2011). More realistic estimates have also been called for from those working in this field, with a lack of literature available on expected service life also commented on (Akhtar, 2018; Straub, 2015). Lifecycle data, derived from samples of structural systems, are described as a second choice compared to more precise real-life data (Davies and Wyatt, 2004). Absence of longitudinal data required to improve accuracy has also been noted (Straub, 2015).
At present large-scale models exploring stock dynamics and material flows commonly use assumed lifespans and demolition rates, rather than use actual data, owing to the difficulty in accessing this information (Huukha and Lahedensivu, 2014). Miatto et al. describe four methods of modelling change within stocks (top-down, bottom-up, demand driven and satellite imagery led), and how certain models are highly sensitive to changes in length of average building lifespan (Miatto et al., 2017). Aksözen et al., summarise six methods used in lifespan data generation which range from the use of archive data (rare), and expert judgement for specific typologies, to these ‘very simplified predictions based on generally available data, typically lifespans derived from the average demolition frequency’ (Aksözen et al., 2017, p. 260). In models based on assumed demolition rates a typical calculation would be as follows: If the total number of buildings in an observed stock or cohort is 50,000, and 2% of these (i.e. 1,000 buildings) are estimated to be demolished every year, the maximum lifespan (and life expectancy) of each building would be calculated as 50 years. If, instead, 0.1% buildings were demolished (i.e. at a roughly similar rate to mature cities of Europe) (Thomsen et al., 2009), lifespan/maximum life expectancy would be 1,000 years.
A major problem with this approach, as well as the fact that location is not taken into consideration, is that newer buildings are assumed to last longer than old. This assumption is however ‘falsified by longitudinal evidence (Aksözen et al., 2017, p. 260), as shown by many studies (Hassler, 2009; Huuhka and Lahdensivu, 2014; Miekle and Connaughton, 1994; Liu et al., 2014). Acceptance of the inadequacy of the assumed lifespan approach comes from those who consider estimates too long, as well as from those who consider them possibly too short. James Meikle and John Connaughton argue that the idea of buildings lasting up to 1,000 years is ‘well out of line with conventional notions of the durability of buildings’ (Miekle and Connaughton, 1994, p. 317). Boardman et al. also state this to be ‘clearly an unrealistic scenario’ (Boardman et al., 2005, p. 40), however Huuhka and Lahdensivu argue that buildings, if well built, have the capacity to last forever.
Methods of improving models that rely on lifespan data are now being tested. Yang and Kohler’s study into integrated lifecycle assessment models, designed to predict energy and material flows for Chinese stock and infrastructure (Yang and Kohler, 2008), use, for example, a top-down approach which employs macro-economic statistical data and combines this with historical data. Here the evolution of the stock from 1949 was first studied. From this, lifecycle reference data were produced for a relatively small number of buildings and infrastructure classes, relating to a specific period of rapid urbanisation (1978 to 2005). These were then applied to the entire stock and projections made for the behaviour of different age cohorts between 2005 and 2050.
In Reyna and Chester’s study of Los Angeles a ‘generalizable framework for estimating construction and deconstruction rates’ was produced (Reyna and Chester’s 2015, p. 524). Here, ‘emerging “big data” sources’ were instead relied on (ibid., p. 526). These included property tax data from which baseline construction year, typology descriptions, approximate sizes and materials were determined. Historical constructions and demolitions were then derived from historical census data (as used in UK housing survival analysis up until the 1990s). Using this source, changes to the proportion of dwellings during each decade for over a century were estimated (ibid.), and to the distribution of age, typologies and materials, with the size of flows of energy and material waste then calculated
The most detailed lifespan studies have been carried out in Japan and Switzerland and are heavily reliant on archive data. Tanikawa and Hashimoto’s 4D models are used to analyse material flows not only from the stock, but from underground infrastructure, and to assess demolition rates and lifespans for different building types, over more than a century (Tanikawa and Hashimoto, 2009). Here access to historical maps and images, and to longitudinal data was critical.
The largest and most detailed survival and mortality study for a city, an animation from which was illustrated in Figure 1.x, was published in 2016 and 2017 (Aksözen et al., 2016; 2017). This applied methods used in medicine to analyse patient survival, to examine lifespans and survival in Zurich’s building stock, and also relied on longitudinal data. Problems with data collection, and the way in which the unique database was painstakingly pieced together from fragmented historical datasets are described (Aksözen et al., 2017). The authors explain this approach to mortality analysis as ‘a relatively new method that could only develop when longitudinal data were available. These data were only partially available in cadastre, public construction statistics, fire insurance etc. The necessary time span of at least 100 years was rarely available’ (ibid, 2017, p. 275).
1.5.6 Accelerating new approaches to lifespan data generation
Owing to the time consuming nature of capturing lifespan data using historical sources (discussed in Chapter 4, 5 and 7) new more efficient methods now need to be developed. Computer Vision, referred to in section 2.5.3, offers enormous potential in this area in relation to large-scale footprint extraction from historical maps. Map also provide the most accessible source from which lifespan and survival data can be generated. Historical footprints, owing to their spatial component, can also offer insights into other (demolished) building characteristics such as size, shape, use and 3D form. These can in turn provide spatial snapshots of change to stocks over time, and are extremely important in longitudinal studies. To extract data from maps they must first be accessed from archives, scanned and then vectorised. Manual vectorisation, as illustrated in Chapter 7, is extremely time-consuming and is only suitable for small geographic areas. Testing of footprint extraction using machine learning has been undertaken by, for example, Robert Hecht and Henrick Herold, and in the UK by James Crone at EDINA, Christopher Dibben and Jaimie Pearce at the University of Edinburgh (Crone, 2016), and Marguerite le Riche at Registers of Scotland (RoS) (Historic Environment Scotland House Age Project) (Le Riche, n.d). Related work, coordinated by the author, in collaboration with the Alan Turing Institute and the National Library of Scotland is discussed in Chapter 5. It is also understood that the Swedish National Data Service is planning to release vectorised time series data from historical maps dating from the 1960s.
Though the extraction and open release of footprints derived from historical maps is extremely important, maps cannot provide precise lifespan data (though if map intervals are close enough as in the case of the UK’s OS historical maps they will give a good indication). Open building attribute platforms offer opportunities to improve lifespan data quality and precision by providing historic environment specialists with a canvas to colour in using their expert knowledge. The development of these methods are described in Chapter 8. In the global context, extensive historical records on the evolution of stocks will not necessarily be available. In Chapter 7 the use of age, and age diversity, as a proxy for lifespan, is also explored.
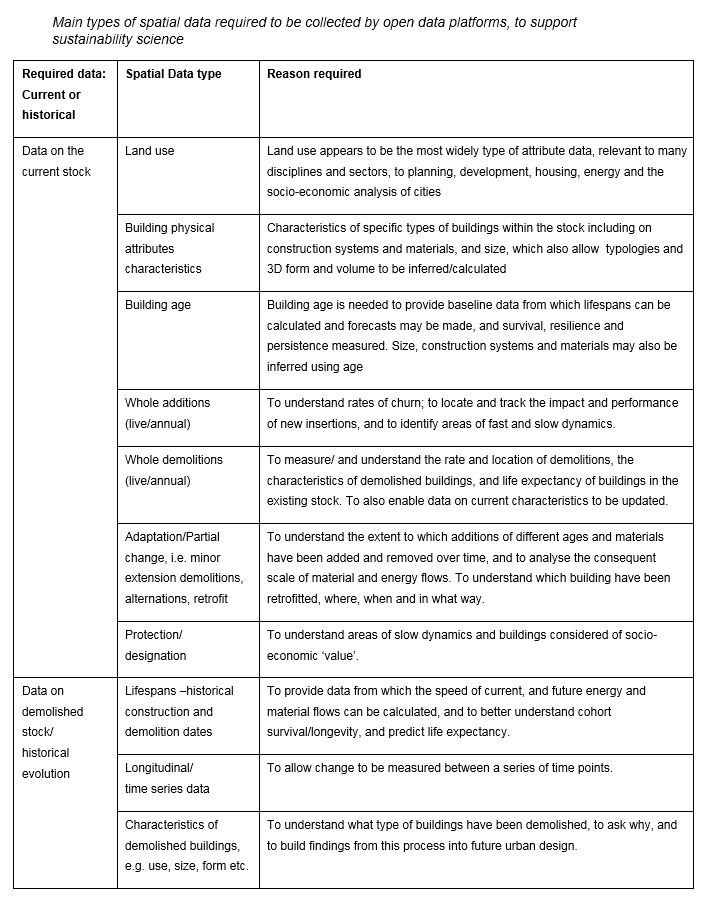
1.6 Summary of data required for collection and relevant methods and sources
This chapter concludes with Table 3.2 (adapted from Table 3.1), which begins to map out ways in which disciplines and sectors discussed above could potentially support and help maintain platforms of multidisciplinary relevance. Three methods of data capture are also summarised: existing bulk dataset upload; computational generation; and crowdsourcing. These methods are described further in subsequent chapters. Live streaming is also considered as part of a second development stage.