H. PROTOTYPE history and influences - colouring-cities/manual GitHub Wiki
Under construction
Introduction
Research into the Colouring London concept and prototype was initially undertaken by Polly Hudson, between 2014 and 2019, at The Centre for Advanced Spatial Analysis (CASA) University College London (UCL), and has, since 2020, continued at the Alan Turing Institute. Colouring London builds on Hudson's design for free local centres, combining digital and physical resources, able to support multidisciplinary knowledge on building stocks. The model, built tested at the Building Exploratory charitable Trust London between 1996 and 2001, was developed in collaboration academia, government, the third sector, industry, and over 700 local residents.
For further information on specific aspects of Colouring London's development history please see links below.
- Section X01: References
- Section X02: Consultees & contributors
- Section X03: Open data assessment for London UK, 2021
- Section X04: Reasons for choice of London
- Section X05: The Building Exploratory model
- Section X06: Literature review:-Data-needs-in-context-of-sustainability-science
- Section X07: Data needs in urban resilience and complexity science context
- Section X08: Dynamics data capture and urban morphology
- Section X09: Testing open bulk upload cleaning
- Section X10: Testing manual data capture
- Section X11: Testing automated data capture and extraction
- Section X12: Testing-live-streaming-of-planning-data-(2022)
- Section X13: Links-to-relevant-property-tax-visualisations-&-GIS-platforms
- Section X14: Conceptual-age-simulation-model.
Information contained in these sections comes from Polly Hudson's unpublished doctoral research, funded by CASA and the Engineering and Physical Sciences Research Council (EPSRC) and an EPSRC/UCL Innovation and Enterprise Impact Acceleration award. Colouring London's technical development has been overseen since 2016 by Tom Russell (University of Oxford) with strategic support provided by Dr Falli Palaiologou (UCL/Loughborough University) since 2017. For information on the Colouring London/Colouring Britain's current team aplease see the Colouring Britain/Colouring London page:
Key Influences
In this section, a summary is given of the following key influences on the Colouring Cities Research Programme and on the design of the prototype platform, Colouring London.
- a) The Building Exploratory - an action research, collaborative development model for local physical/digital open knowledge repositories about building stocks;
- b) Geographic Information Systems and their use in the visualisation, collation and analysis of digitised spatial data;
- c) Physical and digital urban maps coloured at the microscale,
- d) Conservation movement principles of reuse and adaptation;
- e) The classification and visualisation of historical spatial data in selected urban morphology studies;
- f) The United Nation's The New Urban Agenda, and the United Nations' Sustainability Development Goals;
- g) Selected scientific studies on energy use, resilience and diversity studies;
- h) The work of Jane Jacobs, the role of age data, time series data, and the importance of collecting data at the microscale;
- i) Principles of industrial ecology and selected studies;
- j) Selected studies in urban complexity science, and the use of computational approaches combined with historical data to identify underlying rules of behaviour within, dynamic, urban systems, particularly the work of Mike Batty and Kiril Stanilov;
- k) The open knowledge movement and examples of successful, collaboratively maintained open data platforms, open-source code repositories, and crowdsourcing;
- l) The potential of AI and machine learning and their potential to create a step change in the volume of data availability through inference, and to rapidly identify patterns and locked in cycles that may facilitate or inhibit sustainable development
- m) Collaborator consultation.
Action research context and the Building Exploratory model for open knowledge repositories on stocks
The Colouring Cities Research Programme is an action research initiative, in which the prototype open platform, Colouring London, and CCRP manual, are developed live. Action research, is classified as any research into practice, undertaken by those involved in that practice, where the primary goal is to encourage continued reflection and questioning. Traditional research 'emphasizes the review of prior research, rigorous control of the research design, and generalizable and preferably statistically significant results, all of which help examine the theoretical significance of the issue. Action research, with its emphasis on the insider’s perspective and the practical significance of a current issue, may instead allow less representative sampling, looser procedures, and the presentation of raw data and statistically insignificant results'. (https://jalt-publications.org/node/4985/articles/5631-linking-research-action-simple-guide-writing-action-research-report). Action research provides the theoretical framework for the CCRP and offers the opportunity to develop open mapping platforms on building stocks through an iterative process of design that allows for continual, incremental improvements developed as a result of live testing and critical reflection.
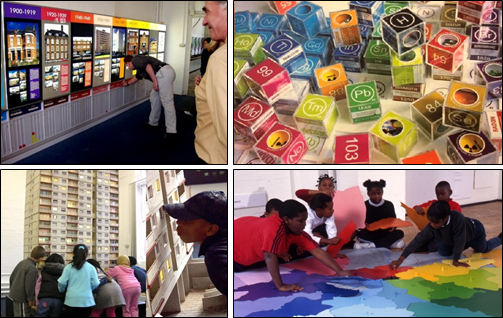
The Colouring London prototype and the Colouring Cities Research Programme draw heavily from iterative methods applied in the development of The Building Exploratory charitable trust, a prototype for free, multidisciplinary, local knowledge sharing centres about the built environment, set-up and tested in London between 1996 and 2001. The Exploratory, like the CCRP, was designed to bring together bottom up and top down knowledge to produce a permanent public resource about the built environment, able to be adapted and improved over time. Its foundations in terms of content, like the CCRPs, was based on the integration geospatial data about buildings and the built environment as a whole, at both the micro and macroscale to improve its quality and related decision making. It was built in collaboration with stakeholders in academia, industry, government and the third sector, over six years, and with local community groups of diverse ages, skills and abilities. Its live, experimental, interactive, exhibition also synthesised learning from across the arts and humanities, science and technology. Sections of the resource were built and funded as discrete knowledge sharing projects involving residents, artists and other stakeholders designed to develop confidence and skills, as and when funding pots became available. Once completed exhibits/teaching tools were immediately absorbed into the core structure and used as free teaching/information tools that also celebrate collected knowledge, and local creativity and innovation. Over time these were tweaked and joined to build a comprehensive picture of the composition, operation and dynamic behaviour of the local area, and to provoke discussion and action to improve building quality and sustainability. The CCRP builds on this work and on the Building Exploratory's ethos of inclusivity, aided by its use of colour, and promotes the importance of finding win-win scenarios for built environment stakeholders that demonstrate the value of sharing knowledge for the public good.
The Colouring Cities Research Programme, like the Building Exploratory, has been designed as an experimental, agile, non-profit initiative, offering a free, reproducible, low maintenance knowledge sharing repository intended to improve the quality and sustainability of stocks for the public good. It was also designed to be permanent, flexible, transparent, multidimensional, collaborative, efficient, constantly evolving, relevant to multiple sectors, and capable of being funded though diverse funding sources. The Exploratory differs from the CCRP as a knowledge repository model, in that it combined both physical and digital exhibits, and was developed as a community arts/education project rather than an academic research programme. Development methods were also not able to be systematically recorded and evaluated during he Exploratory's development. Many of the photographs taken to record the process of exhibit and exhibition construction were lost between 2001 and 2019. As a result knowledge wastage was significant. Learning from this the CCRP documents methods, code and results as carefully as possible, releasing information as openly and rapidly as possible. CCRP prototype platform feature design briefs and open-source code have been released on GitHub since 2016, with the interface developed live since 2018, and manual developed live since 2021. This ensure that as much relevant information on prototype development and CCRP governance and funding is made available to CCRP partners, and other interested parties, to maximise the potential of the concept and code to be tested, reproduced and improved on by others for the public good.
The Building Exploratory's physical exhibition was accompanied by a range of types of digital data visualisation including a public Geographic Information System (GIS). The interface for this, created between 1998 and 1999, was designed by Polly Hudson (the Building Exploratory's founder) and built by the London Borough of Hackney. This represents the first iteration of Colouring London. It was funded by a housing ministry grant, and used Ordnance Survey (national mapping) footprints to allow users type in their address and zoom down onto their homes, view aerial imagery and layer colour coded maps providing current and historical data on stocks for the first time. It also included a feature that allowed streetview images to be accessed on highlighted sites. The platform was however not able to be accessed via the internet owing to Ordnance Survey mapping data restrictions. In 2016 restrictions to footprints were still in place. A key step in Colouring London prototype platform design and set-up has therefore been to access these footprints, as discussed further below.
Key findings from The Building Exploratory (1998- 2001), built on by the CCRP, include that:
-
free, inclusive repositories for knowledge on buildings stocks, accessible to multiple audiences and allowing information and data to be gathered and shared overtime were of relevance to multiple sectors, are required and can be built relatively easily and maintained at low cost. Such repositories offer exceptional value for money owing to their relevance to, and ability to extract and collate knowledge from, a wide range of stakeholders: from citizens and schools to central and local government departments responsible for housing, planning, conservation, environment, regeneration, education (primary, secondary and higher); housing providers; construction, development and property management/financing firms; regeneration initiatives; heritage organisations; national museums and universities and learned societies, and academic departments;
-
to maximise relevance, open repositories must be developed incrementally, through an iterative process, providing a broad enough framework able to incorporate known and unknown components and allowing for component parts, worked on in detail with citizens and specialist stakeholders to be brought together. Repositories need to, and can easily, integrate knowledge from science, technology, humanities and the arts, and collate information on evolution, current composition, and quality of stocks, to improve forecasting and planning for the future and better understand the relationship of urban form on socio, economic and environmental performance.
-
citizens are interested in data on their homes and other buildings they know. These act as simple hooks onto which information on multiple subject areas can be attached by layering spatial data. To maximise citizen interest in accessing and adding information, maps illustrating these buildings are vital. Citizens also hold unique, and when combined, vast body of knowledge on the quality of specific buildings and urban areas which is rarely tapped. However working with community planning groups and historic environment specialists offers the most rapid cost efficient route to knowledge/information on stock composition, dynamics and quality and on the impact of change at local level. This route however remains only partially exploited/recorded. The historic environment sector is also exceptionally advanced in the provision of free resources about buildings and their adaptation and reuse. Built environment professionals and academic departments related to geography and the built environment (staff and students) also offer rich sources of information.
-
incremental development using iterative processes is key to creating system resilience. Component parts of knowledge repositories can be funded, built and tested independently, over time and fitted together in such a way as to allow for continuous enrichment of the knowledge system as a whole. Efficient, sustainable knowledge repositories require both robust and sustainable governance models, and must record and publish information on ther development, live where possible, to prevent knowledge loss.
-
visualisation and colour is critical in digital data platforms to maximise accessibility and inclusivity and in doing so capture necessary diverse type of data, information and knowledge
-
accessibility, openness and trustworthiness of knowledge repositories, and of repository governance, if repositories are to engage stakeholders in maximising repository quality, efficiency and effectiveness and in sharing responsibilities for long-term management and maintenance.

Geographic Information Systems and their use in the visualisation, collation and analysis of digitised spatial data
Geographic Information Systems (GIS) already provide well tested models for highly efficient spatial data repositories able to layer, visualise and analyse spatial data to support decision making. Spatial data visualisation (as demonstrated from 2004 by Google maps) is also critical to driving information and data exchange across diverse audiences. In the image below, various socio-economic datasets for London, are shown using GIS, alongside protected building data. The comparison quickly prompts questions on why areas of good health, high qualification and high price today appear to have a correlation with 1900 and what that means for social equity, which within NUA is a key component for sustainable cities. Integrated, platforms, visualising spatial data on cities, offer opportunities for both humans and machines to not only access, add and check data but to also to provide insights into patterns within the data to help unpick the complexity of urban systems.
Recognition of the power of overlaying discrete digital layers of spatially located data was largely driven by the pioneering work of Roger Tomlinson in Canada in the 1960s, today often described as the father of GIS. Though major advances were made between 1975 and 1990 as computer memory and graphic capabilities increased, it was not until faster, cheaper more powerful computers emerged from the 1990s that GIS software use became widespread. Today GIS is a standard tools for managing and analysing spatial data relating to the natural and built environment and is used extensively within government, academia and the commercial sector to support data visualisation, collation and analysis. GIS platforms, combine geospatial databases with software tools enabling the capture, collation, visualisation, analysis and dissemination of spatial data at multiple scales. Though GIS software can be described as ‘any software which works with map data’ (OSM wiki ref) a key feature of GIS is its use as a tool to assist decision making. Applications have widened considerably over the past three decades owing to the growth in location enabled services that rely on geospatial visualisation and analysis. Google Maps and OpenStreetMap are examples of globally recognised applications of GIS in the commercial, and open data arena respectively. ArcGIS produced by ESRI is the main proprietary GIS software. Open source GIS software was first made available in 1978, by the U.S. Department of the Interior which created the Map Overlay and Statistical System (MOSS). GRASS. Geotools, Post GIS, Geoserver and QGIS are all examples of an increasing array of open source GIS products available today. Developing an accessible GIS platform and bringing together the technical expertise and funding required also formed a key stage of project development
 https://live.osgeo.org/en/_images/postgis_managerpreview.png
Though innovative applications of GIS have increased through the development of open products, progress has for countries such as the UK has been impeded by government restrictions on national mapping data, and in particular building footprints. Comprehensive building footprints of the highest quality, regularly updated, are essential in the development of the highest quality spatial databases possible on stocks, and are also required to maximise relevance of data to the widest range of audiences and stakeholders possible. s.Critical to any method of generating open knowledge exchange platforms that act as databases and visualisation platforms for microspatial data on building stocks is access to building footprint data. As noted above in the UK this has long impeded progress in the analysis of spatial data relating to the building stock. Building footprints for cities act as the mini filing cabinets critical to the capture, storage and visualisation of data. The open release of property tax and cadastral data has allowed for significant steps to made by countries where footprint data have been released at the same or where national mapping agencies around release these data. Though the global initiative OpenStreetMap (OSM) has in recent years helped drive open building footprint release, national updated mapping agency data providing accurate and comprehensive cover are critical. OSM in its collaboration with Microsoft/Bing’s current application of artificial intelligence to satellite imagery, to generate open footprints, is now providing access to open footprint datasets for the US, Canada, Uganda and Australia (Microsoft, 2019; 2020). The current OSM/Microsoft partnership is important in that it means that building footprint are likely to become increasingly available at global scale whether through microsoft or other sources. Though the quality of these is likely to be much lower than footprint surveyed by national mapping agencies, this forms an extremely important step in the development of global open building attribute databases and knowledge exchange platforms able to show the potential of microspatial building attribute data release in urban problem solving and the importance of their release. Any prototype platform, designed for reproduction by other cities and countries, therefore needs to look to access high quality, updated footprints and to be designed to be interoperable with OSM from the start.
Physical and digital maps of cities, current and historical, coloured at the microscale, and the classification and visualisation of historical spatial data within urban morphology and Industrial ecology;
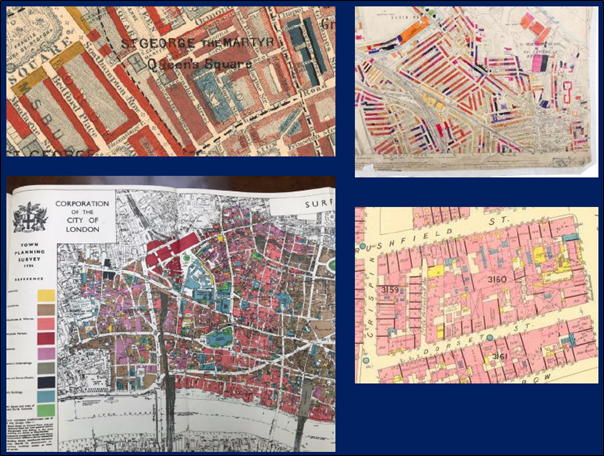
Recognition of the importance of spatial data visualisation in identifying patterns to support decision making is however not new. Between the late 18th and mid 19th century spatial data visualisations were produced in in the US, France and Britain (add refs) to track and predict the spread of disease. During the 19th and 20th centuries cities academic, commercial and government led initiatives in cities such as London (the CCRP's prototype city), resulted in the production of visually stunning, informative colour-coded physical maps of cities, at block, building and sub-building level. The most famous coloured maps created for London include Charles Booth’s late 19th century poverty map showing relative wealth for every streetblock; the highly detailed Charles E. Goad insurance maps of the same period, containing sub-building level information on heights, number of storeys, street width and land use, with construction materials such as brick, glass and wood colour coded; the 1930s maps of the City of London providing information on height, land use and age; and the 1940s London County Council’s Architect’s Department bomb damage maps, designed to aid reconstruction after the World 11. The latter were considered so informative for future enemy targeting that government approval had to be gained at the time for the production of all colour copies. However since this time UK government restrictions on the release by the national mapping agency of comprehensive building footprints has prevented the continuation and development of this tradition in the UK, and innovation relating to this area. The aim of the CCRP programme is to revive this tradition but here to colour-code vectorised footprints for countries as a whole to allow data captured within each footprint to be measured and analysed.
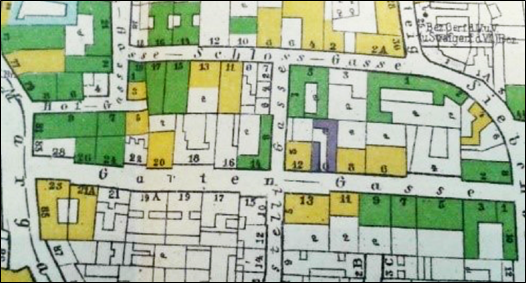
Much significant work into the production of colour-coded microspatial maps visualising physical urban attributes has also occurred within the scientific discipline of urban morphology, and within the practice of historic urban characterisation, related to it. However here both the composition, and the evolution of buildings, plots and streets, are considered. Methods of visualising and recording the composition of and change to the urban fabric at the microlevel were advanced in the early 20th century by early proponents of a rigorous, scientific approach to the study of the built environment (ibid.). These included Walter Geisler, who in 1918 produced colour-coded maps of land use and building storeys for Danzig (Gdansk, Poland), and the geographer Hugo Hassinger, whose 1916 map of Vienna was one of the first to use colour to show the relationship of building age to physical form (ibid.). The British School of urban morphology was spearheaded in Britain by M.R.G Conzen, who in his early career in Germany in the 1930s, mapped building types for twelve towns (Whitehand, 2007). Here different methods of employing colour to map attributes was also experimented with; with for example the number of building storeys mapped by colour depth (ibid.). Key to this process was an understanding within urban morphology that to understand urban areas and their operation you needed to analyse their composition, and to measure change to this composition over time.
Conzen was particularly interested in the repetition and persistence of identifiable urban phenomena, and considered that the logic of urban areas could not be understood simply through a set of aggregated statistics; instead he argued that study of urban areas was required at a range of scales, including at building level. Conzen commented on the ‘crudeness’ with which the evolution of towns was studied in Britain in the mid-20th century, and how geographers ‘took account merely of the broad stages of outward growth and missed the variety of the phenomenon they cover, as well as the significant modern changes inside the street blocks…’ (ibid., 1960, p. 4). He noted the way in which focus was placed on streets and street spaces rather than on the structure of blocks and the form and uses of buildings themselves (ibid.). As well as advancing work into the classification of buildings, and the use of colour, Conzen, in his study of Alnwick, demonstrated through the application of micro-visualisation techniques, how age and form are mixed, over time, to create areas that are ‘strictly unique’ (Conzen, 1960, p. 6). He also revealed – through historical research and meticulous comparison of historical maps – hierarchies and cycles of change, relationships between buildings, plots, blocks and streets, and an underlying logic to the urban fabric. He sought, through the study of processes at different geographic scales and across long periods of time, to generate ‘a theoretical base yielding concepts of general application’ (ibid., p. 3); ‘By investigating a specific case which promises results of general significance and by adopting an evolutionary viewpoint, [the method] seeks to establish some basic concepts applicable to recurrent phenomena in urban morphology’ (ibid., p. 4). The problem for urban morphologist has however been that the amount of time required to apply data to maps has meant that either only small geographic areas are able to be covered, or that attributes are mapped using less granular spatial units.
The CCRP builds on work undertaken within urban morphology in the field of urban dynamics (see Section N) to find methods of accelerating the capture of spatial data on current and historical change by combining crowdsourcing, automated generation using inference, and automated feature extraction from historical maps.
Over the past decade or so important contributions to the development and free dissemination of digital colour-coded maps, at city scale and building level have come from the US, Netherlands and Japan. These include work driven by online developers including Bert Spaan in the Netherlands and Justin Palmer. Thomas Rhiel and Brandon Liu in the US, in visualising building age data from property tax and cadastral databases,which have been increasingly opened up by governments since 2013.

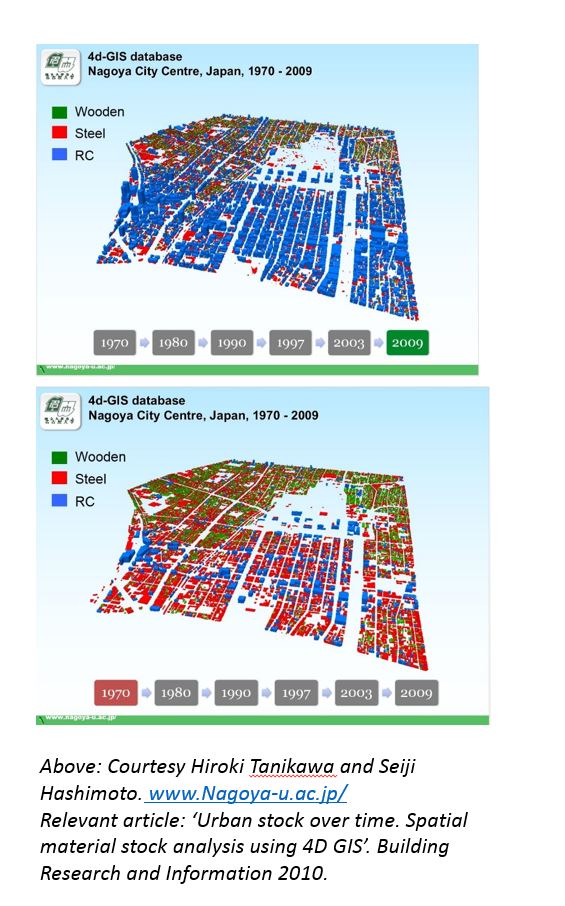
In parallel, the growing need to track energy and waste has led to the innovation by Hiroki Tanilkawa and Seiji Hashimoto in Japan in 3D historical GIS visualisations, used to show change to the material composition of cities, and rates of energy and waste flows over time. Examples of the power of GIS visualisation, and the importance of longitudinal data capture, can also be seen in Hiroki Tanikawa and Seiji Hashimoto’s work in Nagoya Japan illustrated in Figures 0.3. Here visualised data are used in the analysis of energy and waste flows, and to track change over time to material composition and form over four decades.
 Add info
Jane Jacobs and the microscopic view and the value of building age, and time series, data
Resilience is a field of research of increasing interest to many sectors and disciplines, and a core area of study within sustainability science (Hassler and Kohler, 2014). Here, fragilities in systems are assessed as is their capacity to ‘respond, adapt and evolve to different forms of pressure’ (ibid., p. 119). Moffatt, in his work on ecological urban design and long-term energy strategies, views resilience as representing a more sophisticated, dynamic view of the future than sustainability (Moffatt, 2014. Within resilience planning, risks, uncertainty and surprises are assumed, and strategies to address these put in place. Urban resilience is described as the inherent capacity of the built environment, and is related socio-economic system, to maximise the potential of stocks to adapt and recovery from change and loss (ibid.). C.S. Holling’s research into resilience in the context of ecology in the 1970s formed the foundation for much, later, resilience research (Nicol and Knoepfel, 2014). Speed of transformation is viewed here as a critical factor in system optimisation (as also referred to in Chapter 2), with a succession of slow-moving risks and disturbances over long time periods of time seen as more beneficial than fast-moving, extreme, events (Holling, 1973). In his 1973 paper, Resilience and stability of ecological systems, Holling points out that in ecology, important insights can be gained by studying the probability of the permanent loss of elements, and conditions needed for their persistence. He concludes that the recognition of both our ignorance in these areas, and the fact that unexpected events will always occur, are critical for resilience management (ibid.). In the context of urban systems, Moffatt also states that where a system, or a component within it, ‘fails to persist for a “reasonable” length of time or fails to recover losses within a “reasonable” time period then it is neither sustainable nor resilient’ (Moffatt, 2014, p. 202). In this context, demolition, and lifespan shortening, can be reasonably seen to represent the failure of an urban area, urban tissue, building typology or individual building to be sufficiently resilient to absorb specific types of threat or shock. As such demolition can be viewed as an indicator of vulnerability and lack of resilience. Romice and Porta describe resilient built form as having ‘a high capacity to absorb change, to assimilate transitions, without having to renounce what gives them character and structure’ (Romice and Porta, 2015). Longitudinal spatial data for sites able to provide information lifespans and survival rates, as well as capacity life extension through adaptation are therefore extremely important to urban resilience research, and to understanding the impact of loss of specific types of building to the stock as a system. Methods of collecting these data types, along with data on current composition, within open data building attribute platforms therefore need to be a priority. Moffatt argues that the speed at which urban systems change is central to their capacity for adaptability and resilience. He highlights the importance of knowledge, held and remembered, about and within urban systems, and of the slow process of trial and error and of age diversity, ‘It is the mix of elements with differing lifetimes that helps the system as a whole survive the exogenous forces of change. Some species respond quickly to change and shocks, others more slowly… All durable and sustainable systems appear to have this sort of structure; it is what makes them adaptable, robust and resilient..’ (Moffatt, 2014, p. 210). Moffatt also stresses that time (required for the generation of diversity) is a critical parameter in the development of resilient urban systems, and that long-term planning horizons appear ‘to be continuously shrinking’ with shorter building lifespans becoming increasingly common (ibid., p. 209).
Scott Page also comments on the close links between resilience and diversity; ‘diversity and complexity lie at the core of many of the challenges that we currently face, managing ecosystems, organisations and economies’ (Page, 2010, pp. 1–2). As well as enhancing system robustness, both Page and Andy Stirling argue that diversity has the capacity to provide insurance and security, improve productivity, spur innovation, generate collective knowledge and sustain further diversity (Page, 2010, p. 3; Stirling, 2007). For Stirling, like Moffatt, understanding diversity in complex systems requires knowledge of how components combine, for which he argues that data on ‘variety’, ‘balance’ and ‘disparity’, within and across component types, are needed (Stirling, 2007, p. 709); these properties of diversity are set out in Table 4.1. Stirling also highlights how the pooling of diverse ideas can accelerate innovation, and generate robust systems able to sustain themselves if and when component parts fail (ibid.), as also argued by Jane Jacobs, discussed below.
The integration of diversity into system design is also of relevance to open data platforms, to increase their resilience and protect against failure. It also confirms the importance of a multidisciplinary and transdisciplinary, collaborative approach . Romice and Porta argue that resilient places are able to absorb change without having to relinquish their character and structure (Porta and Romice, 2015). Like Moffatt, and Jane Jacobs and Christopher Alexander, discussed below, they conclude that resilience in the urban tissue is closely linked to diversity generated through the incremental development of individual parts. Urban form is described as being made up of ‘relatively small components that can adapt, assemble and reassemble’ and that depend ‘on a system of units that maintain their own identity even when combined into greater wholes.’ (ibid.). Issues of adaptation and diversity generation at plot level are discussed in Chapter 4. The value of integrated microspatial data repositories able to provide insights into the composition of the stock, and its behaviour as a dynamic system, and through which locked in patterns inhibiting sustainable trajectories could be identified, were already being called for in the 1960s by the American writer, journalist, theorist, and activist Jane Jacobs. Her 1961 book, The Death and Life of Great American Cities (Jacobs, 1961), is described by Batty and Yu Xie as ‘a work of almost unparalleled prescience’ (add ref). In it Jacobs described how cities, like the life sciences, are problems of organised complexity in which many variables operate simultaneously within a system (Jacobs, 1961). She argued that, ‘the microscopic or detailed view’, along with the collection and classification of large quantities of data, was essential to enable these systems, and complex urban problems created by them, to be unpicked. Though in the life sciences, the important of advances in technology, and particularly in microscopy, have been long acknowledged as critical in the process of transforming our understanding of the make-up, operation and dynamics of biological systems, through the ability to observe these at cell and sub-cell scale (Dröscher, 2019), in urban science. To Jacobs ‘apparent disorder was but a symptom of deeper order and complexity, and that naturally growing organic cities provided much richer and more workable environments than those imposed by city planners’ (Batty and Xie, 1994, p. s32).
Jacobs set out the most detailed theoretical framework currently available on the relationship between diversity, resilience, and the speed of change, in the context of building stocks, and demonstrating the importance of comprehensive microspatial data on building age and form. She argued that diversity is essential to the generation of vitality and economic success in cities as well as to their sustainability and resilience, and (like Moffatt and others working other in sustainability science) that understanding the role of time in this process is essential, as is studying urban components at the microscale (Jacobs, 1961). Jacobs main question was ‘How can cities generate enough mixture among uses – enough diversity – throughout enough of their territories to sustain their own civilization?’ (Jacobs, 1961, p. 144). She explains that for cities to be able to do this, certain conditions or rules have to be met. The first is that more than one primary land use exists in streets, to attract different users to the area at different times of day; the second, that street blocks must be short to maximise points of intense interaction; the third, that density needs to be high enough to stimulate intensive use; and the fourth, that buildings should be of diverse age, ‘closely mingled’, with a good proportion of old (ibid, p. 150–1).
Jacobs states that ‘Cities need old buildings so badly it is probably impossible for vigorous streets and districts to grow without them. By old buildings I mean not museum-piece old buildings, not old buildings in an excellent state of rehabilitation – although these make fine ingredients – but also a good lot of plain, ordinary, low-value buildings, including some run-down old buildings’ (ibid., p. 187). Her description of the importance of knowledge of building age; of how age diversity is generated, and how it can sustain successful cities, can be summarised as follows: Diversity of building age provides diversity of building form. This in turn generates a wide variety of types of space, and of affordability of space, offering possibilities for inclusion of a variety of potential uses (i.e. cheaper rents for older, more rundown buildings will be able to accommodate new, small, independent businesses, more easily than new build can; as here rents will need to cover investment on building costs, and will be affordable to fewer, wealthier users e.g. chains). Diversity of building use in turn attracts diverse local populations – importantly, at different times of the day. This means that more people use the streets for a longer period, resulting in areas that are safer, and therefore, in turn, more likely to attract people to them. Mixing of land uses, within streets and buildings, through this process, also facilitates knowledge spill-over and the cross-fertilisation of ideas, thus driving innovation and producing social and economic benefits for the city as a whole. Page also records the way in which mixing, driven by forces of ‘mutation and recombination’, are ‘well-known primary sources of innovation’ (Page, 2010, pp. 8–9).
Jacobs wrote extensively about the role played by older buildings and existing stock in this process. She argued that it was here that diversity was held and generated, and that substantial loss within this incubator and reserve would have significant implications for future diversity generation, and thus city success. As described by Moffatt, Jacobs also stressed that diversity of age, and of form, and consequently of vitality, could only be generated through slow, incremental development, in which there is constantly ‘a mixture of buildings of many ages and types’ (ibid, 189) with ‘what was once new in the mixture eventually having time to become what is old in the mixture’ (ibid., 1961, p. 189). The only harm of old buildings in cities, she argued, is when there is ‘nothing but old age’ (ibid, p.188).
Jacobs stated that greater attention needed be paid to the ‘economics of time, not hour by hour through the day… but by decades and generations’ (ibid., p. 189), as time makes the high building costs of one generation ‘the bargain of another’, causes some structures to become obsolete, and allows others to adapt to new uses; ‘The economic value of old buildings is irreplaceable at will. It is created by time. This economic requisite for diversity is a requisite that vital city neighbourhoods can only inherit and then sustain over the years’ (ibid., p. 199). Only through understanding the economics of time, she believed, could the implications of the presence or absence of older buildings be fully understood. In the National Trust for Historic Preservation’s 2014 report Older, Smaller, Better, (which used property tax data relating to building age, use and size for three US cities to test Jacobs’ theories), the strongest economic performance in commercial areas was found where small-scale older buildings of mixed age existed, where areas had been left to evolve slowly over time (National Trust for Historic Preservation, 2014). 4.3.3 Organised complexity and the need to collect data at the microscale
She also argued that urban problems were very particular kinds of problem, classified as those of ‘organised complexity’ (Jacobs, 1961, p.429); these she said required a specific approach to problem-solving. She described how the term had been used by Warren Weaver, in 1948, in the context of the life sciences, to describe problems ‘which involve dealing simultaneously with a sizable number of factors which are interrelated into an organic whole’ (Weaver, 1948, p. 539). In biological systems, and urban systems, multiple variables need to be considered at once, as these will be ‘varying simultaneously and in subtly different ways’ (Jacobs, 1961, p. 433). Through painstaking empirical study, at street and city level, and across US cities, Jacobs realised, without the aid of computers, that these variables, though appearing to be operating in apparent disorder, could in fact be seen as symptom of order and complexity.
She described how three ‘tactics’ are necessary to understand organised complexity in cities and to begin to solve complex problems (ibid, p. 440). The first is to identify and understand processes; that is operations or actions taking place in the city over time. The second is to find ‘unaverage’ clues using volume data. Urban problems were considered unsolvable to Jacobs through the use of statistical averages and small samples alone. She specified that significant amounts of data representing the average in cities were needed to pinpoint these statistical outliers, seen as ‘announcers of the way large quantities are behaving, or failing to behave’ (ibid., p. 443). The third tactic, or rule, was to work at the microscale, always reasoning from the particular to the general, informed by bottom-up knowledge based on empirical study at local level. Though cities ‘cannot go under the same microscope’, in the same way as the life sciences, ‘tactics for understanding both are similar in the sense that both depend on the microscopic or detailed view…’ (ibid., p. 439).
Jacobs also called for the rigorous collection, description and classification of information on stocks. She also advocated increased study into the long-term dynamics of urban systems (and components within them) to gain the necessary detailed perspective, and to see how components are ‘interrelated into the organic whole’ (ibid., p.433). Where her call fundamentally differed from spatiotemporal data collection being undertaken within the scientific discipline of urban morphology at the time, was that it argued for the capture of these data at city scale. Understanding aggregate or more abstract properties of cities could, Jacobs believed, only be grasped in this way. These tactics, relating to processes, citywide datasets, and observation at the microscale, are all applicable to prototype open building attribute platform design.
e) Building lifespan extension and the slowing rates of change - Jane Jacobs, the building conservation movement, and industrial ecology principles
The Death and Life of Great American Cities was in large part written in response to Jacobs’ first-hand experience of loss of diversity and uniqueness in her home city of New York, and her voluntary work fighting against this with community planning and historic environment groups. Figure 4.1 illustrates the type of mass housing redevelopment, overseen by Robert Moses, against which Jacobs fought (Auchincloss and Lynch, 2016). In Death and Life., she discusses the socio-economic impacts of destroying diversity by ‘wiping out old buildings in great swathes’ (Jacobs, 1961, p. 198) and their replacement with ‘large swatches (sic) of construction built at one time [which] are inherently inefficient for sheltering wide ranges of cultural, population and business diversity’ (ibid, p.191), and which are inadequate substitutes for the ‘inherent efficiency, in cities, of mingled age and inherently varied overhead’ (ibid., p. 192).
To understand the potential long-term impact of loss of physical diversity in cities, Jacobs studied change to New York’s physical fabric over more than a century. Through local area analysis she was able to identify the way in which cycles of deprivation and ill-health not only repeated themselves (as shown by Dorling and Noble for London) but were also perpetuated by cycles of physical redevelopment. Jacobs argued that the inability of single-age areas to adapt, and their lack of resilience to demolition, could be seen as directly linked to the loss of building age diversity caused by the speed and scale of construction of new development. Where large-scale rapid change occurs within neighbourhoods, she argued, it creates an homogeneity of age and ‘a strange inability [for the neighbourhood] to update itself’. ‘Finally the whole thing must be wiped out and a new cycle started’ (ibid., p. 198). This is discussed in the context of London in Chapter 8. Through her description of this process, she explained how, if the fundamental relationship between time, age diversity and incremental adaptation was not properly understood, locked-in cycles of demolition would continue to repeat themselves; and that diversity, once lost, would, even if the conditions were correct, take a very long period of time to recreate. In this way the potential of age diversity as an indicator of area vulnerability to demolition can begin to be seen.
Jacobs’ views in part reflected those of Charles Booth who had carried out his poverty mapping for London around seventy years before. Booth too questioned the efficiency of large-scale housing clearance programmes, and whether the improvement of slums could not be achieved through adaptation and small-scale adjustments at a slower, less disruptive pace. In 1889, he wrote of one of London’s most notorious slums in Shoreditch, ‘The place deserved destruction. A district of almost solid poverty... in which the houses were as broken down and deplorable as the unfortunate inhabitants’ (Yelling, 1986, p. 51), but of the replacement scheme he noted that, ‘Net benefit has undoubtedly resulted. But it is a question of whether an equal benefit might not have been gained in some gradual, less disturbing and less costly way’ (ibid.), ‘It is all a process of tinkering. Improvement is not coming structurally from a Haussmann...’ (ibid.).
Jacobs believed that the long-term socio-economic costs to society of these cycles of construction, failure and demolition needed to be taken into account when calculating the cost benefits of large-scale redevelopment, particularly in relation to housing. This issue has been raised more recently by Kate Crawford et al. and Anne Power, in the context of social housing demolition, and sustainable city goals, in the UK (Power, 2008, 2010; Crawford et al., 2014). Physically wiping out slums did not, Jacobs concluded, solve socio-economic problems, and in fact was likely to increase rather than decrease the vulnerability of the system as a whole: Wiping away slums and their populations ‘at best merely shifts slums from here to there… At worst, it destroys neighbourhoods where constructive and improving communities exist and where the situation calls for encouragement rather than destruction’ (Jacobs, 1961, p. 270–271).
Importantly, Jacobs considered that large-scale, homogenous new development was highly problematic if incremental adjustments as-and-when needed could not occur, (as further discussed in Chapter 4). Accommodation of change through ‘ingenious adaptations of old quarters to new uses’ was seen as crucial, with new build insertions also essential to improve and maintain vitality (ibid., p. 194). ‘The only harm of aged buildings to a city district or street is the harm that eventually comes of nothing but age – the harm that lies in everything being old and worn out. But a city is not a failure because of being all old. It is the other way round. The area is all old because it is a failure’ (ibid., pp. 188–189). Jacobs believed that if rules and conditions for generating diversity were applied, the tide of departing populations, and cycles of deprivation and disruption could be averted (ibid, p. 285). Her key point, as also described by Kohler and Yang, and Reyna Chester, (see Chapter 2), was that negative locked-in cycles within stocks needed to be understood and averted, and that for this to happen, access to historical information, and to statistical data on stocks, at building and city scale, were required.
Jacobs also described how specific planning tools could support cities in generating diversity and resilience. She described ‘zoning for diversity’ as a necessary method of consciously slowing development speed (ibid., p.252). She called for tools to apply ‘constraints on too rapid a replacement of too many buildings’ – so that stocks ‘cannot be overwhelmingly of one kind...so as to prevent the erosion of economic diversity’, and for incentives and regulation to limit the amount of a single type of land use in a given area’ (ibid., p.253). She also highlighted issues raised by area attractiveness (increased though the protection and generation of diversity) in relation to higher land prices and increased redevelopment pressure. This she explained could lead to diversity loss, and self-destruction being caused by an area’s success.
Area-based demolition controls had been pioneered in the US, in New Orleans, in the 1920s, and from 1969, in large part due to Jacobs’ efforts, conservation areas began to be designated in New York (Institute for Historic Building Conservation, 2014). In the UK today, justification of uniqueness is commonly required in Conservation Area designation, a characteristic closely associated with age diversity (Historic England, 2019b). The importance of uniqueness to the sustainability of urban areas is also discussed within the New Urban Agenda (United Nations, 2016), in UNESCO’s 2011 Historic Urban Landscape Recommendations (UNESCO, 2011), and in the World Bank’s report, The Economics of Uniqueness (Licciardi and Rana Amirtahmasebi, 2012). Johansson argues that unique areas, where designated, should be reclassified as non-renewable resources (Kohler and Hassler, 2002, p. 234). Globalisation, says Paul Knox, has created a fast world ‘of restless landscapes in which the more places change the more they seem to look alike, the less they are able to retain a distinctive sense of place, and the less they are able to sustain public social life’ (Knox, 2005, p. 3). Hassler argues that conservation policies should be central to future strategies designed to decelerate churn in the stock as a whole (Hassler, 2009). Open data platforms therefore also need to capture data on the protection and designation of buildings and areas, to illustrate where spatial constraints are being imposed on development speed, and to highlight buildings classified by the city as positively contributing to its operation. Jacobs work reinforces the importance of including precise age data within open building attribute data platforms, and of the potential value of this data type in forecasting area vulnerability and resilience.
Within the historic environment and conservation sector, the principle of building lifespan extension, and resource conservation, has been actively and systematically advanced for many years; in the case of the UK for well over a century (Delafons, 1997). Here the interdependence of parts within the stock as a system, the long-term knock-on effects of rapid change, and the need for long-term planning horizons, avoidance of finite resource depletion, tracking of survival, mortality and extinction rates, and the promotion of incremental adaptation to maintain and create diverse, sustainable and resilient systems, are all well understood. However despite this sector being in the vanguard of sustainable stock development, the vast knowledge base held within still remains little exploited by the scientific community (Hudson, 2016). Awareness of the need to capture data on the evolution of stocks and the way areas develop, and typologies mutate, over time, is however now beginning to change the research landscape, with a spotlight likely to be increasingly placed on historic environment sector knowledge in coming years. At the same time interest in a more rigorous, scientific approach to data curation, collection and analysis, as long championed within urban morphology, is also growing within the sector itself (National Trust for Historic Preservation, 2014). Mechanisms to support the historic environment sector in adding and checking data, as well as encouraging download and analysis, therefore need to be built into open dat platforms in older harness knowledge particularly on composition, operation in terms of how well buildings work in local areas for communities, and dynamic behaviour. Owing to relevance of the sector’s input to so many data areas specific attention to the needs of this sector need to be made.
Opportunities also exist to tap into knowledge of building age in architecture, with interest in refurbishment of urban stocks, (rather than the previous focus on new build) now growing. In 2020 Oliver Wainwright, writing on architect-driven initiatives in the Netherlands tracking material reserves, posed the question, ‘What if every existing building had to be preserved, adapted and reused, and new buildings could only use what materials were already available? Could we continue to make and remake our cities out of what is already there?’ (Wainwright, 2020). In 2016 Daniel Abramson, in his book Obsolescence, explored the economic drivers in the US behind the promotion of building obsolescence from the 1920s, and the idea that new buildings will always outperform old (Abramson, 2016). In Buildings Must Die, published in 2014, Cairns and Jacobs address why building mortality and decay have been so little explored in architecture (Cairns and Jacobs, 2014), citing Kevin Lynch’s argument, from 1960, that future remodelling, demolition or dismantling of buildings should always be considered at the building design stage (ibid.).
Stewart Brand, in How Buildings Learn, in fact argued, in the 1990s, that architecture should be rebranded as ‘the design-science of the life of buildings’ with reuse placed at the forefront of its work (Brand, p. 210). He described the benefits of incremental, extension and adaptation, and of the process of trial-and-error in building, stating that ‘slow is healthy’ (ibid.). Brand believed that ‘designers should study the present the way historians study the past- diachronically, in terms of changes over time’. (ibid., 1994, p. 210). He also called for much greater discussion of building vulnerability, mortality and failure. ‘We need failure analysis that is systemic over the full scope of building-related activities and the entire life of buildings’ (ibid., p. 214). The need for a wider discussion of failure was also raised by Stephen Groak, who in 1990 described an ‘epidemic’ of building failure ‘in the past 30 or so years’ (Groák, 1990, p. 163). Longevity, reuse and adaptability were also all advocated in the 1960s by William Howell. In his review, in 1967, of Jane Jacob’s RIBA lecture of the same year, he stated, ‘We cannot afford the waste of national resources involved in knocking down buildings with good life in them and which in any case may be housing social and economic activities which would not survive transplantation…we are never in our foreseeable economic future going to be able to afford to treat buildings like Kleenex’ (HKPA, 2016). Opportunities now exist to harness knowledge held within the historic environment sector, and the construction industry, (and the growing interest of the former in data analytics, and of the latter in building reuse), to bring together knowledge from science, humanities and the arts to support the development of open building attribute data platforms. This requires partnerships to be developed across sectors and for features to be specifically designed to support sector engagement as tested in Chapter 9.
At current rates, it is possible that the extent of land urbanised over the next fifty years will exceed all urbanisation in history (Mehaffy, 2017). Between 2018 and 2050 the percentage of the world’s population living in urban areas is expected to rise from 55% to 68% (United Nations, 2018), with 85% of Europeans already living in cities and towns (Roser et al., 2013). Over the last century, while population has increased fourfold, material and energy use has risen ten-fold (Weisz and Steinberger, 2010). The International Energy Agency records that ‘The building and buildings construction sectors combined are responsible for over one-third of global final energy consumption and nearly 40% of total direct and indirect CO2 emission’ (International Energy Agency, 2021). Direct emissions relate to those generated in construction, building operation, adaptation/refurbishment and demolition, and indirect emissions to those generated in the production of construction materials and technical installations (Sharma et al., 2011). UNFCCC emissions targets, referred to in Chapter 1, now place significant pressure on countries to accelerate the reduction of emissions and material waste, especially that generated by building stocks.
In the mature industrial cities of Europe, the rate of churn (i.e. new buildings minus demolitions), is relatively slow. New additions are estimated, on average, to be built at an annual rate of 1% (Hassler, 2009, p. 554), with demolition rates recorded at under 0.25% (Thomsen et al., 2009). Stocks are consequently relatively old, with half of European dwellings estimated to have been built before 1970 (European Commission, 2021; Meijer et al., 2009). UK dwellings are considered to have the longest average lifespans in Europe, of over a 100 years (ibid.).
In mature stocks, analysis of problems with greenhouse gas emissions will mainly require on building performance, and levels of heat loss and electricity and gas use (Energy Savings Trust, 2021). 9Energy reduction is likely to be addressed, as in the case of the UK, though a mixture of planning policies and public education programmes relating to consumption reduction, retrofit and smart metering roll-out, a tightening of planning regulations, and the provision of financial incentives). Issues with material flows will generally relate to short lifespans in areas of high turnover such as financial districts (O’Connor, 2004), and to ongoing small-scale additions and deletions in plots (Thomsen et al., 2011a) (as discussed in Chapters 4 and 7). These will generally be dealt with through policies such as the EU Waste Directive of 2008 that prioritise reuse and life extension over recycling and new build (European Commission, 2008; Huukha and Lahedensivu, 2014). The shift in focus from new build to the existing stock is also a result of a slowing of growth in mature cities (including some shrinkage) and the need to increase refurbishment to support sustainable management. Though this is viewed by Nicklaus Kohler et al. as beginning to replace the European construction industry’s ‘longstanding fascination for continuous growth in input flows, and the ignorance of output flows and side-effects’ (Kohler et al., 2009, p. 449), in countries such as the UK, as noted in Chapter 1, refurbishment policies still remain weak.
In countries such as China, India, Mexico and Brazil, issues with energy and material flows lie more with the unprecedented scale and speed of new urban development (Krausman et al., 2009), and the impact of large-scale demolition programmes and shortened building lifespans on long-evolved urban ecosystems, cultural traditions, social identity, and physical coherence able support social cohesion (Xu et al., 2019). In Asia, average building lifespan is estimated at only 25 to 30 years (Miatto, 2017). In these fast developing areas of the globe, stocks, of which quality is not yet fully understood, have doubled in some cases in 20 to 30 years, and may still double again within the century (Kohler and Yang, 2007). Many countries are also only at the start, or in the process of, transitioning to an industrial type of social system, meaning that already unprecedented global energy and waste flows (Krausmann, 2009), loss of building reserves and cultural assets, and population displacement, are all set to increase. Christopher Kennedy et al. describe how the scale of material and energy flows may be affected by a city’s age, development stage, cost of energy, cultural make-up, climate, and population density (Kennedy et al., 2007). Abel Chávez et al. see the speed of urban change as closely linked to phases in a city’s life, classing urban communities and urban areas according to different ‘metabolic’ rates: ‘unbuilt communities’ in the global South classified as ‘rapidly growing’; ‘built communities’ in North America, Europe, Japan and Australia as ‘mostly stable’; and ‘unbuilding communities’ in the US rust-belt and Eastern Europe, as shrinking and ‘potentially poised for exemplary green infrastructure development’ (Chavez et al., 2018, p. 82). This view of the city as a dynamic system passing through a set of stages was also described by the American theorist and planner Kevin Lynch, ‘While it [the city] may be stable in general outlines for some time, it is ever changing in detail. Only partial control can be exercised over its growth and form. There is no final result, only a continuous succession of phases’ (Lynch, 1960, p. 2). The formal study of material and energy flows in stocks and cities, caused by construction and demolition processes, is the focus of a branch of sustainability science known as Industrial Ecology (Hond, 2000). In Industrial Ecology, the sustainability, resilience and efficiency of industrial systems is studied (Chavez et al., 2018). Industrial metabolism studies were first carried in the US, in the 1960s, and measure many types of flow including those generated by structural materials, energy and carbon, water, fuel and toxic chemicals (Hond, 2000). Urban metabolism studies, which analyse flows within cities, view stocks as ecosystems in which each part is related to the whole, and where closed loop systems, which rely on reuse, are promoted (Chavez et al., 2018); ‘a sustainable society should minimize its environmental impact by reducing extraction of resources. To minimize extraction, existing stocked material should be used for as long as possible’ (Tanikawa and Hashimoto, 2009, p. 484). Urban metabolism is a rapidly growing field of research, and is closely related to the study of building lifespans, mortality and survival, as discussed in section 2.6. Understanding the age of stocks requires datasets on date of construction for all buildings in the current stock. It also needs methods of keep these datasets up to date which requires current demolition and new build data. This is discussed in more detail further in the chapter alongside the issue of extensions.
The need for data on the age of stocks and patterns of dynamic behaviour 9e.g removals and additions) is also stressed by Wei Yang and Kohler in their research on China in which they argue that the pace of development needs to be ‘modulated’ in areas of rapid growth, to counter flows and resource depletion, and declining quality in the stock owing to lack of refurbishment (Yang and Kohler, 2008, p. 16). They also state that emissions cannot simply be addressed through energy conservation and technical improvements alone (ibid.). Alessio Miatto et al. also advocate a ‘slow construction sector’ and recommend that the average lifespan of buildings be used as an indicator of the speed of change, by policy makers, to help promote adaptive reuse over demolition (Miatto et al., 2017). Demolition and reconstruction may have economic benefits in the short term, but in the long run will create a worse scenario for countries in terms of flows, and loss of finite socio-economic and cultural resources (ibid.). Mehmet Aksözen et al. also argue for an ‘optimal speed of transformation’, to prevent loss of older reserves with high embedded value (Aksözen et al., 2017, p. 256). Kohler and Yang state that ‘Unlike other economic sectors producing consumption goods with short lifespans, the evolution of the building and infrastructure stocks depends significantly on the already existing part’; knowledge of this existing, older section is therefore essential (Yang and Kohler, 2008, p. 6). In 2011 the Building Performance Institute of Europe also commented on the scale and importance of the task of refurbishment of older buildings; ‘the most significant challenge in exploiting the energy saving potential within cities lies in the systematic renovation of older stock’ (BPIE, 2011). Ravetz argues, in the UK context, that ‘the energy performance of much of this [older] stock is generally low, while its economic, social and cultural values are often high’ (Ravetz, 2009, p. 4462). The economic value of older stock is also discussed in Chapter 3. Hassler describes older buildings as ‘goods with long-term usefulness’ (Hassler, 2009, p. 562), with incentives needed that discourage constant flux (often driven by changes to property ownership) (ibid. pp. 563–564). Stocks, she argues, are ‘complex resources and not simply financial assets; a long-term ‘resource-preserving approach’ and a ‘change of course back to repairable and long-term, stable systems’ is now required (ibid. p. 565). Kostourou and Pssara also stress the importance of adaptation and incremental development (which aids lifespan extension and slows development pace) and define a sustainable building as not necessarily one that lasts forever, ‘but rather one that extends its life capacity and avoids obsolescence or demolition while accepting changes’ (Kostourou and Pssara, 2017, p. 73–75).
As well as enabling spatial patterns of change and energy and waste flows to be tracked, to be tracked spatial typology data combined with spatial demolition data are also important in identifying locations where a conscious choice of removal is being made over building life extension (Huuhka and Lahdensivu, 2014), and allowing more detailed investigations of where specific typologies are vulnerable and why. Huuhka and Lahdensivu, who have undertaken extensive work on demolition in Finland, argue that buildings ‘are not natural creatures, they do not die naturally. Well-built and regularly maintained buildings could last virtually forever’ (ibid., p. 1). (Evidence of building longevity can be found in UNESCO’s World Heritage Site list which includes examples of buildings surviving well over a millennia, and of fully functioning urban areas over 500 years old (UNESCO, 2021). ) Most buildings are not demolished because they are old or decayed (Kohler and Hassler, 2002). This has been proven by a higher rate of demolition for non-domestic than domestic buildings, which cannot be explained by structural reasons alone (Bradley and Kohler, 2007). Reasons for the conscious shortening of building lifespans are complex and may include the need to maximise financial returns from rent and sales (Liu et al., 2014); difficulty in sourcing replacement components thus limiting long-term maintenance (Kohler and Hassler, 2002); constrained spatial limits in cities as saturation occurs (Aksözen et al., 2017); social reform and health policies (Power and Mumford, 1999; Yelling, 1986; Jacobs, 1961; Medhurst and Parry Lewis, 1969); and population decrease and deindustrialisation (Power, and Mumford, 1999; Thomsen et al., 2011a). Thomsen et al. describe demolition as ‘the most visible aspect’ of the ‘profound social process’ of industrial transformation, economic decline, property over-production and demographic change occurring in a country (Thomsen et al., 2011a). Reasons for lack of spatial tracking of demolition and lifespan shortening include: the construction industry’s focus on the initial construction phase (Kohler et al., 2009); the minor role and cost of demolition compared to construction costs as a whole (Thomsen and Van der Flier, 2009); lack of policy incentives to track loss, analyse survival rates and promote reuse; short-term planning horizons; and a long-held view of the stock as a resource for profit, rather than as an asset and reserve with significant embedded value (Hassler 2009; Abramason, 2016). Thomsen and Van der Flier’s conceptual model of obsolescence is a useful tool for understanding the processes leading to demolition (Thomsen and Van der Flier, 2011b).
Add....
Complexity science, and the use of computational methods combined with historical data to identify underlying rules of behaviour within, dynamic, urban systems
Jacobs’ theories on diversity and complexity were to influence the work of Mike Batty, and his research into organised complexity in cities, and hierarchies and codes’ of operation that determine patterns of urban growth (Batty, 2007). Batty realised that cities contained too many variables and interactions to use traditional methods of urban modelling (ibid.). From the 1990s he began to move away from top-down models using aggregated data on land use and urban form, and began to experiment with bottom-up, microspatial, visual, time-conscious microsimulation models. These focused on urban processes, feedback loops, complex pattern interpretation at ‘cell’ level, and on local interdependencies and their relationship with urban systems as a whole (Batty and Xie, 1997). Batty recognised, like Jacobs, that gathering microspatial information on dynamics was central to this process: ‘dynamics of course represent the key…. Although we know how incremental change feeds on past change to generate its own momentum through the realization of scale economies, we still have little clue as to why such change takes place in the locations it actually does’ (Batty, 2018, p.9). Batty quotes John Holland’s description of the city (from the 1990s), as a ‘pattern in time’, in which no single constituent element remains precisely in place, but the city persists and maintains coherence without it being understood how (ibid., p.8). Batty began to test computer models, known as cellular automata, in which local ‘rules’ of operation are iterated, to generate unpredictable ‘emergent’ patterns at much wider geographic scales. First developed by John Conway, in 1960, for The Game of Life, these models allow the user to experiment with the survival and mortality of components within a system, using what Conway described as ‘genetic laws’ (Gardner, 1970, p. 120). Here the computer programme iterates rules at the local, or immediate neighbourhood level, to effect the ‘life’ and ‘death’ of cells on a grid. Batty’s initial interest in these models stemmed from his work on computer graphics and pattern visualisation, and his research into fractals with Paul Longley (in which irregular urban structures were found to repeat themselves and to be ordered hierarchically, across many scales) (Batty and Longley, 1994). Batty and Longley showed that cities follow certain rules of growth, through agglomeration and economies of scale. They likened the process of urban growth to the generation of life itself and argued for the need to identify and reveal ‘generative codes’ driving the survival, adaptation and mortality of urban components: ‘Like all natural growth, they [cities] evolve through the cumulative addition and deletion of basic units, cells or particles and they thus grow through successive accumulation at these basic scales…. Within the growth processes are codes which determine how the organisations of these basic units of urban development might repeat their form and function across many scales... (ibid., pp. 228–229). Batty and Longley viewed the organically growing city, developed slowly over time, as being optimal in countless ways. The ability of simulation models to mimic the ageing of cities was also raised, ‘One could assume a process of aging and renewal, varying according to simple rules and policies, which would then enable a pseudo-dynamic simulation to be developed. A series of images of the typical house types in London over the next 50 years could be generated in this way’ (ibid., p. 161). ‘But’, they said, ‘these are for the future, and in any case there are many lines of inquiry that have to be followed up before then’ (ibid.). This idea is explored in the context of open building attribute platform simulations in the following section.
Batty saw, like Jacobs, that large quantities of microspatial data were essential to reveal wider patterns with complex systems, held together through modularity and hierarchy, where modules repeat themselves at different scales (Batty, 2007). To simulate organically growing cities, modular algorithms were proposed, allowing many variations of the city or urban area to be generated from a basic block, but from different sets of local rules. These models also tested the urban theorist Christopher Alexander’s idea (discussed further below) that it is the ‘genetic code’ of the block or module that allows different variations of it to grow or not grow. The aim of testing microsimulation models was also to develop ‘knowledge of the same phenomenon at different levels or scales’ to allow it to be ‘synthesised consistently into an ordered understanding’ (Batty and Xie, 1994, p. S31). In Batty and Xie’s 1997 study of Amherst, Buffalo, US (Batty and Xie, 1997), property tax age data were used in a cellular automaton model designed to explore patterns evolving from local rules, according to macro laws which were not built into the model (ibid.). Building age data were used to spawn growth from multiple sites for which different local rules of mortality and survival were iterated, resulting in entirely different patterns of growth. Though Batty and Xie concluded that the method was of value, longitudinal spatial data, at the microlevel, were identified as being necessary to advance the work (ibid).
In 2002, Kiril Stanilov published a study of suburban growth in Greater Seattle (Stanilov, 2002). Within it, aerial photography, for a series of time points from the 1960s onwards, was ‘carefully assembled together, piece by piece, to visualize the sequence of incremental transformations in the metropolitan fabric’ (ibid., p. 192). Through this process, the spatial distribution of land uses and change to them over time were explored. Like Jacobs, Stanilov argued that a more systematic approach to the structuring and classification of data was required. He also commented on the difficulty with access to, as well as the predictive power of, historical data ‘Documentation on historical development patterns is scarce and sporadic yet it is an invaluable tool in reconstructing our past and predicting our future…a detailed set of historical records of past development patterns can be used as a powerful educational and analytical tool for visualizing the dynamics of growth and the identification of development trends’ (ibid., p. 174). In 2005, Batty and Stanilov began work together on a five-year visual study into the spatial determinants of the growth of London, using a 400km2 sample area. For this, a cellular automaton model was built to investigate macro rules of urban growth (Stanilov and Batty, 2011). The model addressed what the authors described as the ‘Achilles heel’ of physical models of urban form, namely ‘their reliance on hypothetical or highly aggregate data’ that smooth out complex patterns, meaning that fast and slow dynamics cannot be easily tracked (ibid., p. 254). London was chosen as the system of interest as it offered ‘the opportunity to trace the patterns of urban growth with the highest level of precision’, owing to the amount of historical information, and number of OS map intervals from the mid-19th century, available (ibid, p. 258).
To programme the computer model, rules of change at the local level first had to be identified, recorded and defined. For this, thousands of features from the OS historical maps were manually vectorised by Stanilov; historical patterns of development were then studied. These vectorised features included small parcel polygons, and street and railway network segments. Land use and building typology information was also recorded at parcel level. Local rules of change were generated by analysing changes to the parcel polygons between 1875 and 1896, and then between 1896 and 1915, and by assessing change in land use from one period to the next, as well as by studying change to stations, the Central Business District (CBD) and suburban cores. Using a grid of small (25m x 25m) land use ‘cells’, observations on consistent repetitive, spatial behaviour were made in relation to cell location, land use of the cell’s neighbours, distance from various elements of the transport network, and the application of zoning restrictions. To be able to test the accuracy of the local rules employed, the OS 1915 survey was used as a proxy for the present day. Spatiotemporal change was then simulated at approximately twenty-year increments from 1915 up to 2005. In Figure 3.2, the remarkable power of this method can be seen through the similarity between the computer-generated predictions of change for post-1915 intervals, and actual development shown on post-1915 OS maps. Using this method, Stanilov and Batty identified ‘enduring spatial relationships’ within the built fabric (ibid., p. 255) and were able to show that dynamic behaviour was strongly influenced by a general inertia and resistance to change and by the pre-industrial urban structure (preurban being classified as pre-1800). They concluded that ‘the ordering of activities in urban space is conditioned by rules that transcend historical circumstance and reflect deeper structures of spatial organisation’ (Stanilov, 2012, p. 40), and that changes in economic circumstances and political and technological regimes only act as an ‘overlay’ to these fixed spatial relationships. For example, the extent and spatial distribution of new residential development, when analysed in relation to locations such as the Central Business District and to railway stations, over time, was found to be very similar for each time interval (ibid.).
Rules of growth were noted to operate on two levels. Firstly rules were found at the microlevel in relation to the attraction and repulsion of land uses over time (e.g. high-density residential and commercial use were attracted, and residential and industrial uses found unlikely to collocate) (ibid.). Here a ‘generative code of urban development’ that governed the shape and growth of an urban area over the course of its existence were identified. Secondly, rules of growth were found to exist at the regional level in relation to the accessibility of the main transportation network, and in particular to the preurban street network, the Central Business District and suburban activity clusters, which had ‘decisive influence’ on long-term spatial patterns of land use (Stanilov and Batty, 2011, p. 256). These elements were described as ‘largely exogenous to the code of development and, once determined, the code adapts to the form that is laid down from above’ (ibid.). The same four components, identified by Stanilov and Batty, and Jacobs, as being necessary to study complexity in the city, and processes, patterns and relationships within the urban fabric, were also identified by Frank Brown (Brown,1985). These were: the development of hypotheses for local rules of change (including constraints); a computational approach; access to historical resources, and a ‘microscope, so to speak’ with which to view the city (ibid, p79). Brown used computers, in the 1980s, to test hypothetical rules for the way in which London’s urban fabric developed during the medieval period. Like Stanilov and Batty, he concluded that ‘the urban fabric was generated according to consistent local rules…, checked and limited by various physical constraints’, revealing a deep structural logic (Brown, 1985, p. 79). Only through the four step process described above did Brown believe that patterns and rules could be understood at the city scale, ‘Because the urban fabric was locally generated by an organic process of piecemeal development, one may infer that any order discernible on a large scale had its origins in decisions taken at local level. It is these local decisions concerning the way buildings were put up that we need to identify if we are to decipher the code that lay behind the generation of the medieval urban structure’ (ibid., p.78). Like Christopher Alexander, Brown argued that, ‘to be reasonably authentic, patterns of connections should unfold in a step-by-step fashion, rather than be laid out as a whole’ (ibid., 1985, p. 89). He also highlighted the problem of accessing data to generate models mimicking this process; a ‘major difficulty is encountered for these [models], for all important spatial decisions are seldom of the kind that find their way into documentary record’ (ibid., p. 78).
This group of studies provides evidence of the potential, and importance of longitudinal spatial data to increase accuracy in the long-term forecasting of stock behaviour. They also show how underlying relationships between urban components, and constraints to development, can be revealed when these large-scale time series datasets are combined with microsimulation methods. In Chapter 7, data from the Batty/Stanilov study are used to test semi-automated approaches to large-scale open age data generation. Longitudinal data are also used to forecast demolition patterns.
In Appendix 4, Jacobs’ findings are incorporated into a conceptual colour model exploring the value of integrating interactive age and lifespan microsimulations into open data platforms. Before describing this model, a brief introduction is given to microsimulation models which use longitudinal data to reveal (as Jacobs had done) underlying patterns and rules operating within the urban structure. The model raises many questions: What, for example, will become of ghost cities in the next twenty years? How can help prevent single-age cities being subject to ongoing cycles of demolition in future, where all buildings ‘fail’ simultaneously, and allow time for the process of incremental development to generate diversity of age and form, and resilience? Should, as Hassler and Jacobs have argued, existing designation/zoning tools be applied at city scale to effect a more precise calibration of rates of change within planning systems? And could interactive rule-based simulations such as this, allowing sliders to be moved to calibrate change and simulate scenarios, based on local rules of change, using historical and current data, be incorporated into open data platforms? Would this not help policy makers and citizens to test and visualise sustainable and unsustainable trajectories? Colour simulations of this kind also have the potential to illustrate the ease and speed with which uniqueness, resilience and vitality can be lost in cities, the difficulty of its reconstruction, and the scale of energy and waste flows (physical, socio-cultural and economic) associated with such loss. Though the development of such simulations is beyond the initial scope of the prototype first features designed to collect data are developed for the Dynamics section as discussed in Chapter 9.
The same four components, identified by Stanilov and Batty, and Jacobs, as being necessary to study complexity in the city, and processes, patterns and relationships within the urban fabric, were also identified by Frank Brown (Brown,1985). These were: the development of hypotheses for local rules of change (including constraints); a computational approach; access to historical resources, and a ‘microscope, so to speak’ with which to view the city (ibid, p79). Brown used computers, in the 1980s, to test hypothetical rules for the way in which London’s urban fabric developed during the medieval period. Like Stanilov and Batty, he concluded that ‘the urban fabric was generated according to consistent local rules…, checked and limited by various physical constraints’, revealing a deep structural logic (Brown, 1985, p. 79). Only through the four step process described above did Brown believe that patterns and rules could be understood at the city scale, ‘Because the urban fabric was locally generated by an organic process of piecemeal development, one may infer that any order discernible on a large scale had its origins in decisions taken at local level. It is these local decisions concerning the way buildings were put up that we need to identify if we are to decipher the code that lay behind the generation of the medieval urban structure’ (ibid., p.78). Like Christopher Alexander, Brown argued that, ‘to be reasonably authentic, patterns of connections should unfold in a step-by-step fashion, rather than be laid out as a whole’ (ibid., 1985, p. 89). He also highlighted the problem of accessing data to generate models mimicking this process; a ‘major difficulty is encountered for these [models], for all important spatial decisions are seldom of the kind that find their way into documentary record’ (ibid., p. 78).
This group of studies provides evidence of the potential, and importance of longitudinal spatial data to increase accuracy in the long-term forecasting of stock behaviour. They also show how underlying relationships between urban components, and constraints to development, can be revealed when these large-scale time series datasets are combined with microsimulation methods. In Colouring London data from the Batty/Stanilov study are used to test semi-automated approaches to large-scale open age data generation see section h) below.
Complexity science, like sustainability science, also needs us to develop systems that join up fragmented knowledge and data about cities and stocks from many areas of expertise. These range from architectural history, building conservation, urban morphology, engineering, mathematics, computer science, urban science and energy to the construction industry, government, the third sector and communities and building users themselves. Critically this also needs to be done within the existing global framework of the sustainability goals for cities, as clearly set out by the United Nations New Urban Agenda. In academia, significant advanceshave been made since the 1990s within sustainability science, particularly in Switzerland, Germany and Japan (Kohler et al., 2009), and by journals such asl Building Research Information (BRI. Increased demand from funding bodies in recent years (such as UKRI) for multidisciplinary working, wider knowledge sharing and greater public engagement has also assisted this process.
In the 1990s Mike Batty and Paul Longley described the importance of the visualisation of data on urban form in understanding complexity in cities. They defined computers as ‘laboratories for visualizing urban form, with great potential to enhance our understanding as well as to communicate complex ideas in manageable form’ (Batty and Longley, 1994, p. 372). They also noted the way in which computer graphics allowed viewer ‘to see what has not been seen before’ (ibid., p. 98) and described the of checking date by asking whether it looks right. (ref). Venkatraman and Venkatraman describe visualisation as the ‘key to the success of Big Data…Unless the final output is in the form acceptable by people who need the data to be analysed, the whole Big Data venture is of no value. Huge reports or complicated graphics that seldom people understand will result in no meaningful decision-making or actions’ (Venkatraman and Venkatraman 2019).
The open knowledge movement and models for open data and open-source code dissemination
Any online integrated public database designed to promote knowledge exchange needs to be made as accessible to as many stakeholders and audiences as possible. Using proprietary GIS software is therefore not an option in developing open knowledge systems. Such systems also need to allow multiple users to work on them. Open knowledge is defined by the Open Knowledge Foundation (OKF) as ‘any content, information or data that people are free to use, re-use and redistribute – without any legal, technological or social restriction’ (Open Knowledge Foundation 2021b). Organisations such as the OKF (founded by Rufus Pollock in 2004), and the Open Data Institute (ODI) (founded by Tim Berners Lee and Nigel Shadbolt in 2012) are examples of not-for-profit bodies that actively promote a whole-of-society approach to knowledge advancement through open data. Critical to open database and platform success in terms of reproduction has also been the development of open licences and open code repositories. GitHub (founded by Chris Wanstrath, P. J. Hyett, Tom Preston-Werner and Scott Chacon in 2008 is the world’s largest source code host, providing both access to code as well as a platform for collaborative working.
From 2002 open source GIS software also began to be developed, beginning with QGIS created by Gary Sherman as an incubator project at the Open Source Geospatial Foundation in 2007. Since this time progress in open source GIS software converting geospatial data between formats (and getting data into shapefile formats or creating plugins) has also been made, driven in large part through the work of OpenStreeMap OSM).
OSM (founded by Steve Coast in 2004) is one of the best known examples of open data platforms. Another is Wikipedia (founded by Jimmy Wales and Larry Sanger in 2001). Both are designed to capture and share open knowledge are. OSM is particularly relevant to integrated database design as it is an example of a globally successful model for open databases providing geospatial data on the built and natural environment. Both OSM and Wikipedia are run by for-profit foundations with strong ethical frameworks, though issues relating to lack of diversity of editors have been raised (ref). Each is collaboratively maintained, meaning that data added through crowdsourcing, and improved and updated by multiple agencies and individuals for the public good (ODI). In parallel, citizen science initiatives, such as Zooniverse, have also grown out of the open data movement. These encourage citizens to engage in problems solving and data contribution relating to scientific research (add ref).
Significant work has also been done within the open data arena on ethical standards and protocols, including issues of privacy, security and inclusivity,. Mo Gadwat notes that of rigorous ethical frameworks for data handling are needed not only in relation to security and privacy but also in terms of training computers in ethical decision making before their autonomy increases (Gadwat, 2021). However gaps in research in relation to specific security and privacy issues arising from the capture and release of geospatial data on stocks, and particularly in relations to mapping data on citizen’s homes which, in the UK, represent over 90% of all buildings, still exist. Integrated open databases that prioritise data ethics, in all aspects of data collection and platform design are therefore essential.
Globally successful models for open data platforms that manage geospatial data are collaboratively maintained by stakeholders and managed to high ethical standards through open data licences and protocols, do therefore already exist. Examples of successful public governance models for these platforms have also been tested. Many opportunities now exist to build on work in the open field. However opportunities also exist to, through the use of research institution hosting, develop integrated databases on stocks that operate as live research projects allowing for co-working across institutions, cities and countries, and that, whilst releasing open code to promote accessibility and innovation, also quality control prototype reproduction and design.
AI and machine learning
AI and machine learning have the ability to create a step change in data availability, and to rapidly identify patterns and locked in cycles that may facilitate or inhibit sustainable development. In the field of complexity science rapidly technological advances in computer vision, machine learning and artificial intelligence, offer new opportunities not only to extract data at a speed and scale never possible before, but also to provide hitherto unobtainable insights into data patterns.