A2. HOW TO GUIDES - colouring-cities/manual GitHub Wiki
Navigating the site
1.0. Welcome Page introductory links and Menu button
Our Welcome Page provides you with links to our open code repository and open manual as well as to Colouring London Menu. To view data simply click on any pne of the 12 coloured categories
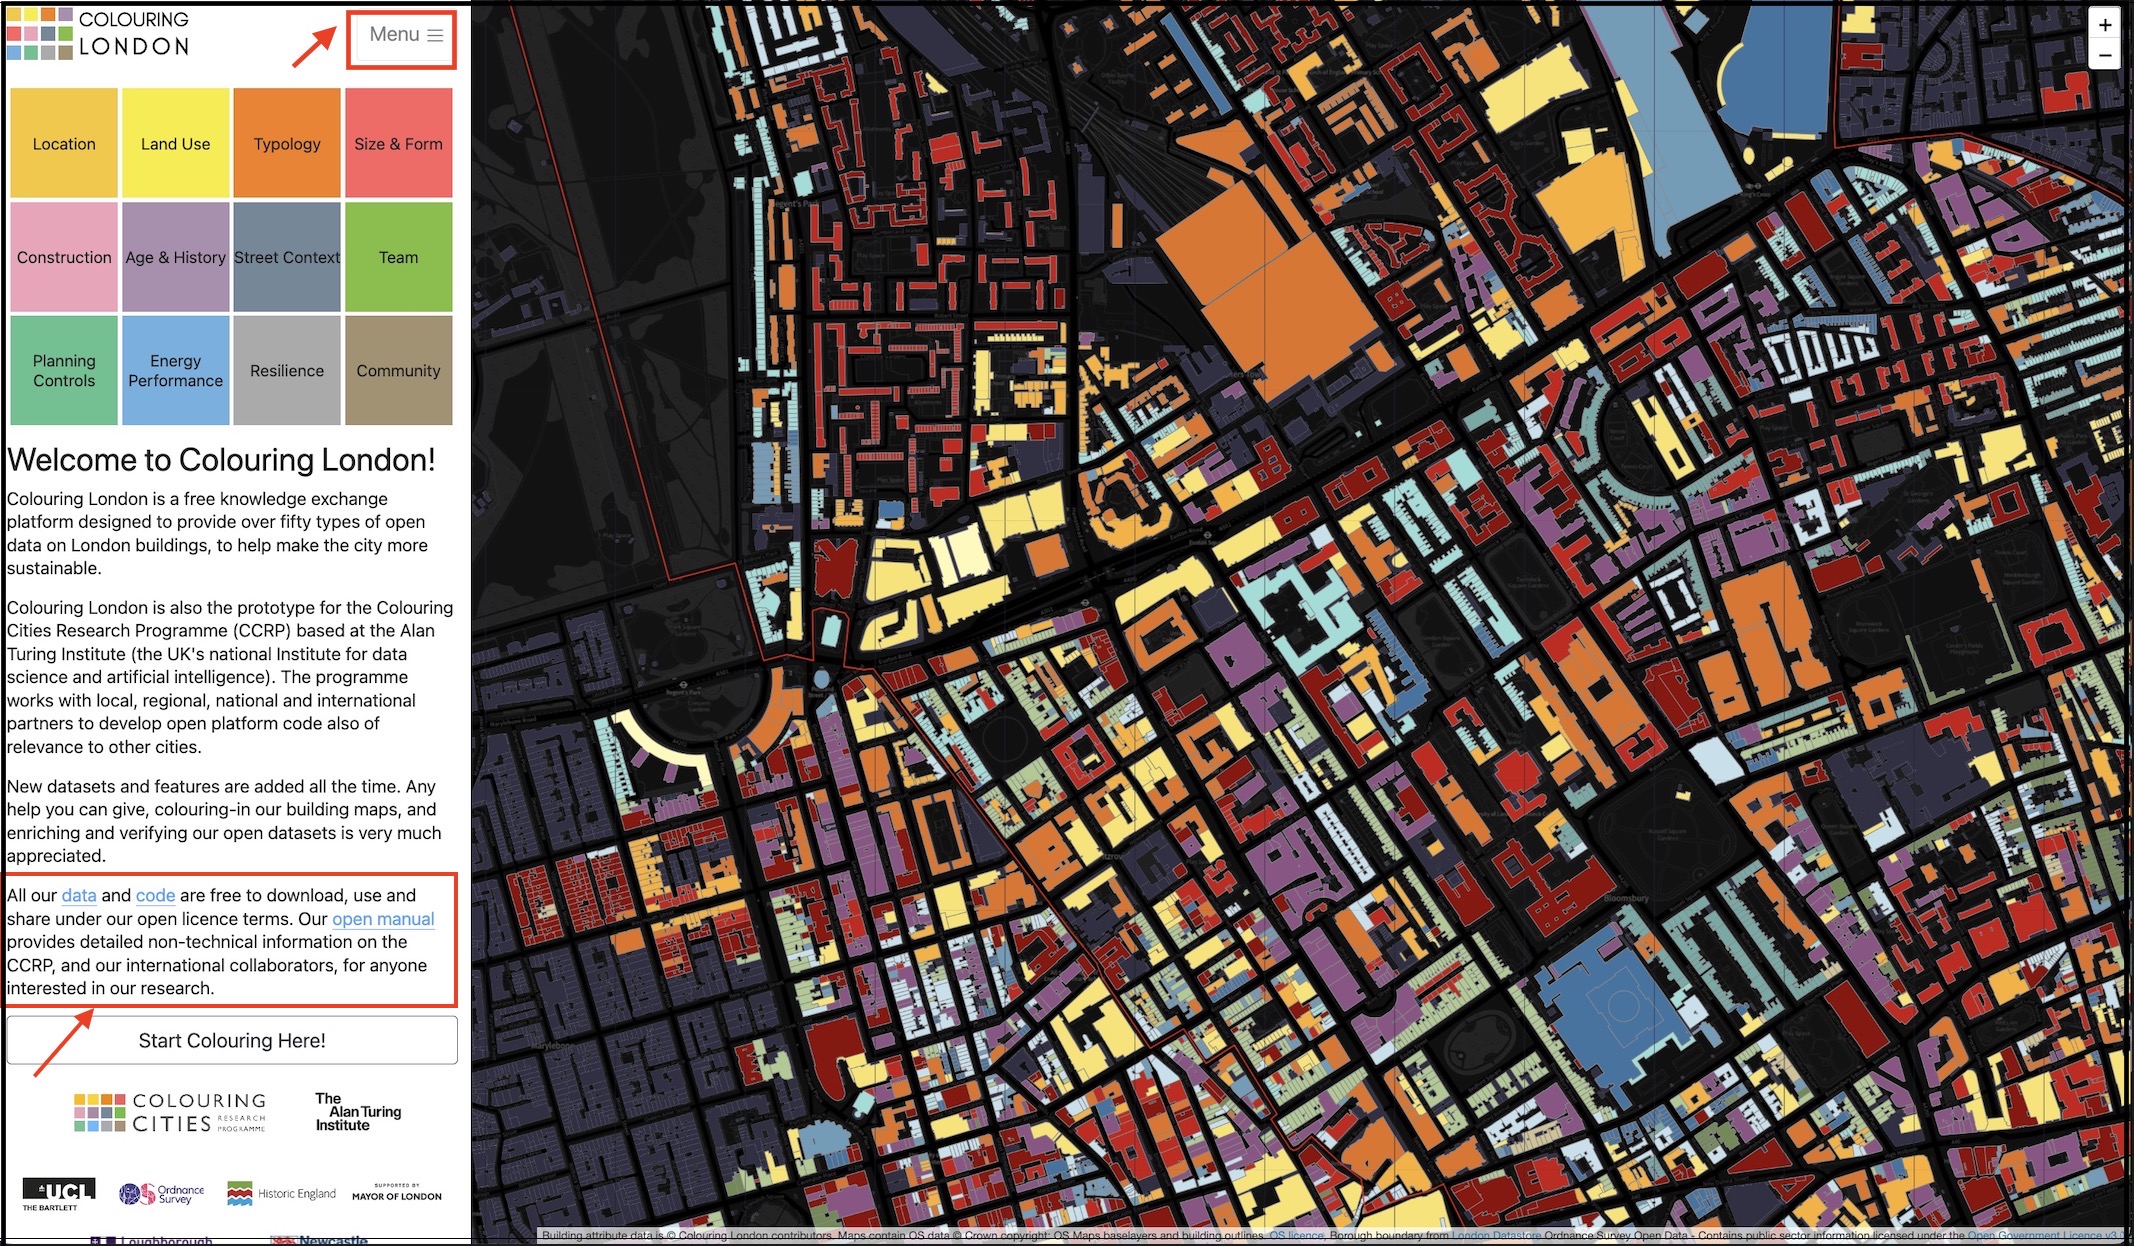
This brief introductory video also gives an overview of navigation.
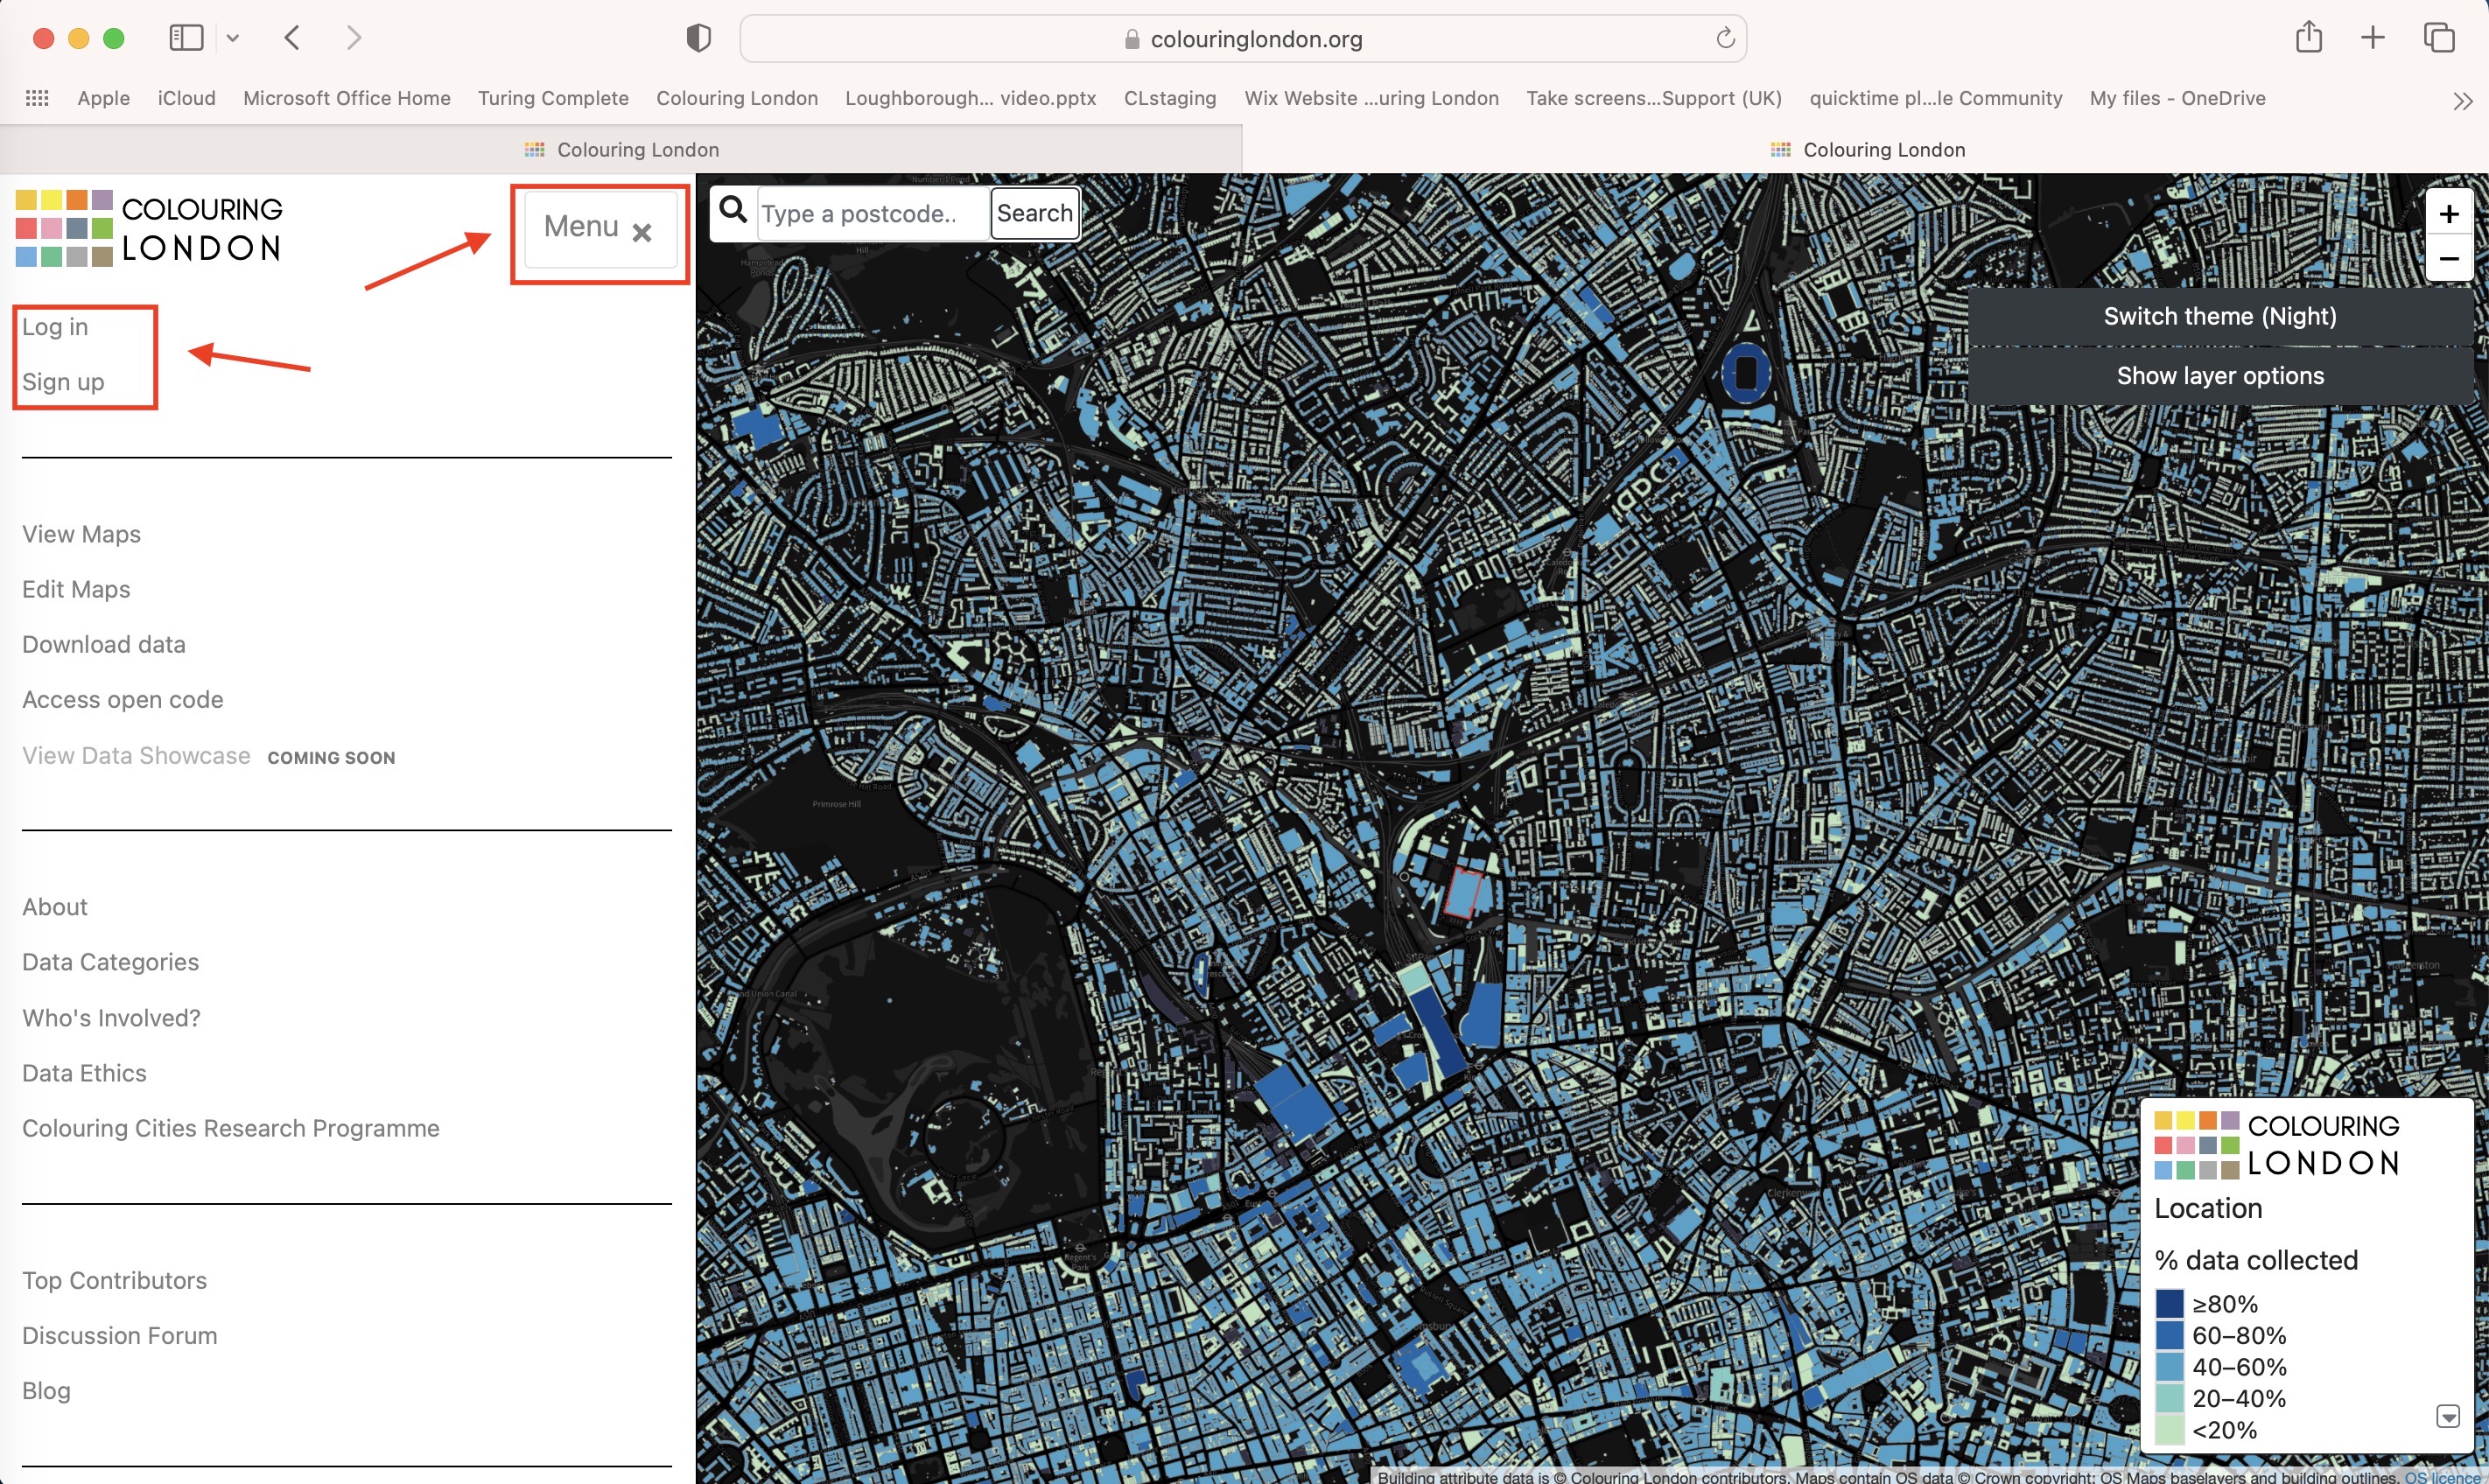
2.0. Sign-up to help add and check data, or just view our open data direct.
If you would like to add or edit data edit you can click on the Menu sign-up button and create an account at any point, though you don't need to sign-in to view our maps and open data. We avoid collection of personal data wherever possible, and you currently only need to give us your email and agree to editing protocols if you want to be able to reset your password. Your username (real or anonymised) will be included on our leaderboard thanking you for the number of contributions you have made.
3.0. Search for a building, zoom out to see the whole of London, changing the map background and using layer buttons.
To search for a postcode in the search box at the top of the map and zoom in and out using the plus and minus buttons. You can change the background from dark to black - the light background is generally better for editing and the dark better for viewing data at city level.
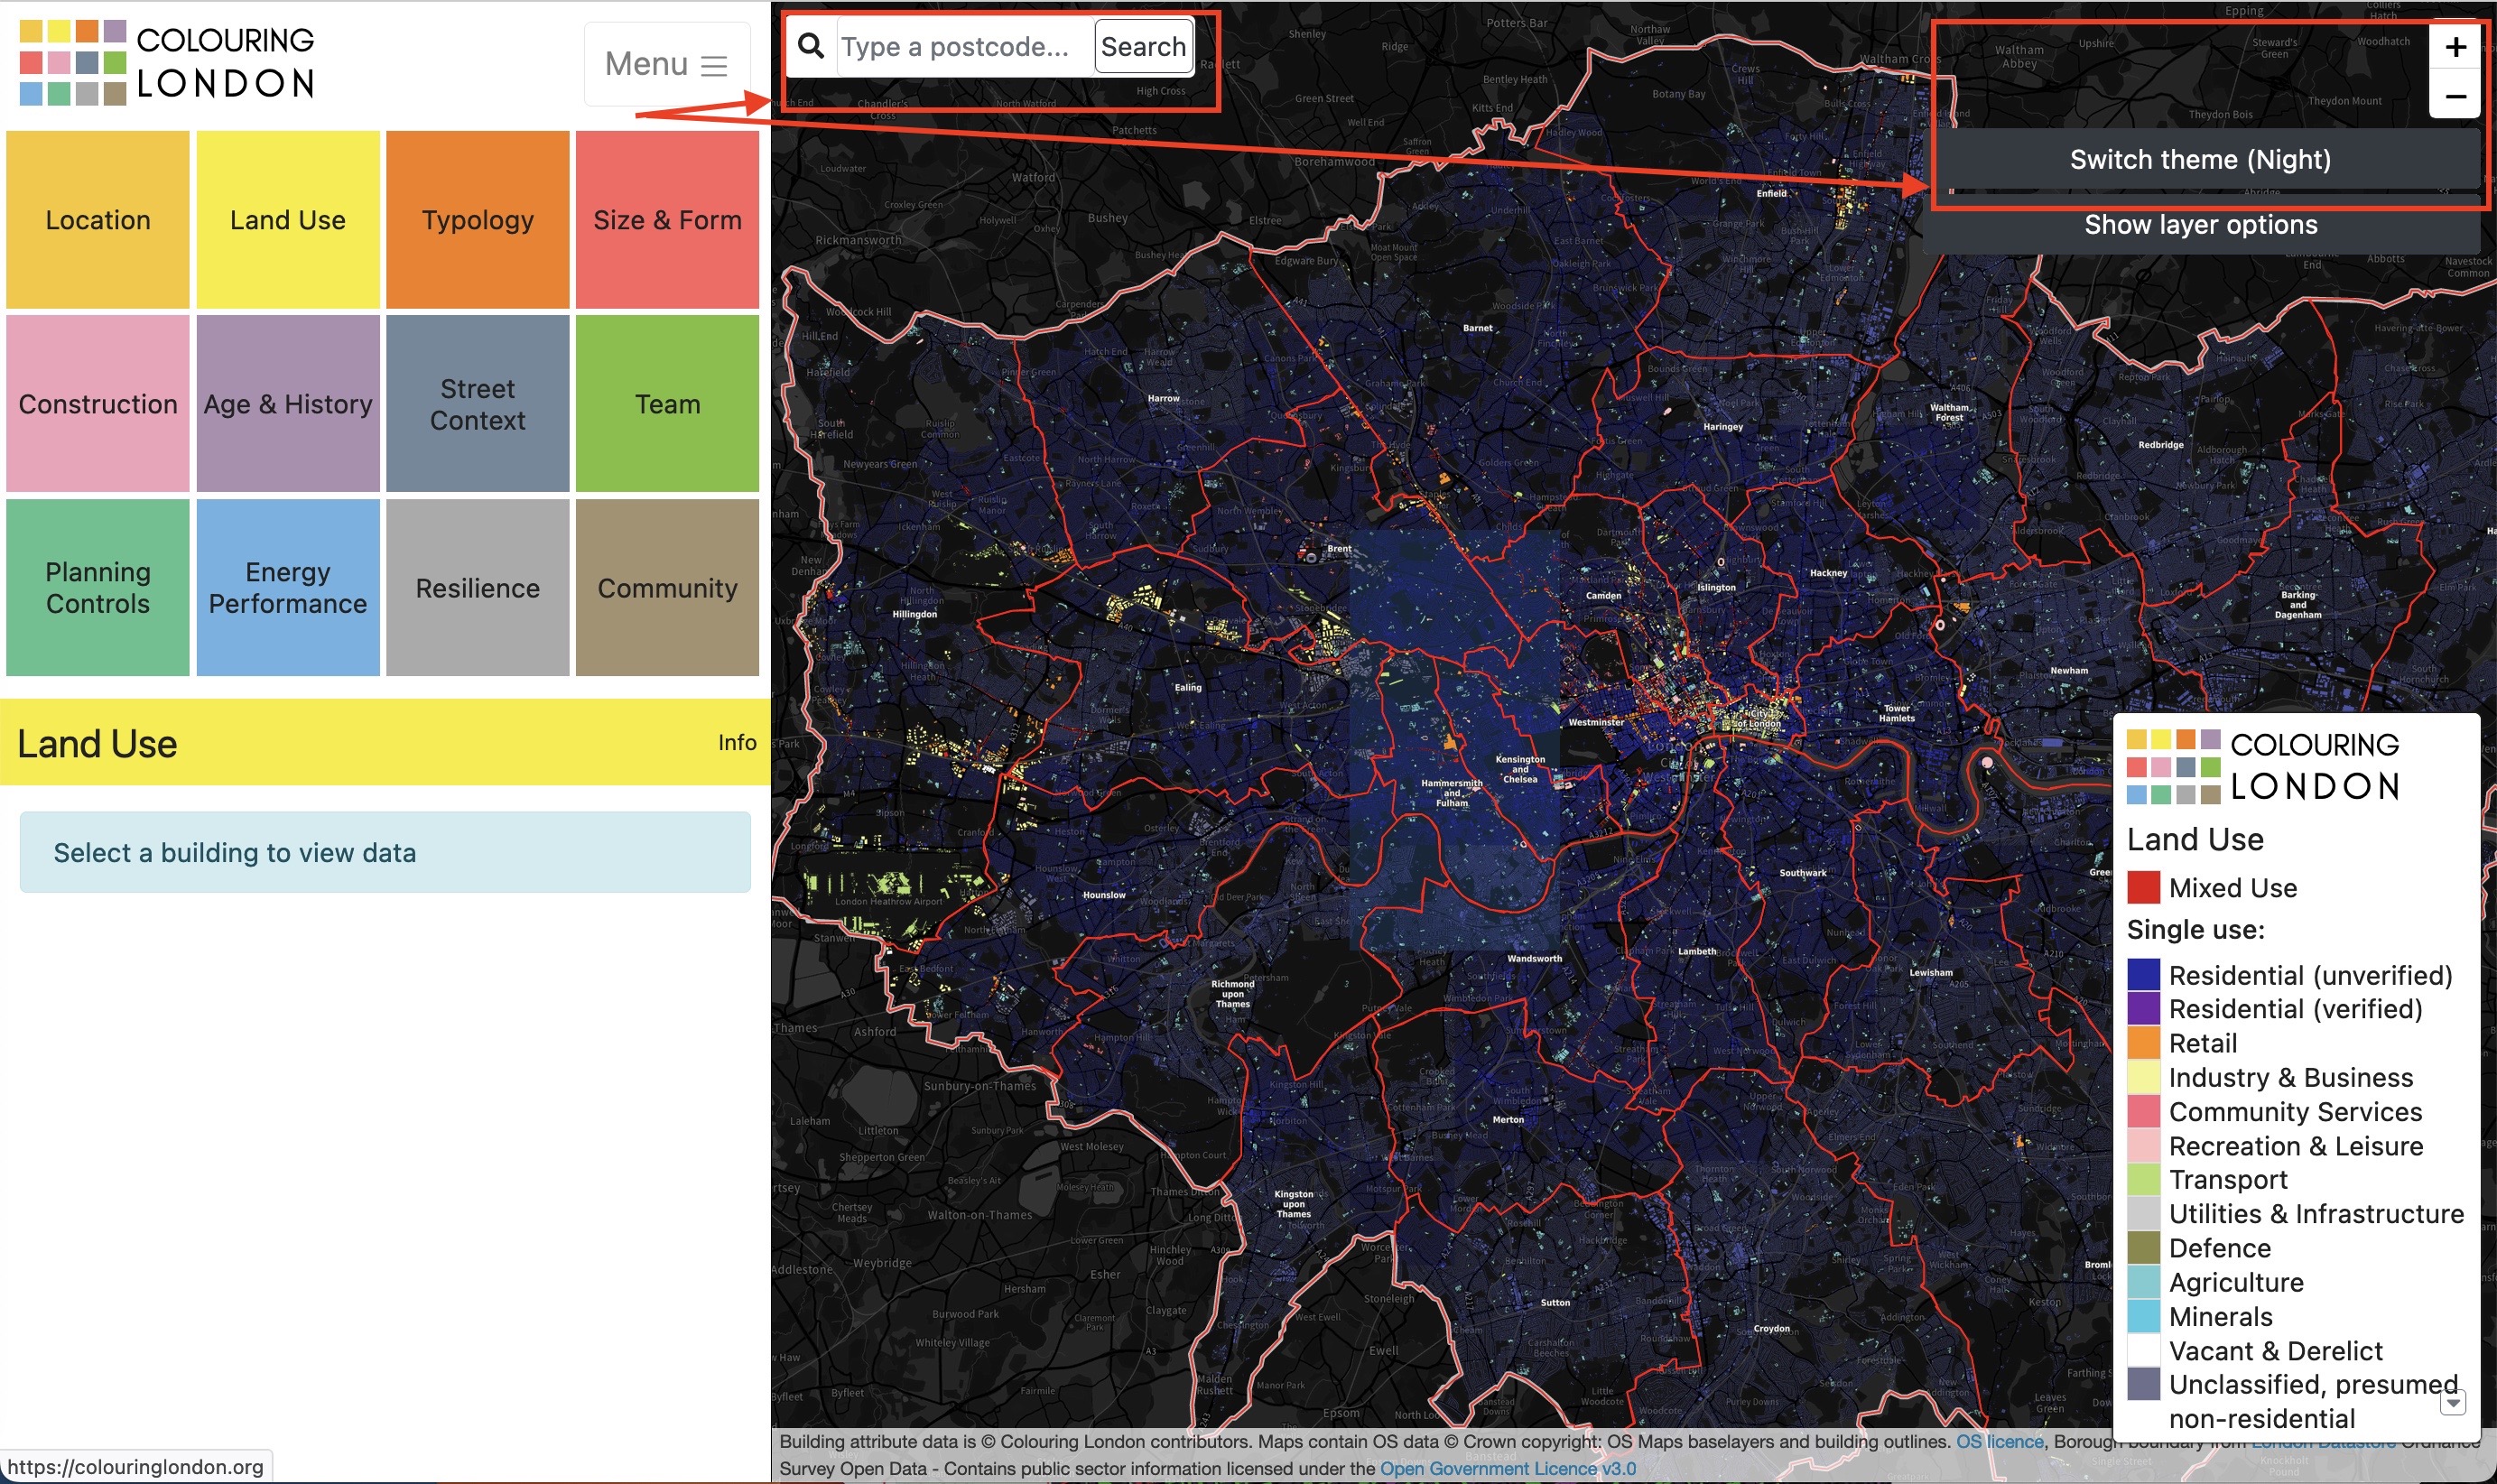
You can also click the 'Show Layer Options' button to bring up data layer options. (These are also accessible via the 'Planning Zones' and ' Heritage assets and Protected Buildings' sections). The dropdown button on the map keys when shown, provides additional data visualisation layers. Click the clear layer option at the top of the layer list to clear all layers or click the layer button again to turn it off.

4.0. Adding data - general tips
This section provides general tips for adding data to any category
-
Click on one of the 12 categories, then click on a building footprint and select a subtitle of interest.
-
A series of questions will appear.
-
If an answer has been entered either click the green 'Verify' button to confirm it is correct, or click on the edit button (which is also shown as a brush) to add new information. The information you are replacing will not be lost and can be accessed by clicking the 'Edit History' button).
-
Once you have entered your answer click save.
-
Choose a source type and a source link if applicable.
-
If you make a mistake or wish to change your entry after you have saved just repeat the process with new information.
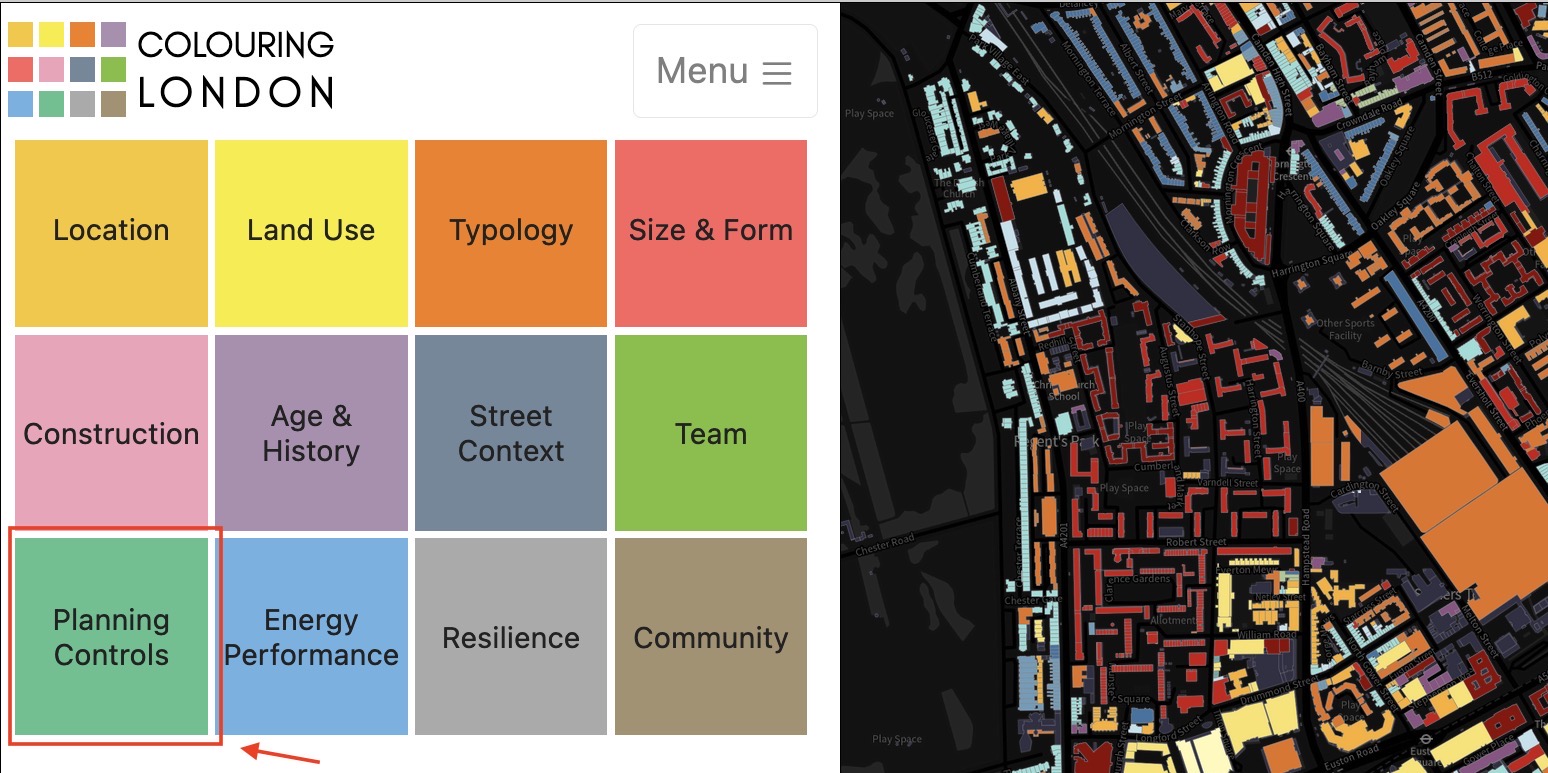
5.0. Using the Planning Controls section
This section shows you how to use the Colouring London prototype's Planning Visualisation Tool and its Planning section. Design and production of this iteration of the open source tool was undertaken by The Alan Turing Institute in collaboration with Loughborough University and funded by the UK's Engineering and Physical Research Council via a Loughborough University Enterprise Projects Group grant.
5.1.To view the planning section click on the green 'Planning Controls' button. Please note that the data may take some time to load and may be improved by moving to another zoom scale. We are working to see if we can improve loading time but you can feedback about this on our discussion thread https://github.com/colouring-cities/colouring-london/discussions.
5.2. Click on any building footprint to bring up all planning data options
The maps interface will show 'Planning application information' data as the default. This is the one of four planning data options.

5.3. Use the map key to identify the status of the planning application in the decision-making process
5.4. Select 'Current planning applications' for applications submitted and decided on within the last year
The 'Current application' section (and the 'Past application' section) visualise planning data streamed from the Greater London Authority's Planning London Datahub. 'Current applications' are classified within Colouring London as where the local authority decision date, and its application registration date, are less than one year old.
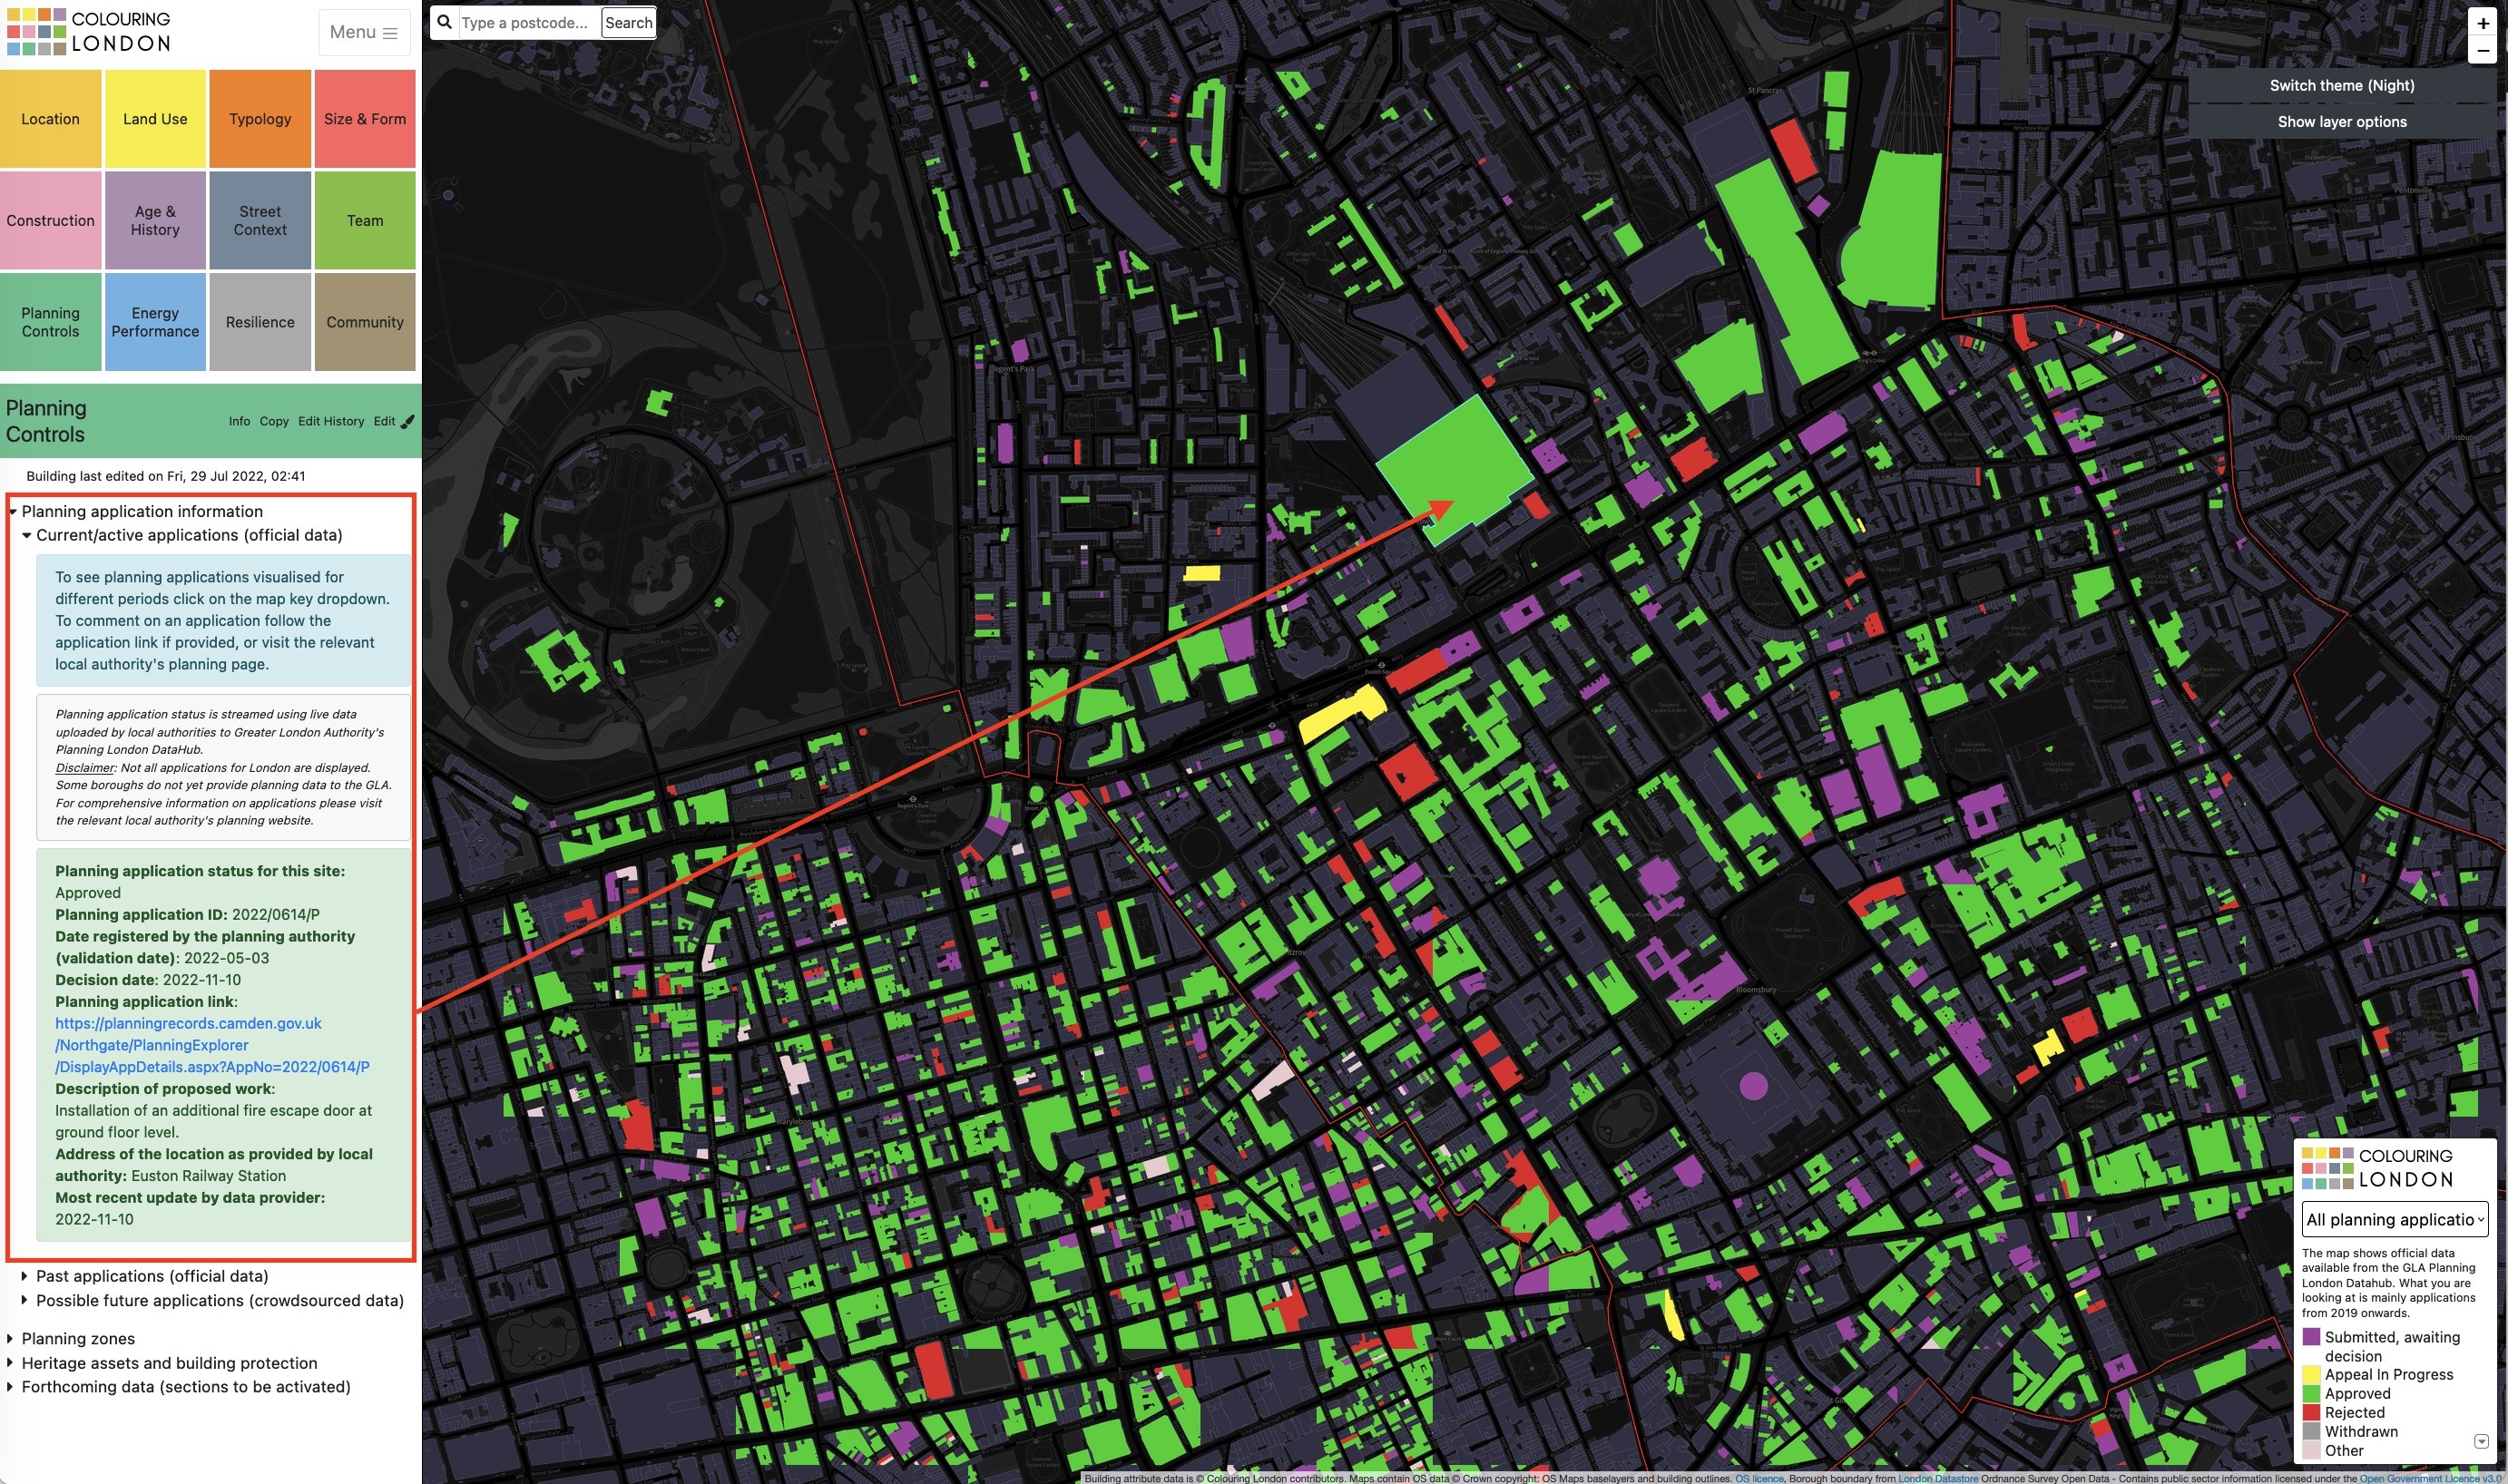
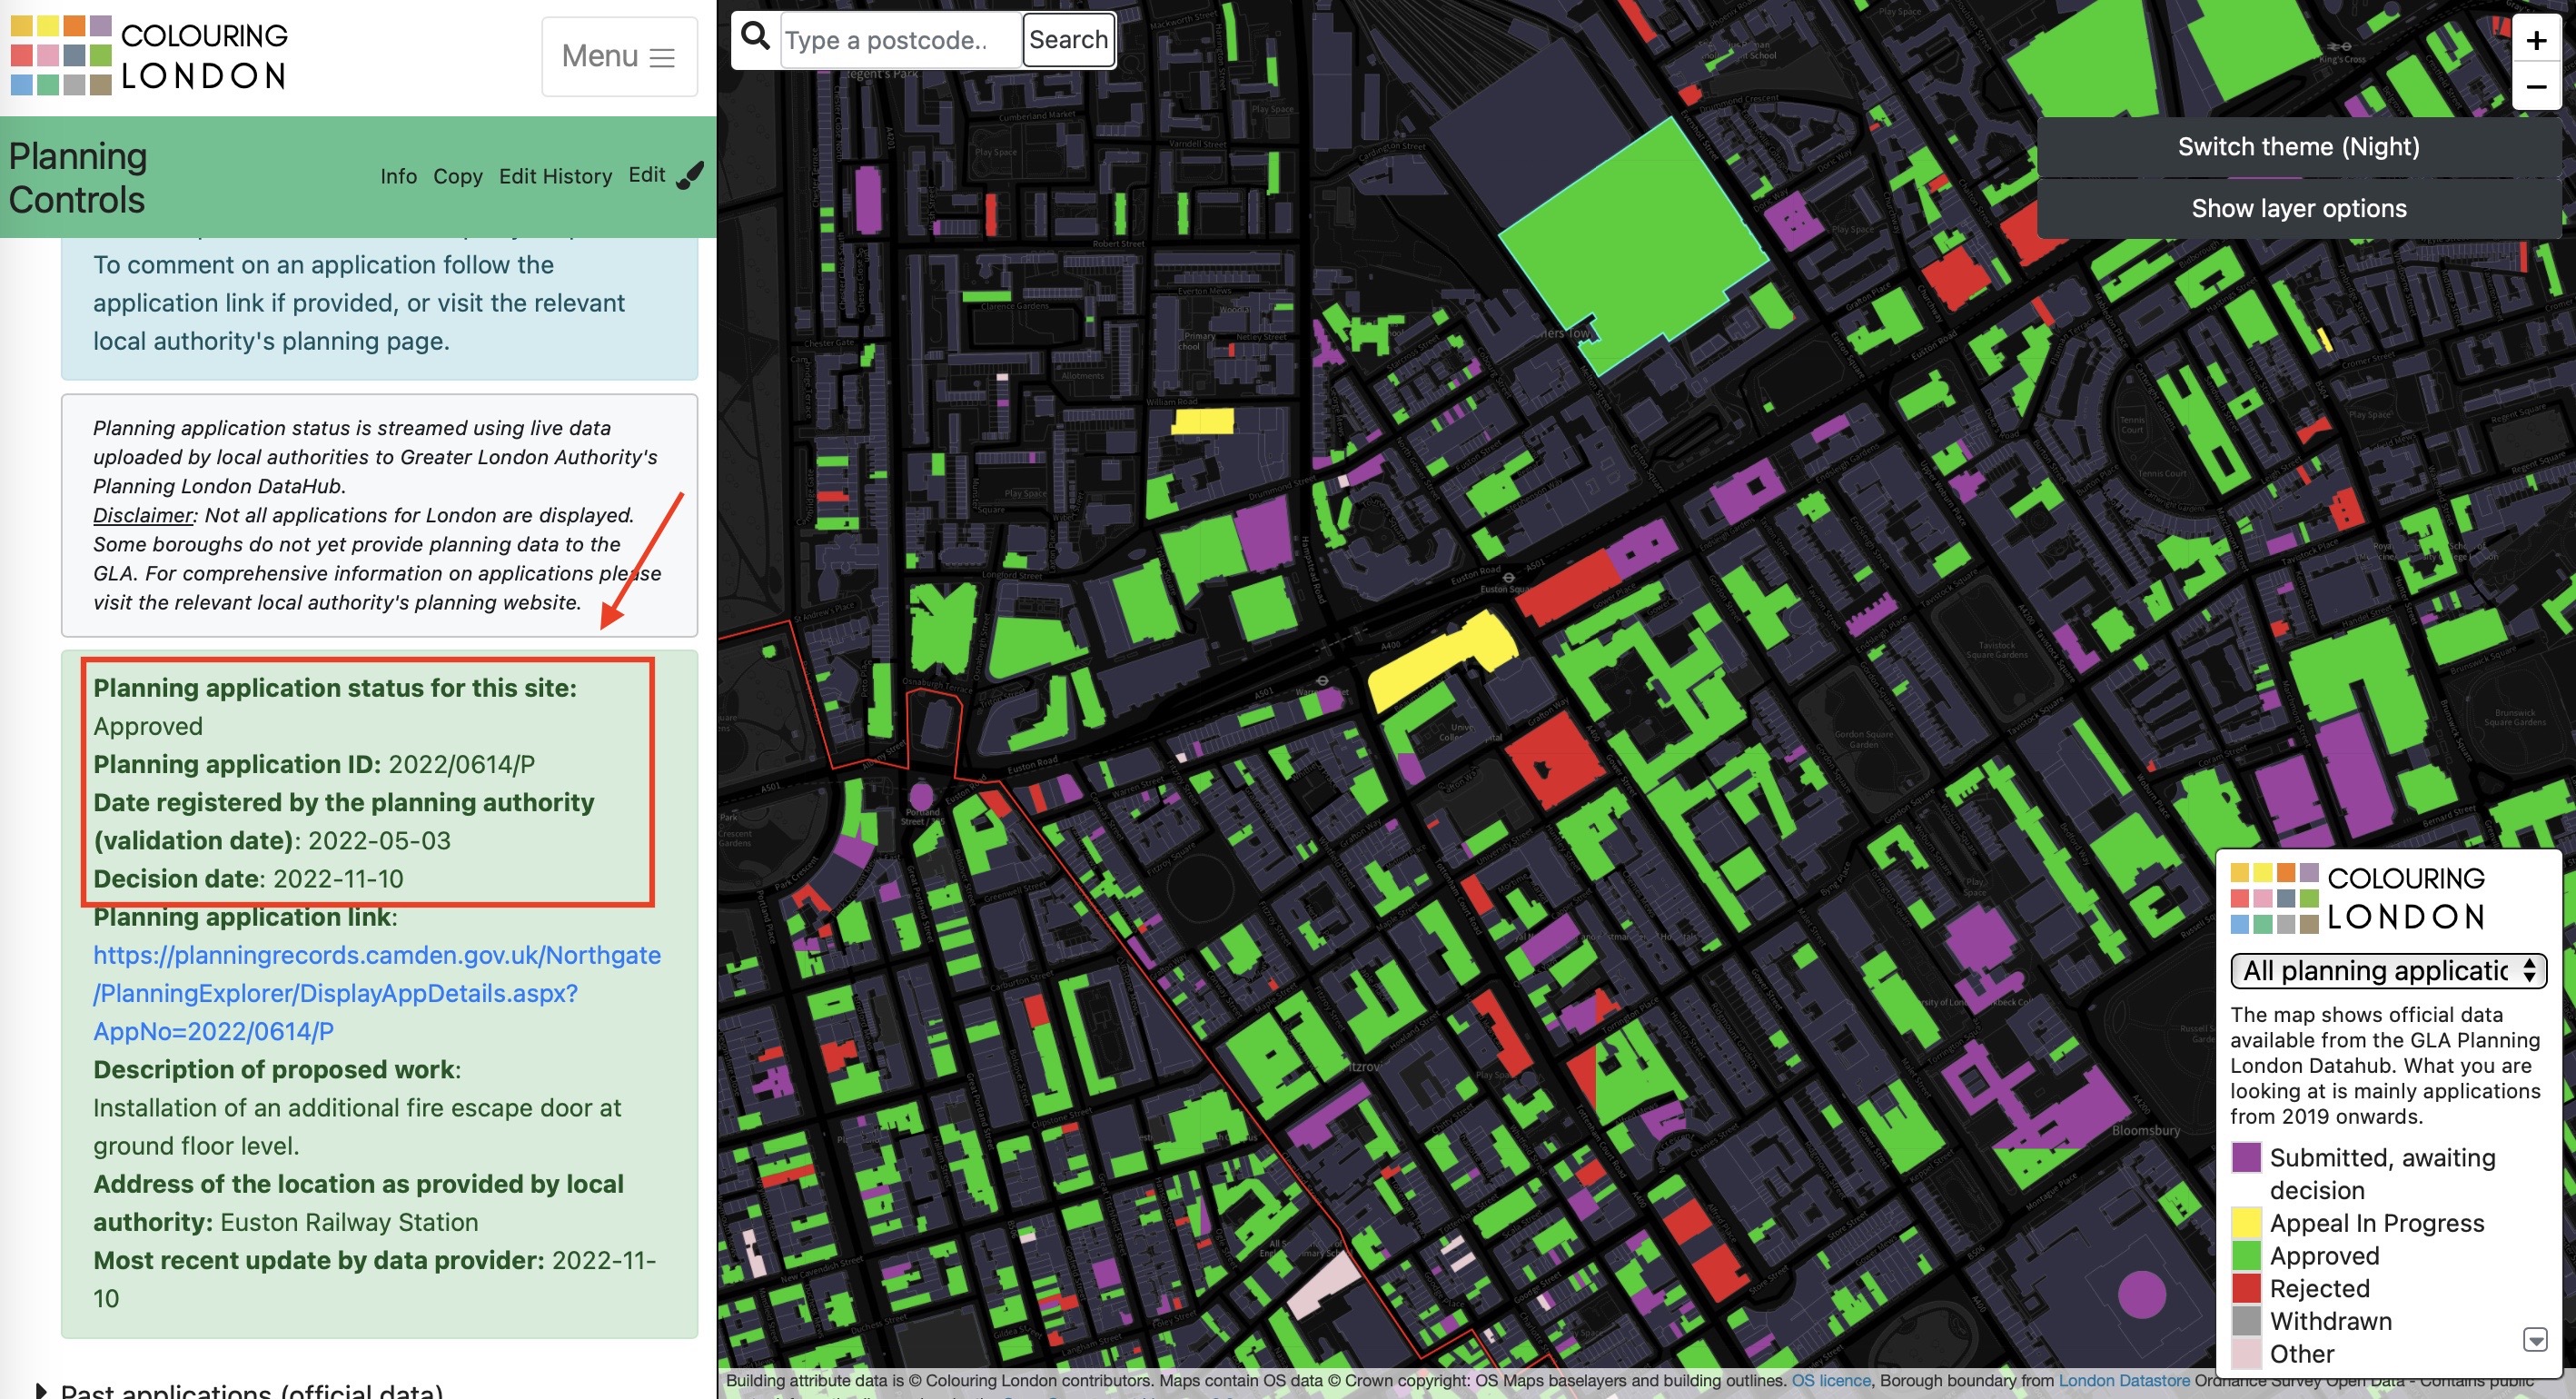
See here for information on the Application Status, Application ID, Date of submission and date of decision, if available.
See here for direct links to planning applications. Please note these are not always provided by local authorities.
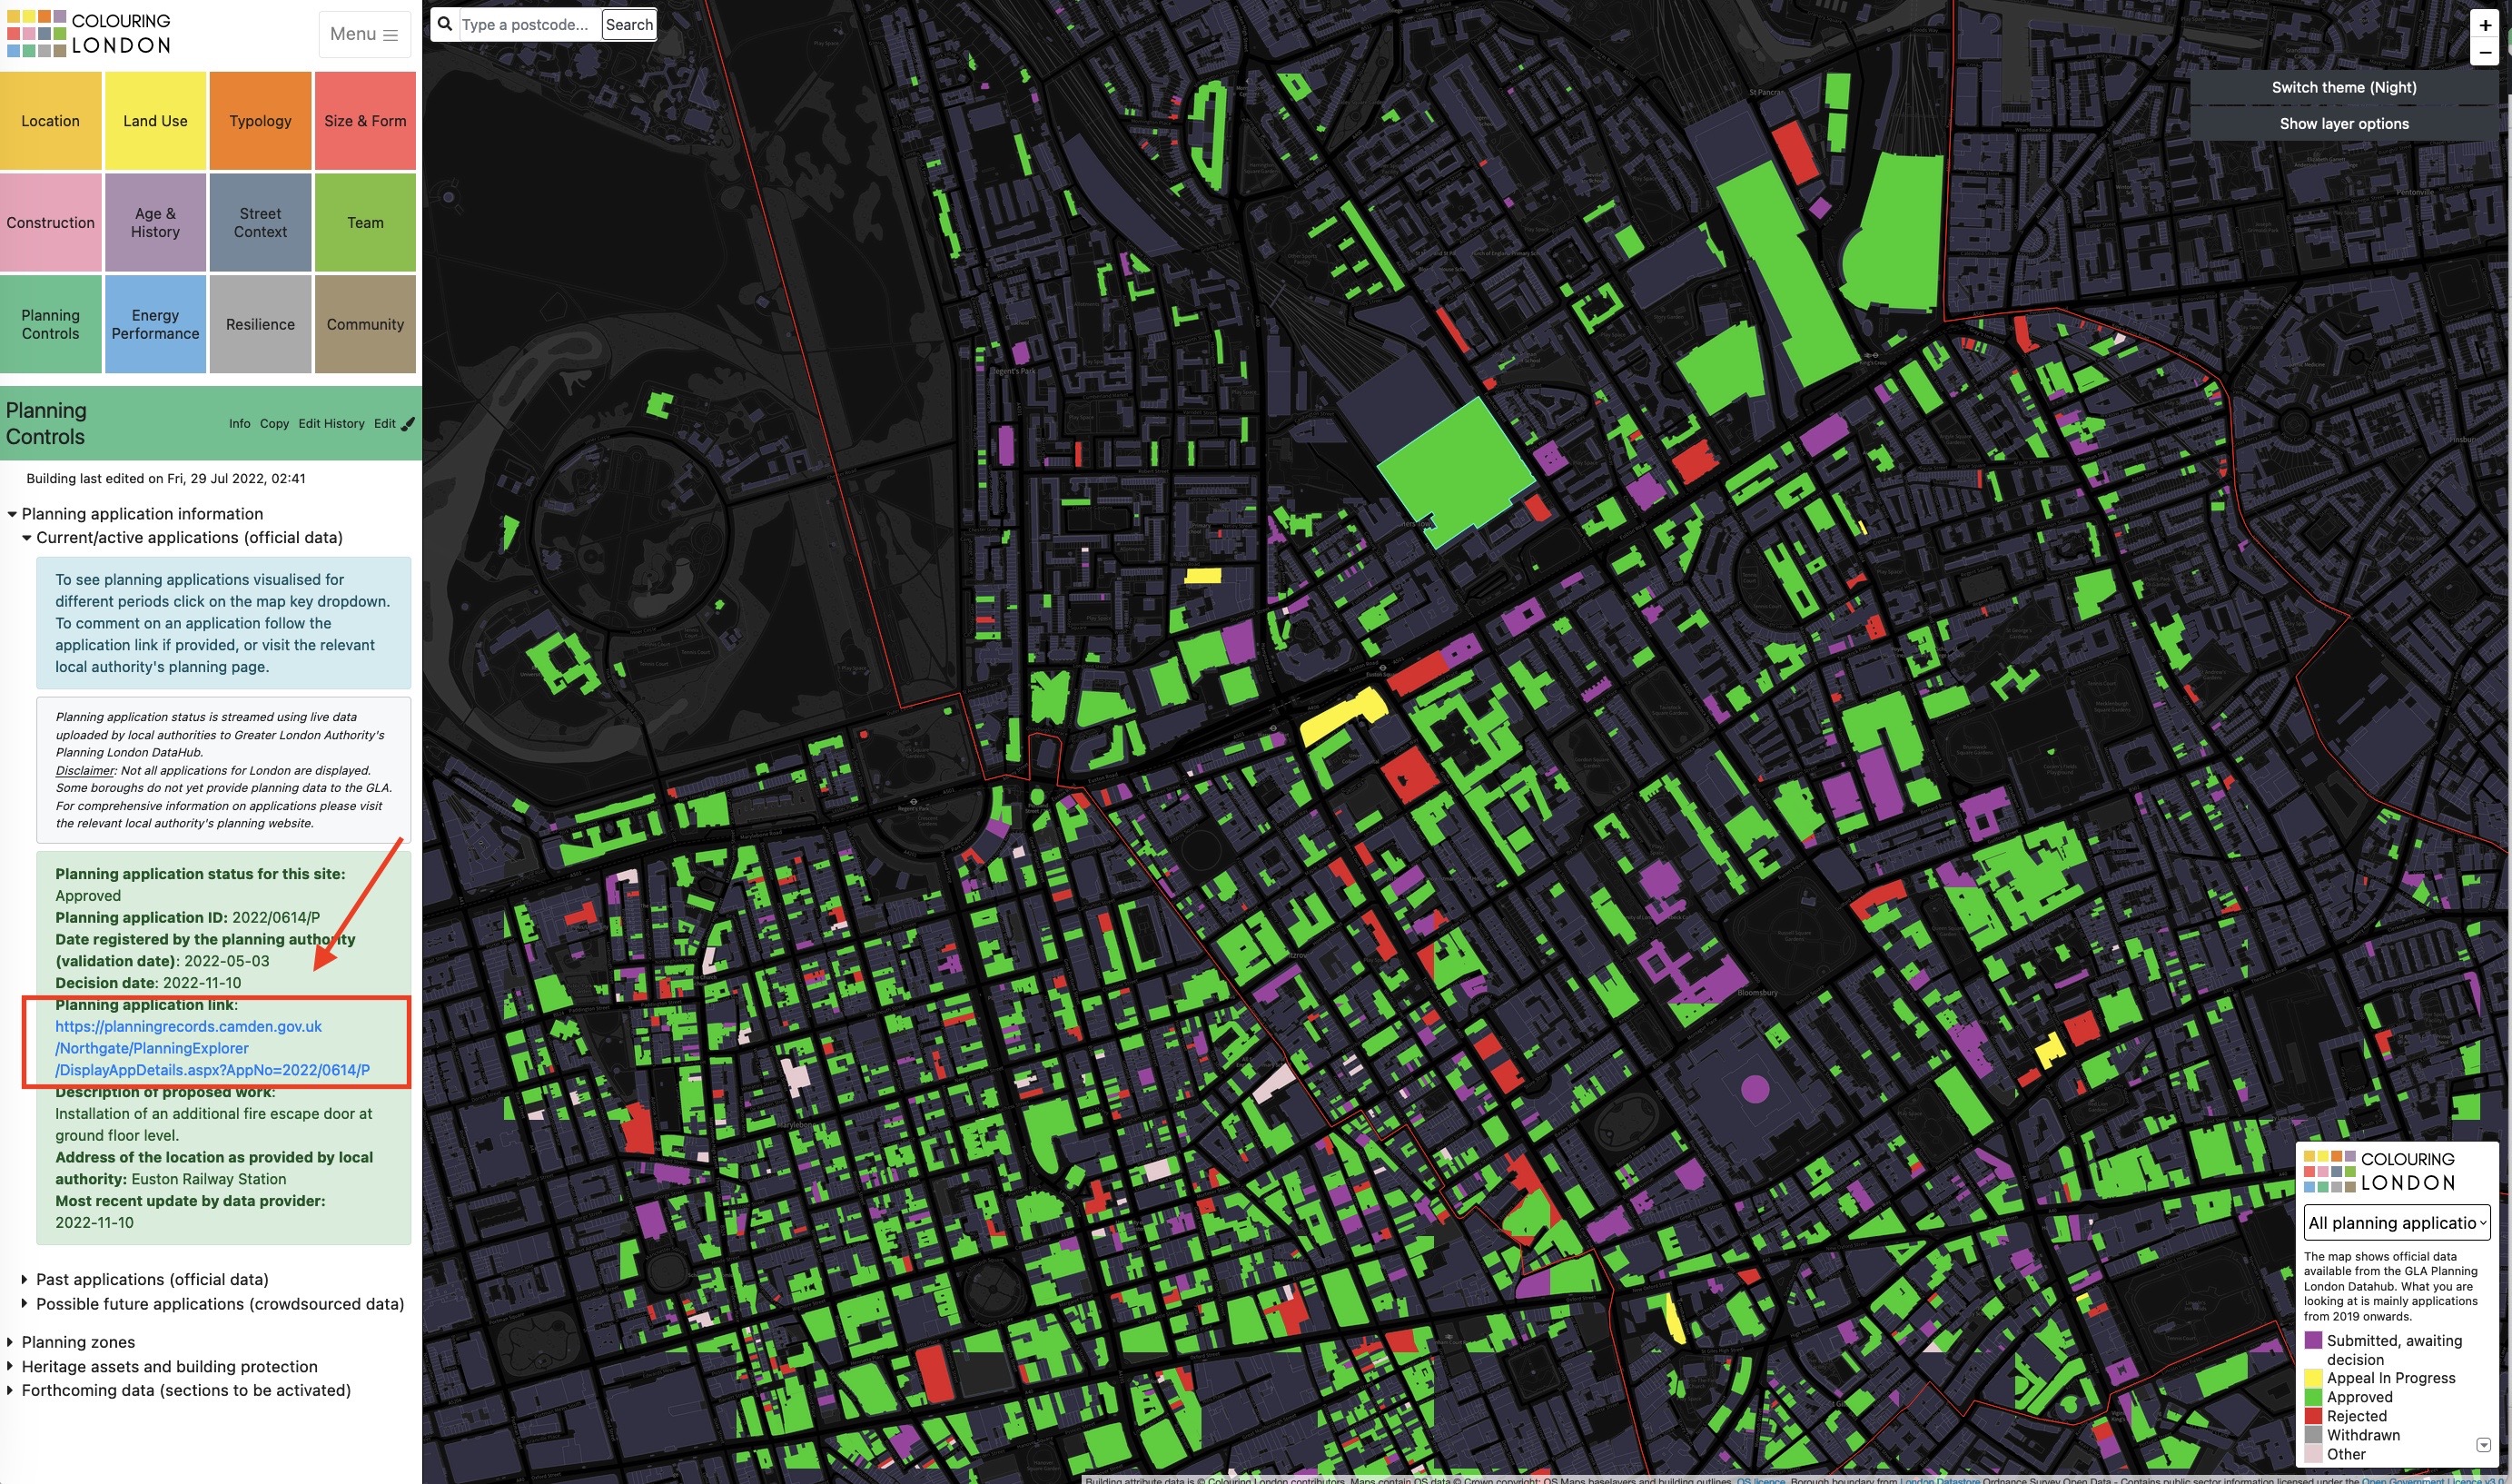
When the link is clicked the relevant local authority planning webpage will open in a new window.
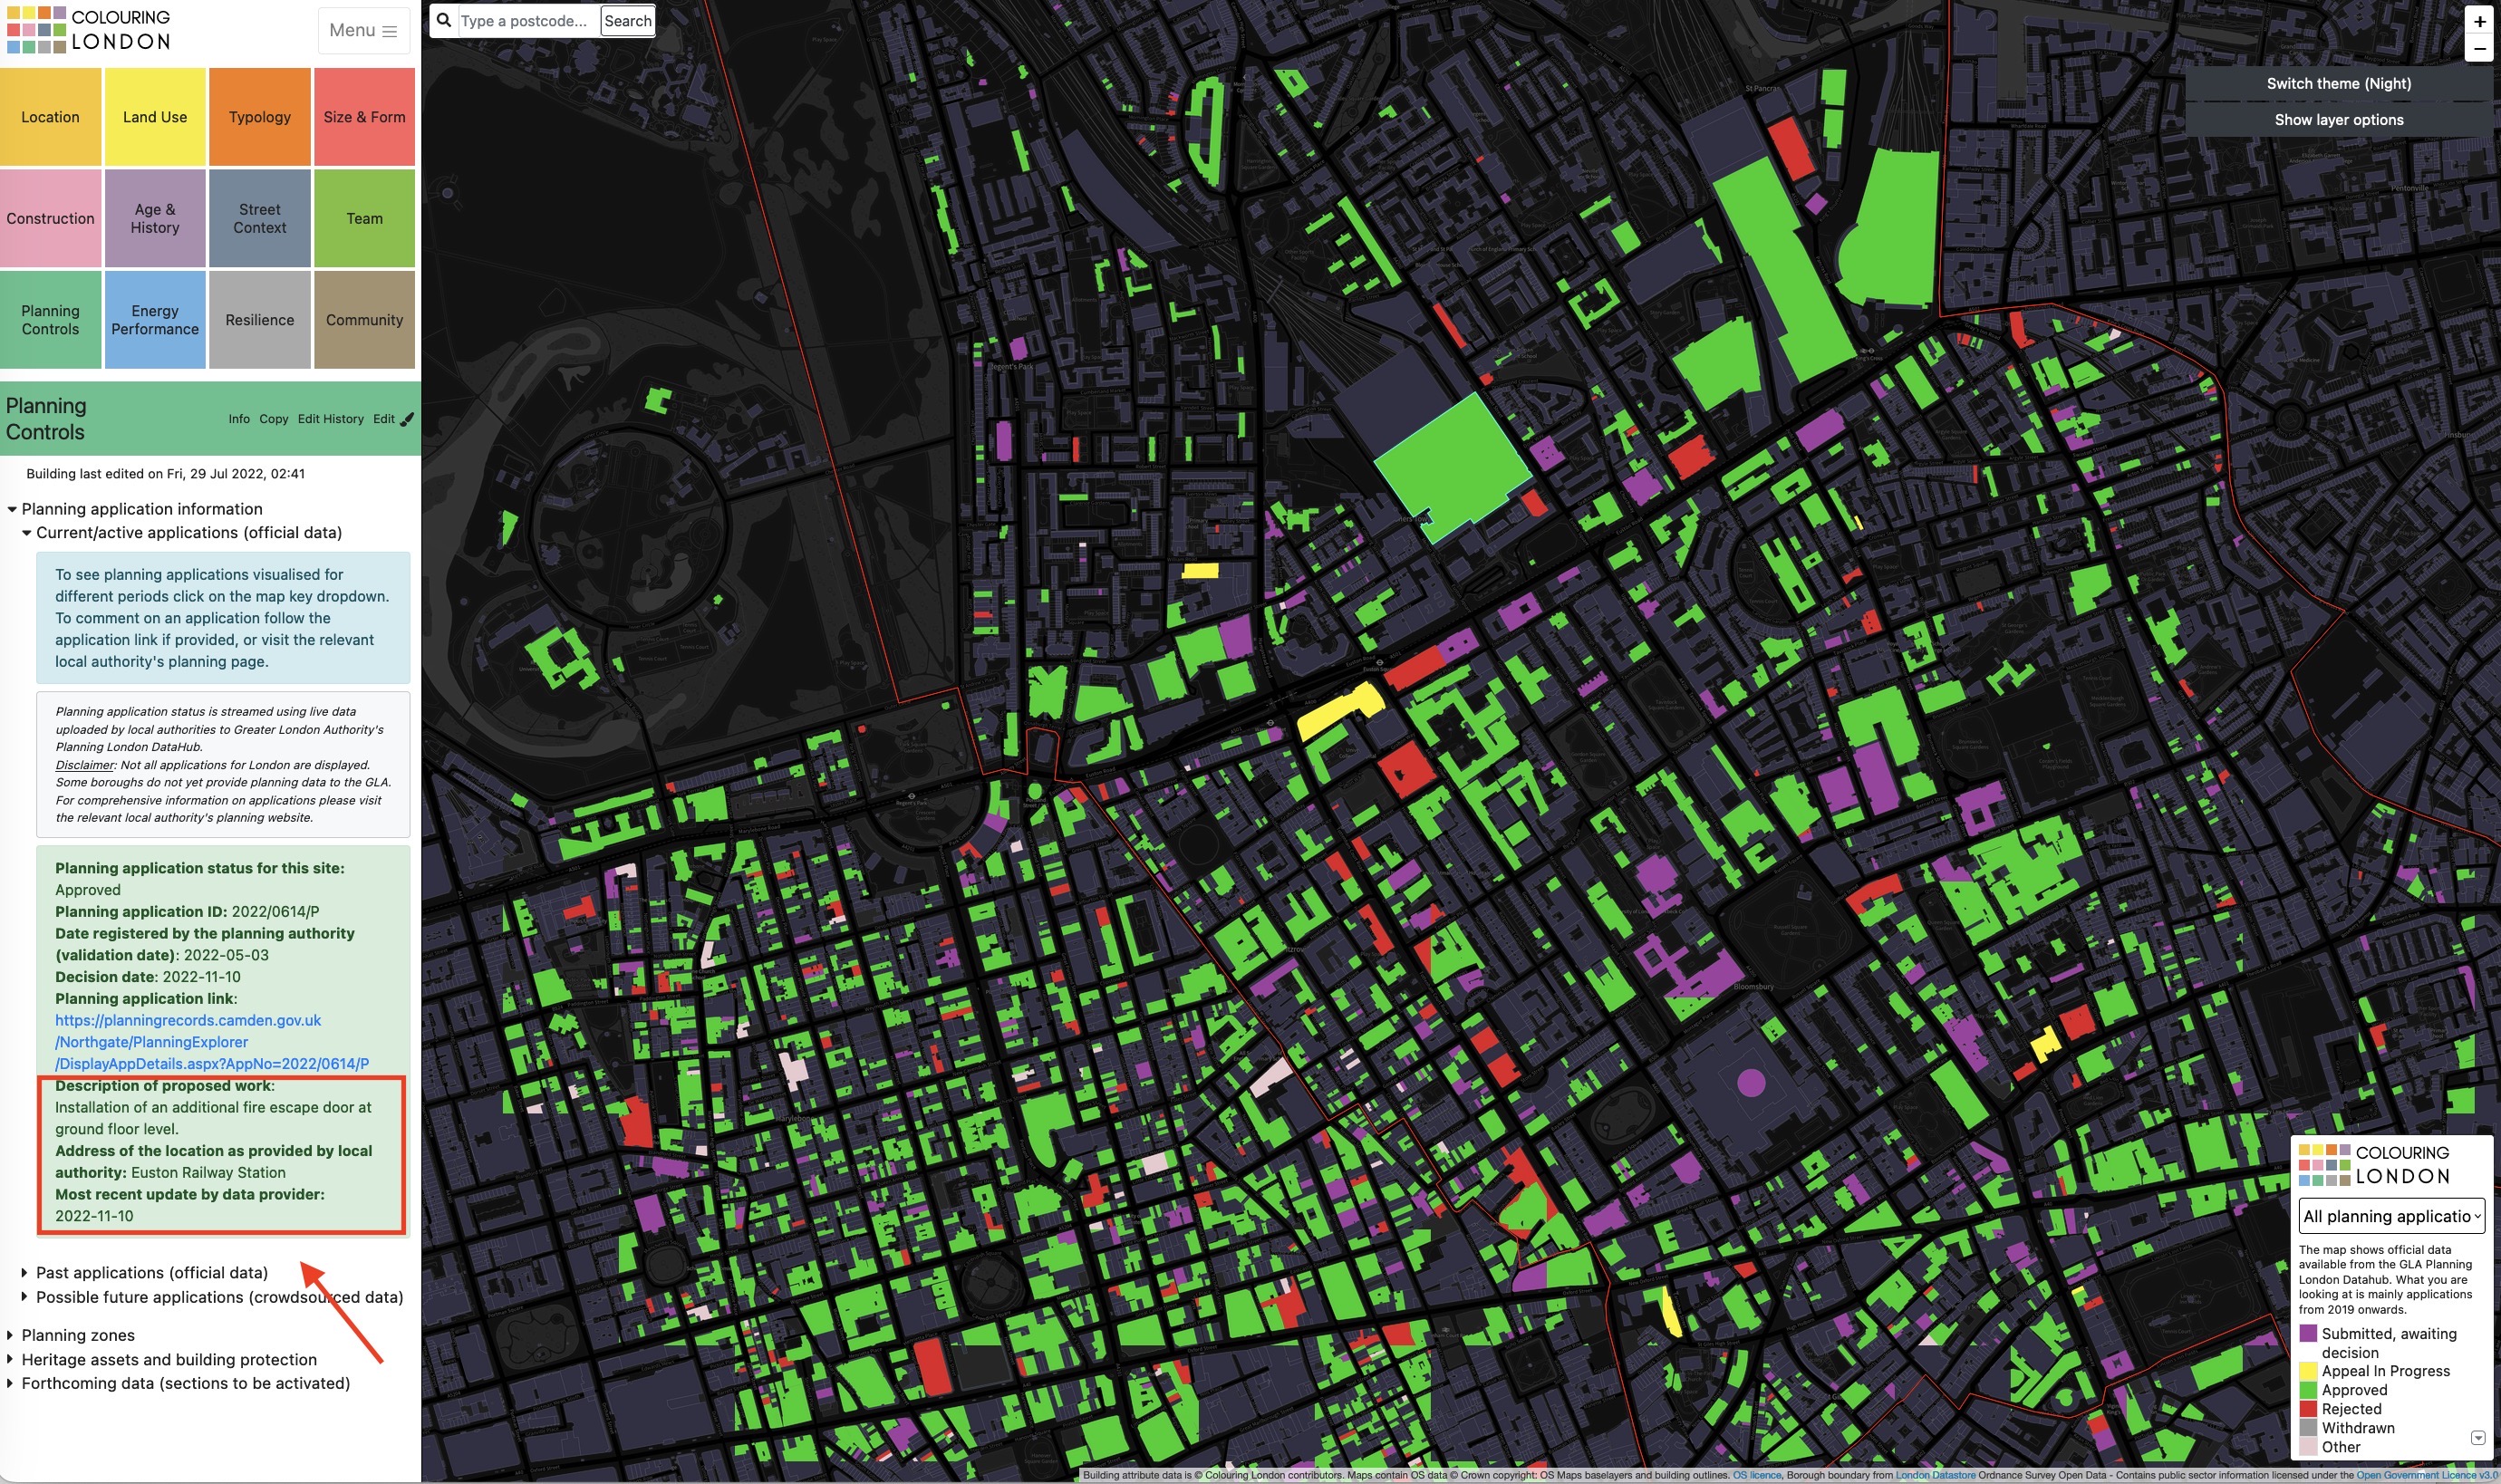
See here for a summary description of the works proposed, address of the property and the date of most recent data updates from the local authority.
5.5. Click 'Past Applications for applications with a decision or registration date older than 12 months.
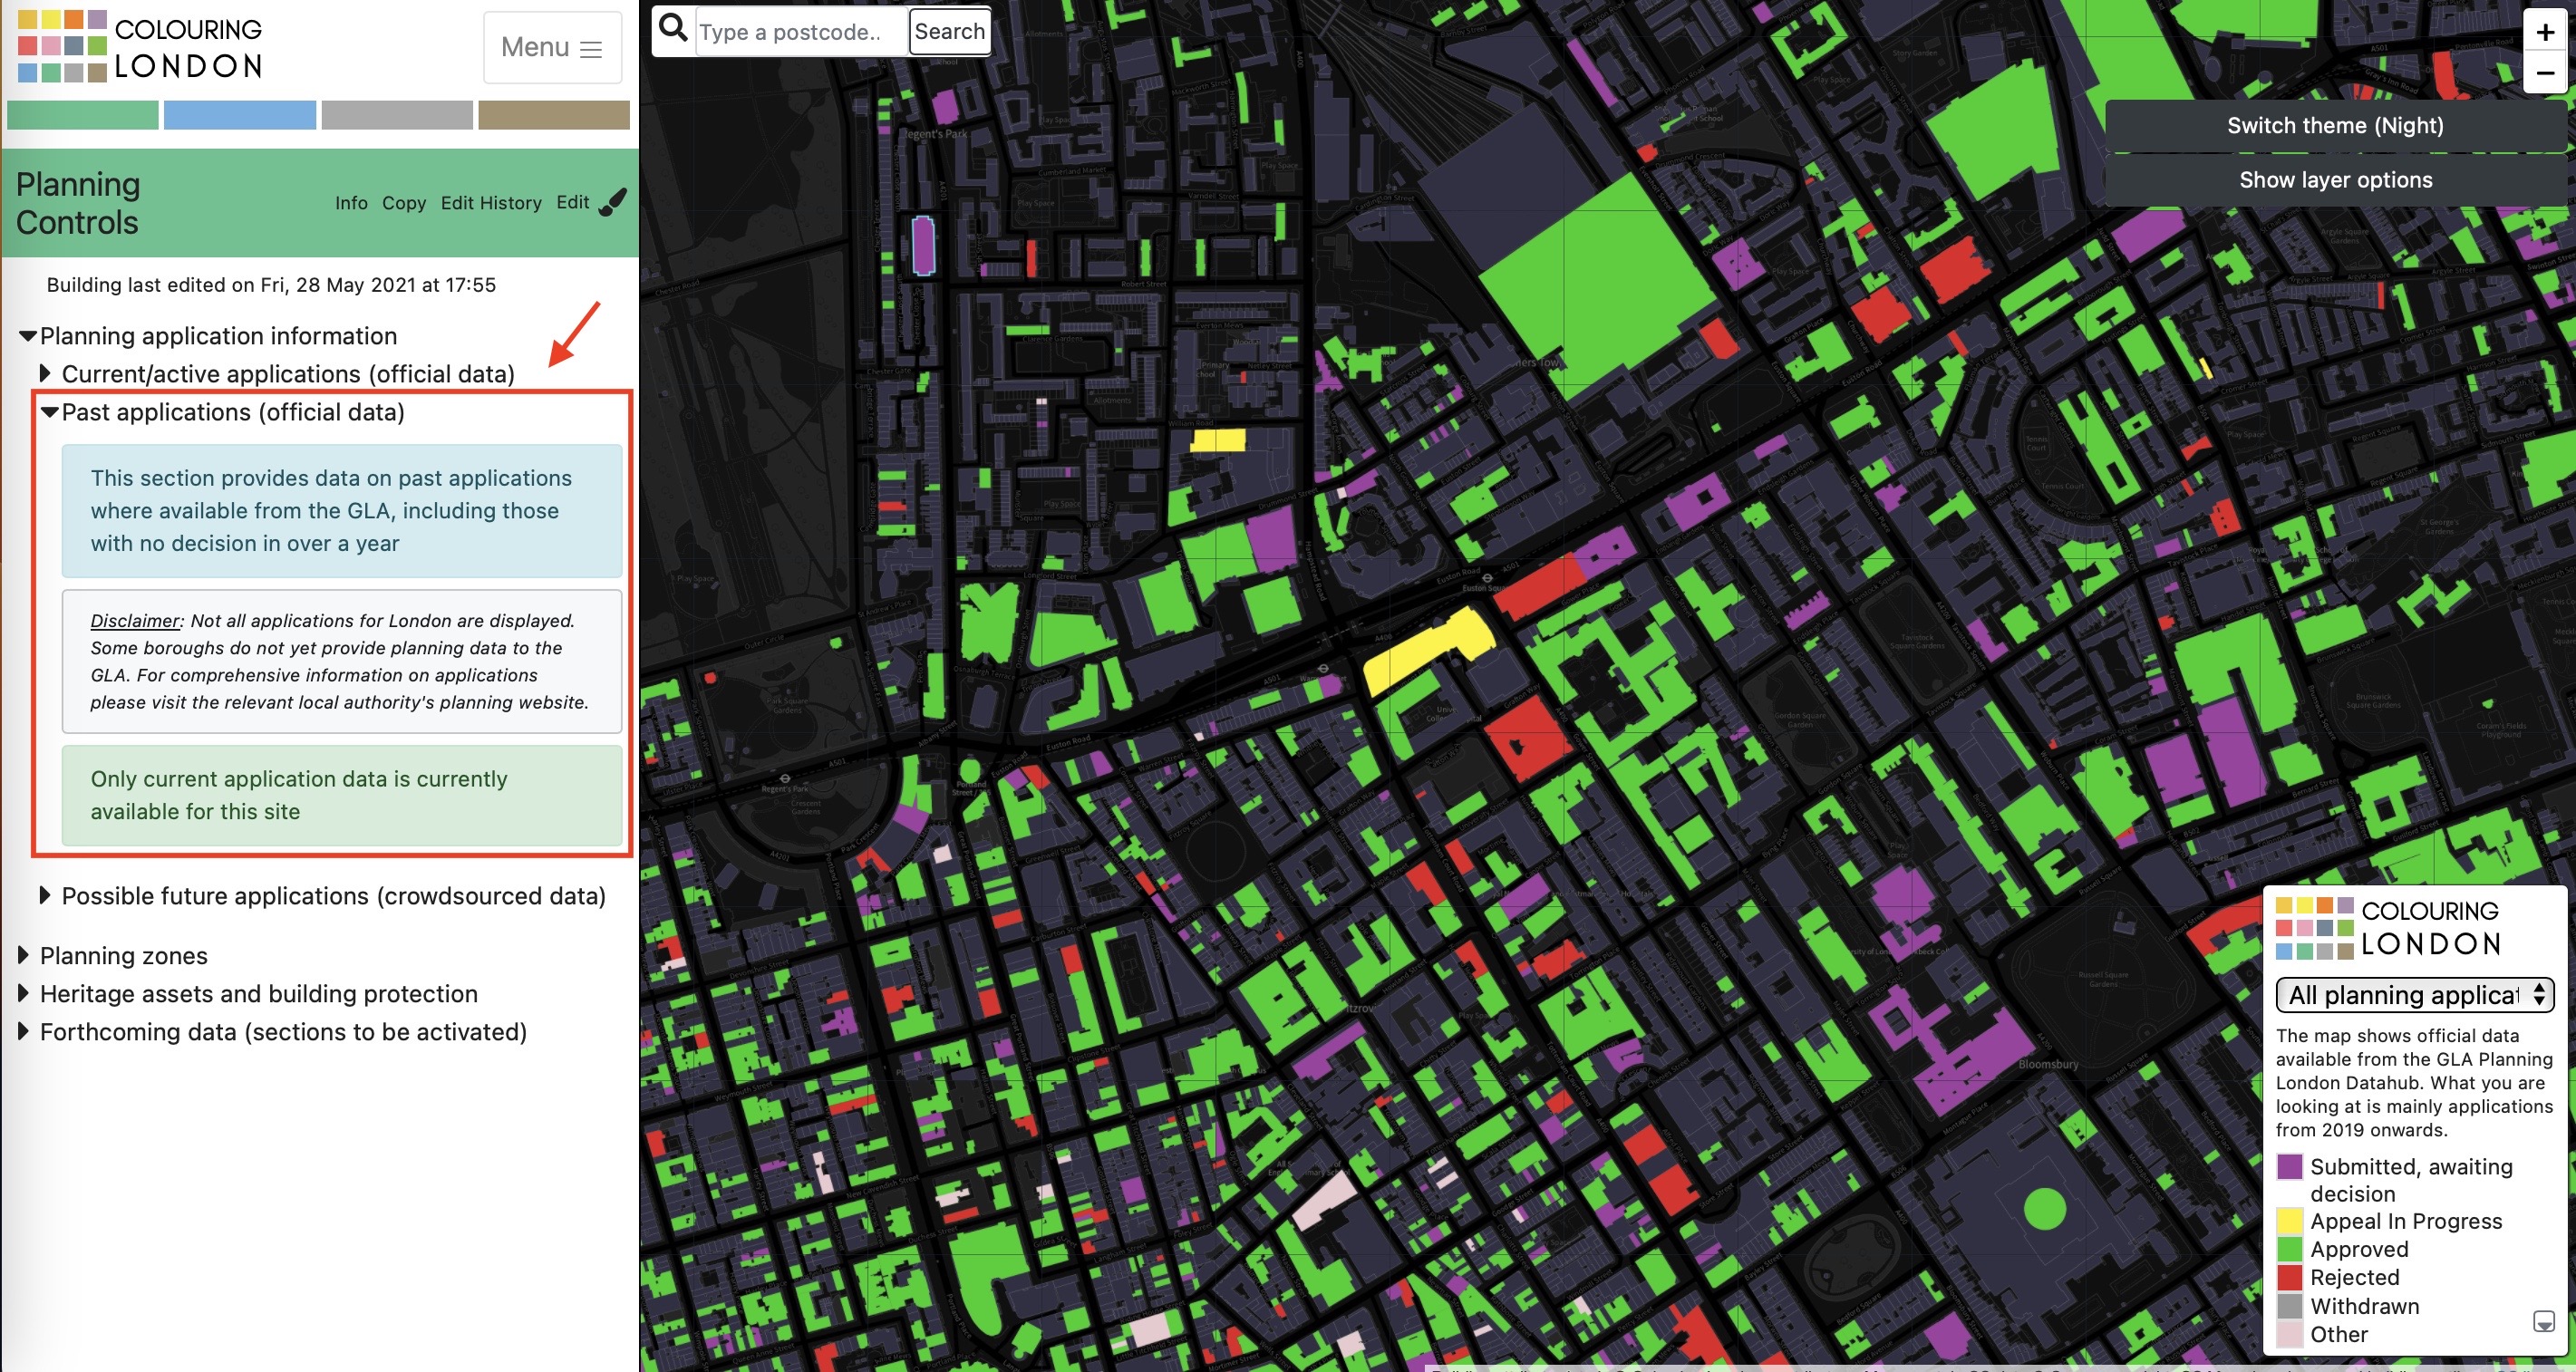
5.6. To view applications for different time periods on the map click the down-arrow on the map key to bring up options
- Option 1: View all applications current and past

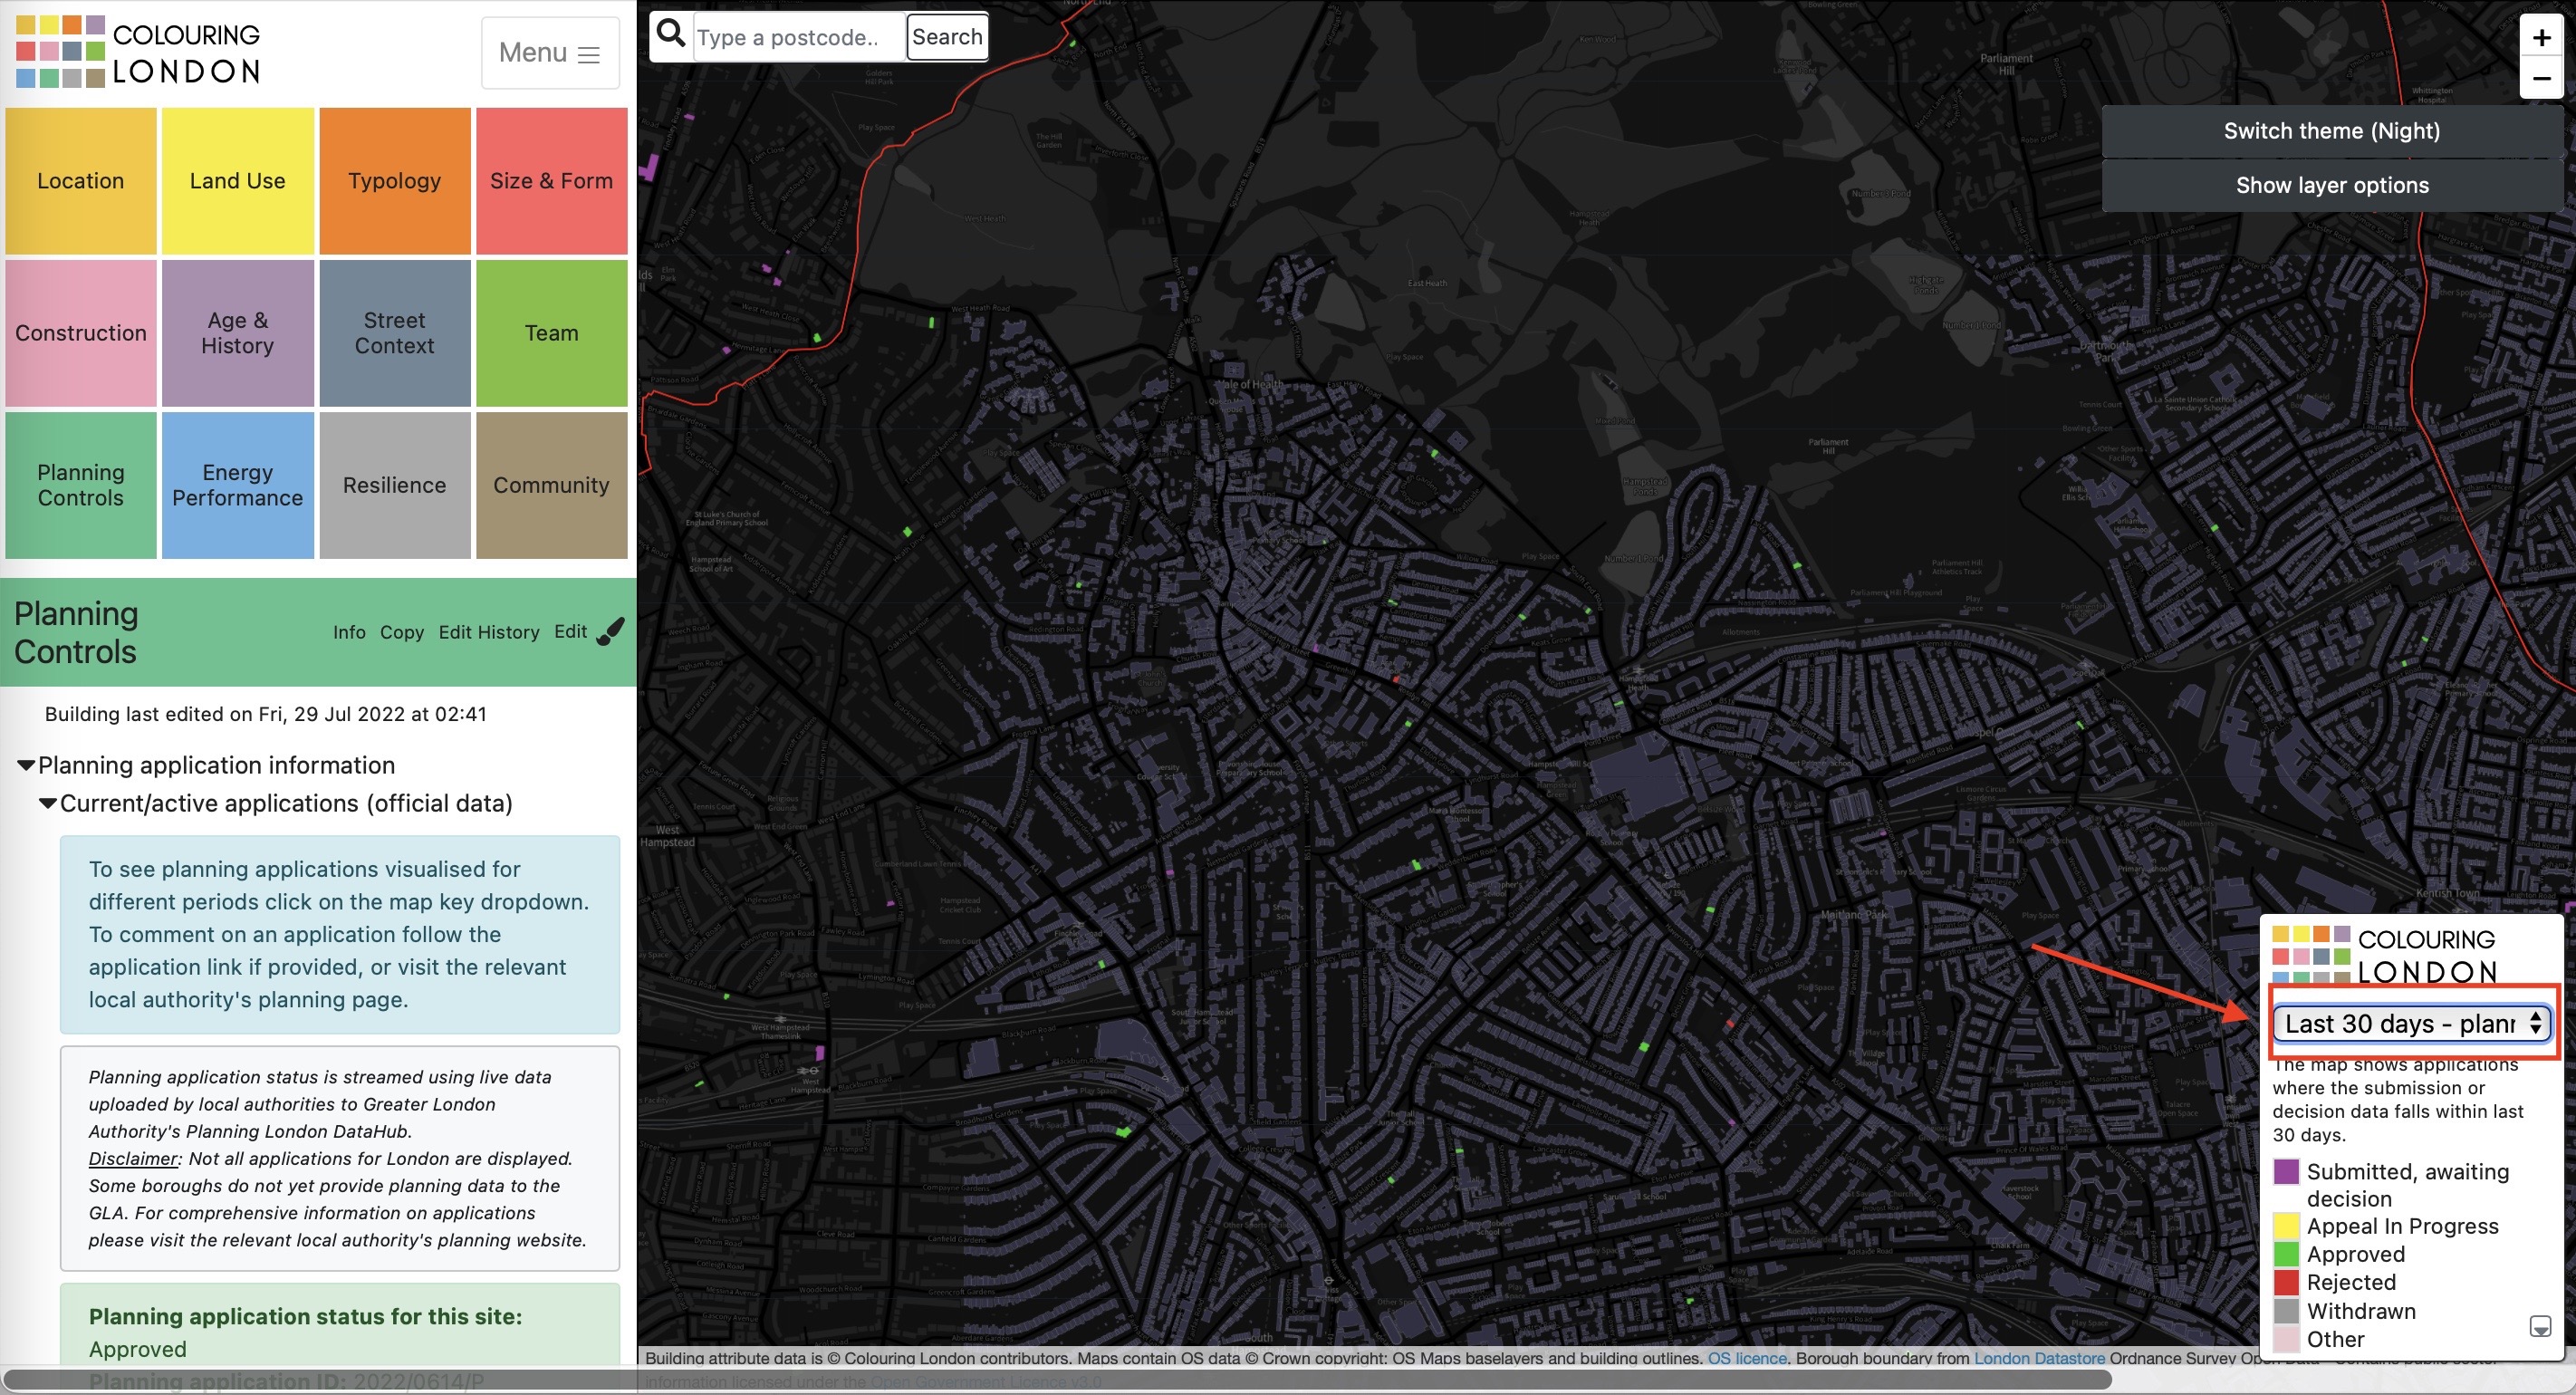
- Option 2: View only applications where the submission or decision data falls within last 30 days.
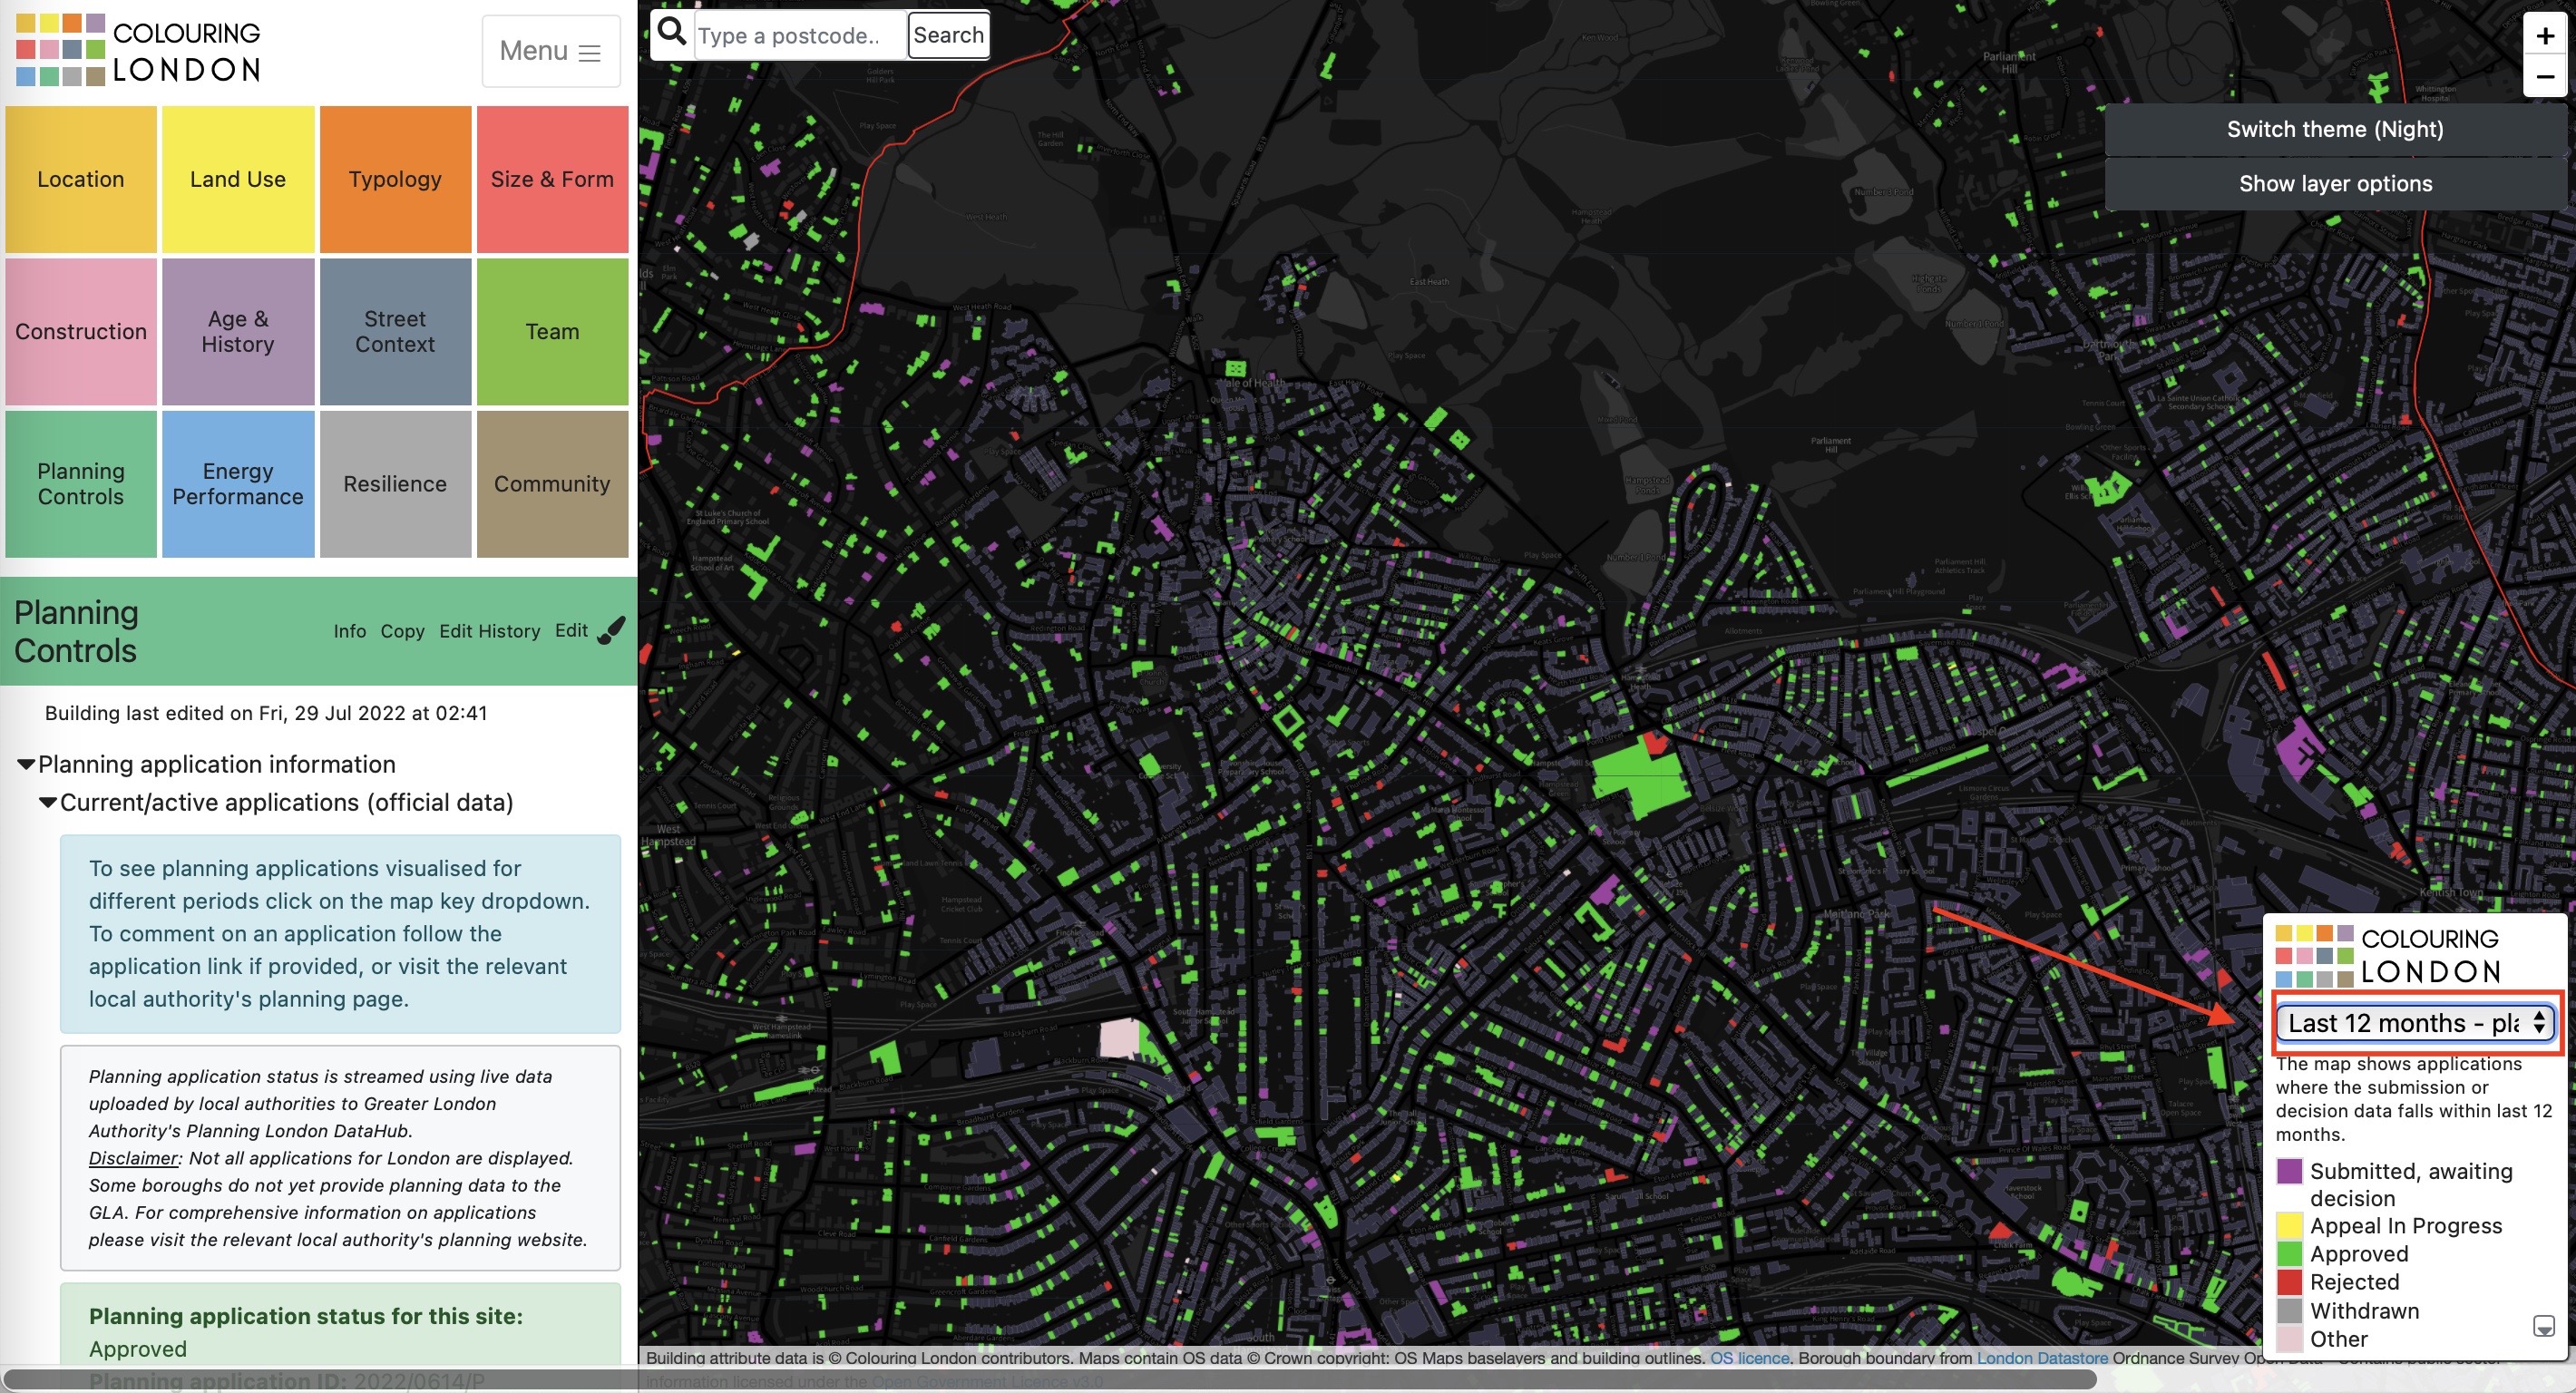
- Option 3: View only applications where the submission or decision data falls within last 30 days.
5.7. Click on 'Possible future applications' to colour in buildings where you think an application is likely to be submitted in future.
We are planning a feature that allows these to fade in colour over time, as some applications may take many months/years to pre discussion with planning authorities before they become publicly visible.
5.8 Viewing Planning Zone data
Select the 'Planning Zone data' section and click on pink buttons to add your chosen layer/s to the map.
Sample data layers are shown using data from the Greater London Authority's London Planning DataHub.
- Use the mouse or + and - buttons on the map to zoom to see zoning for London as a whole or for a specific area.
- Click the pink button to turn the layer/s both on and off
- You can also turn layers on and off using the 'Show layer options' button on the map
- Click any other colour-category boxes to see turned on layers overlaid onto building footprint data.

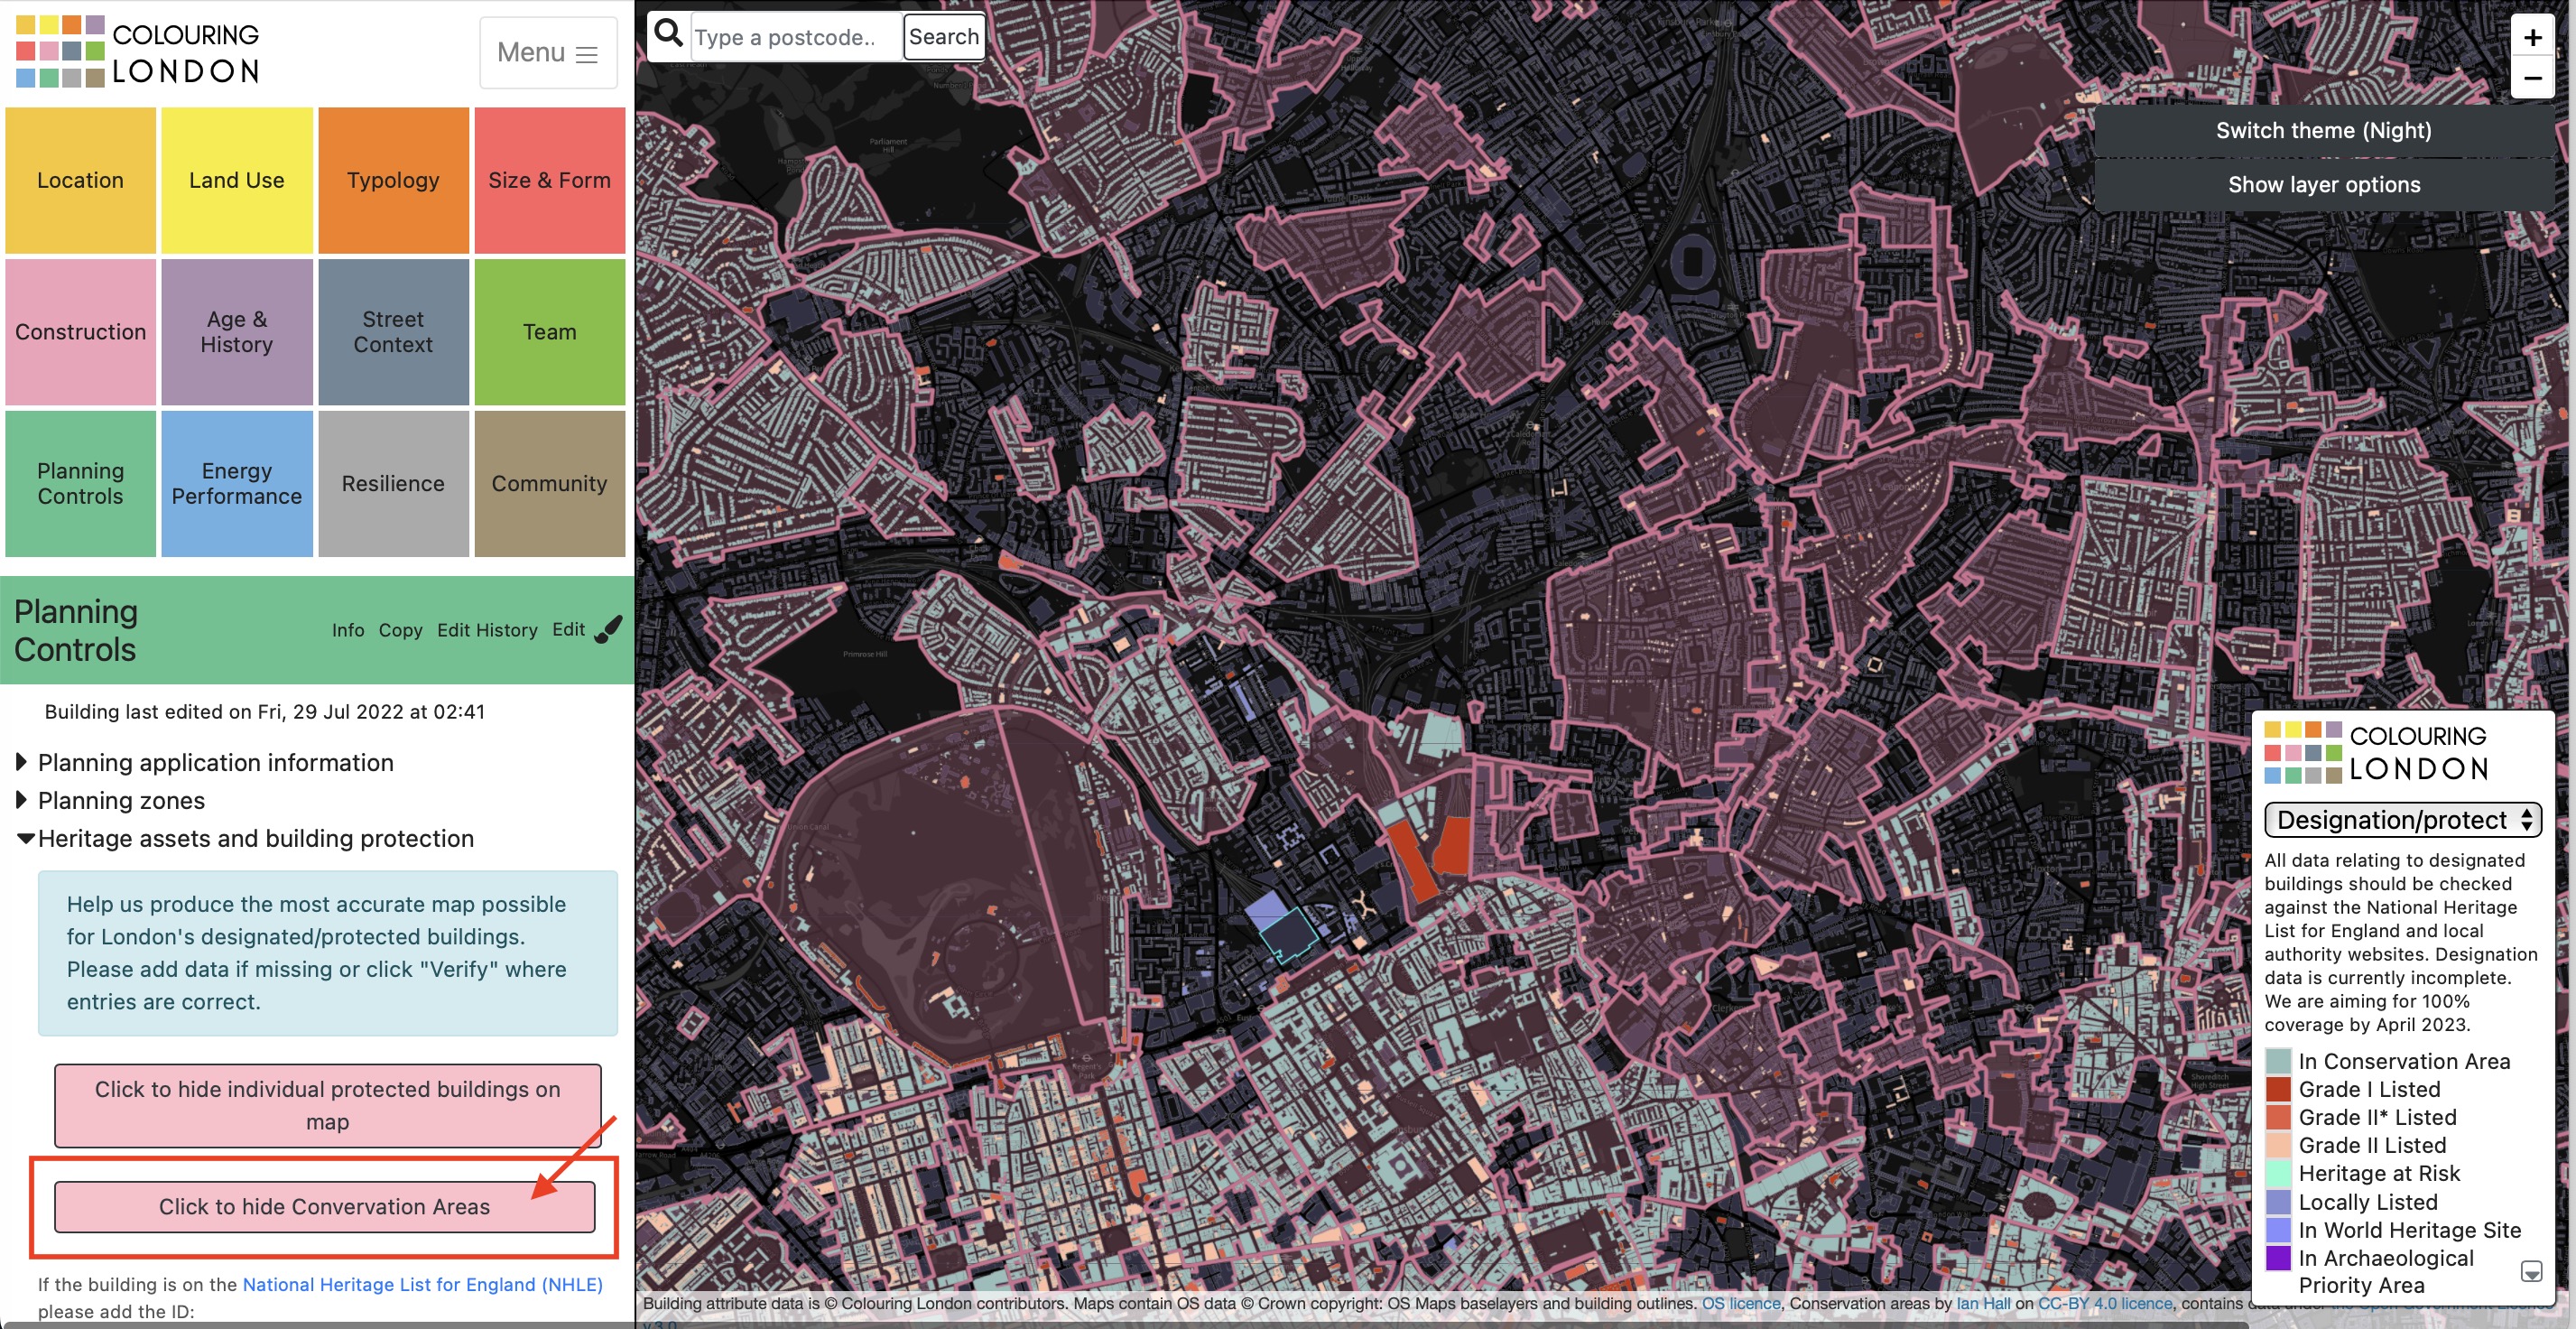
5.9. Viewing Heritage Assets and Building Protection data
Click on the 'Heritage Assets and Building Protection' arrow to open the section.
5.9.1. Click on the 'protected buildings button' to bring up the designation and protection map
This map is currently in the process of development. This is the first time protected buildings' data from Historic England has been linked to individual building footprints_ owing to the complexity of splitting list entries that often relate to multiple buildings. We are testing an approach which combines automated methods with crowdsourced verification and enrichment. If you are interested in historic buildings and could help check some entries we would be very grateful. If you wish to return to planning applications, click the protected buildings button off, and click on the map key to select the planning application time frame.

5.9.2 Click the 'Conservation Area' pink button to turn the conservation area overlay on and off.
5.9.3 For listed building information click on any building marked as listed.
The ID and a link to its National Heritage List for England (NHLE) page will automatically appear in a new page so you can see details and check accuracy of entry. Or if no data is shown but you know the footprint represents a listed building please use the NHLE website to help add its ID.

5.9.4 Add or view other types of information relating to heritage assets here.
Conservation areas will be filled automatically but please help us by adding links or verifying information in these sections
6.0. Using the Survival map section
The survival map is verey easy to use and allows you to colour in buildings very quickly by eye depending on whether they match the historical map.
-
Go to the 'Age and History section' and open the 'Survival tracking' section
-
Click on the green button to bring up a historical map
-
Click on any current building outline, marked in red
-
Choose from the dropdown options how well historical building footprint matches current building footprint
-
Save and the building will colour