Polytomous Computer Adaptive Test - campsych/concerto-platform GitHub Wiki
This tutorial goes through the process of creating a polytomous CAT. This tutorial assumes basic knowledge of item response theory and computer adaptive testing and familiarity with the Flat Item Table method.
In this guide we’re going to:
- upload an item bank using a Flat Table
- create a data table in which to store responses to our items
- create the test format for our polytomous CAT
- set a minimum accuracy level that the CAT must reach before stopping
- set the scoring properties of the test
- present a feedback page showing the results of the CAT
- Download Item Bank as .csv
- Download polytomous CAT as .yml (v5.0.20)
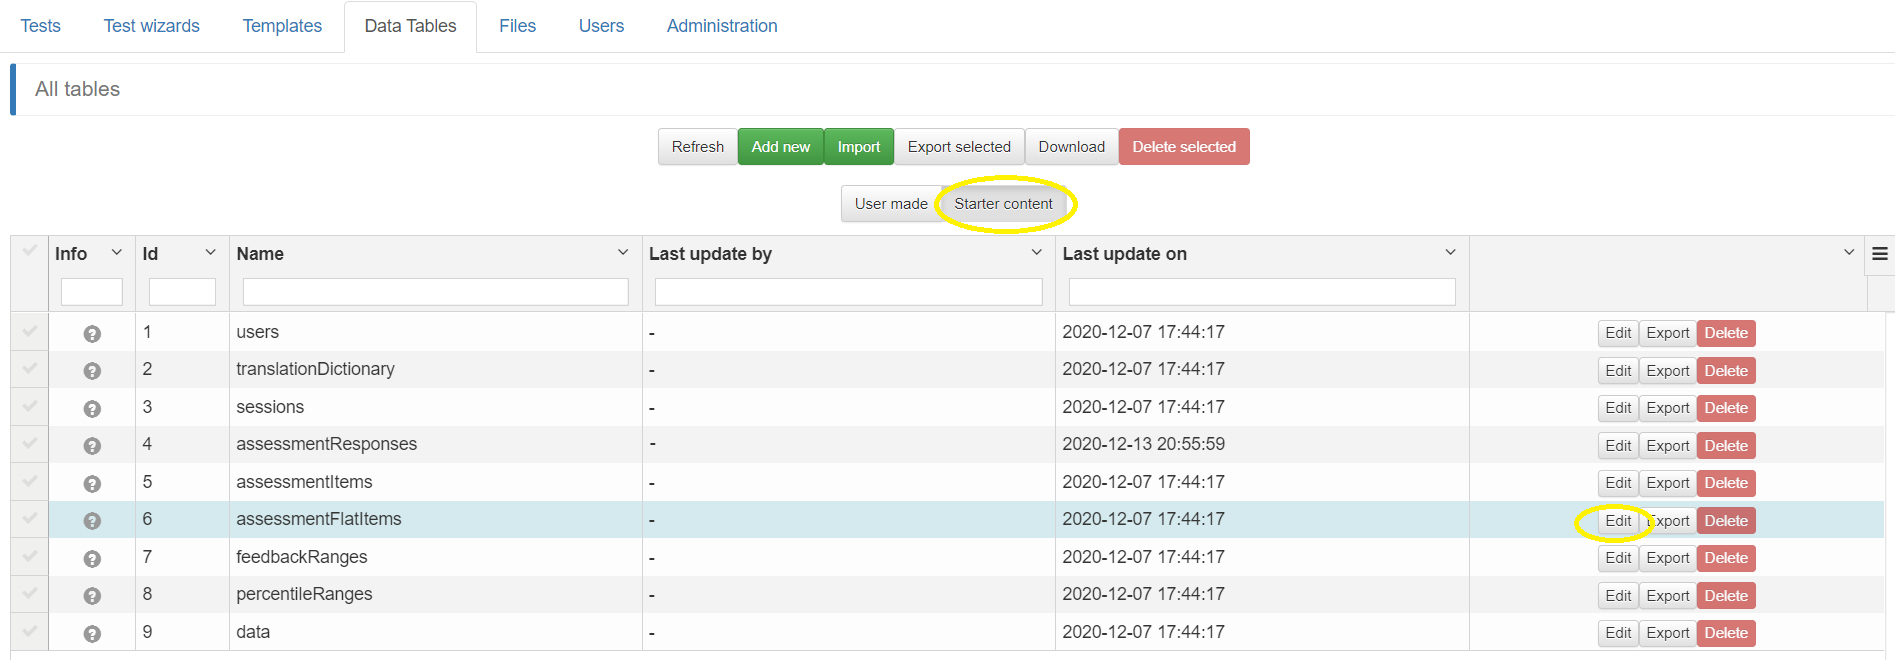
Under the Data Tables tab, click on starter content. Find assessmentFlatItems and edit to open. Create a copy of it and give it a new name (e.g. ‘ExamplepolytomousCATFlatItems’).
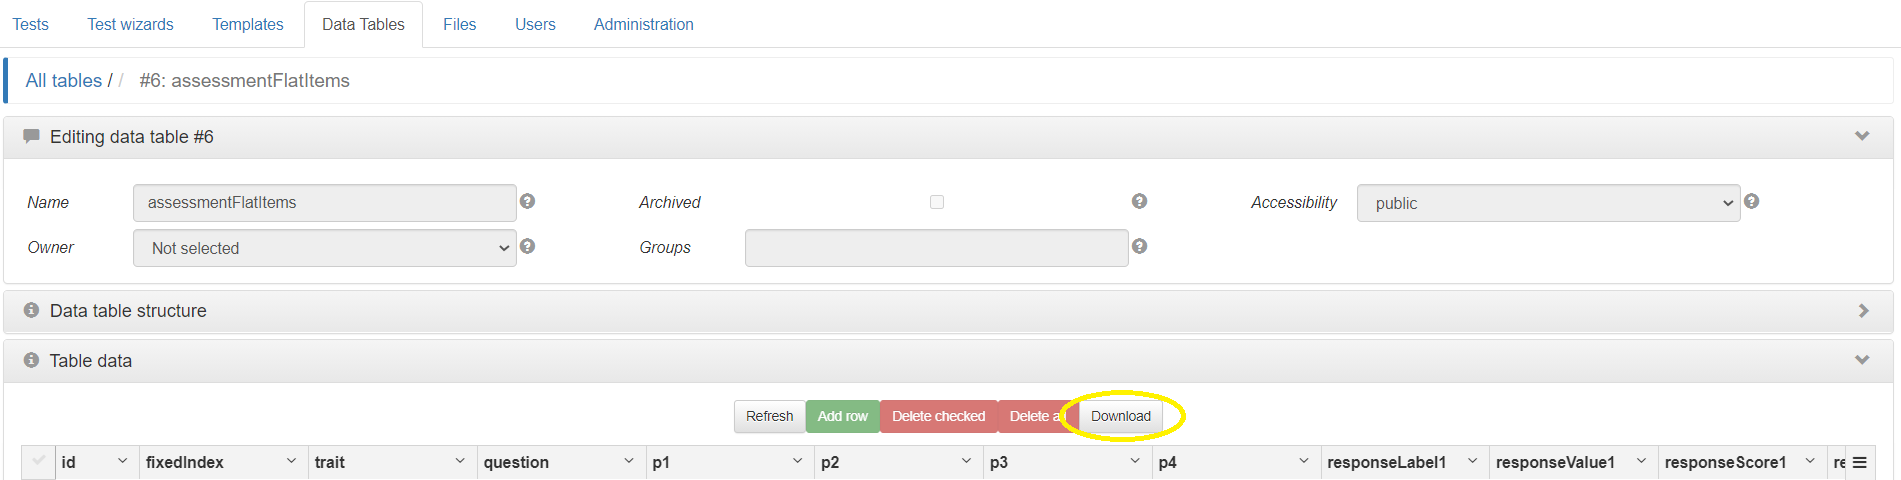
Download this data table to a .csv and input your items into it. Make sure to save your item bank file with UTF-8 Encoding. Flat Item table tutorial.
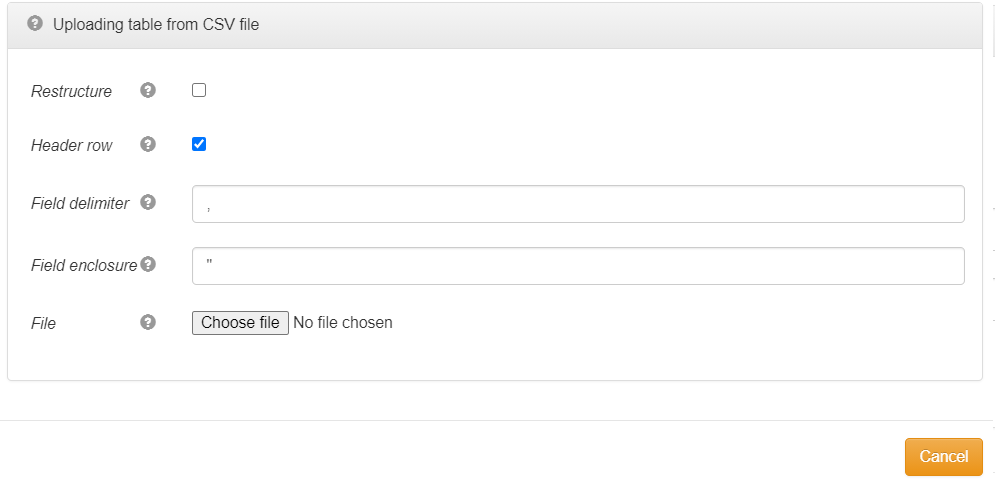
Once your item bank is ready, upload it to your data table, checking ‘Header row’. This will mean you have your own items in a Flat table.
You can use the default assessmentResponses table to store responses to your CAT, if you want to. However in this case we will create a new table. Under the Data Tables tab, make a copy of the assessmentResponses table.
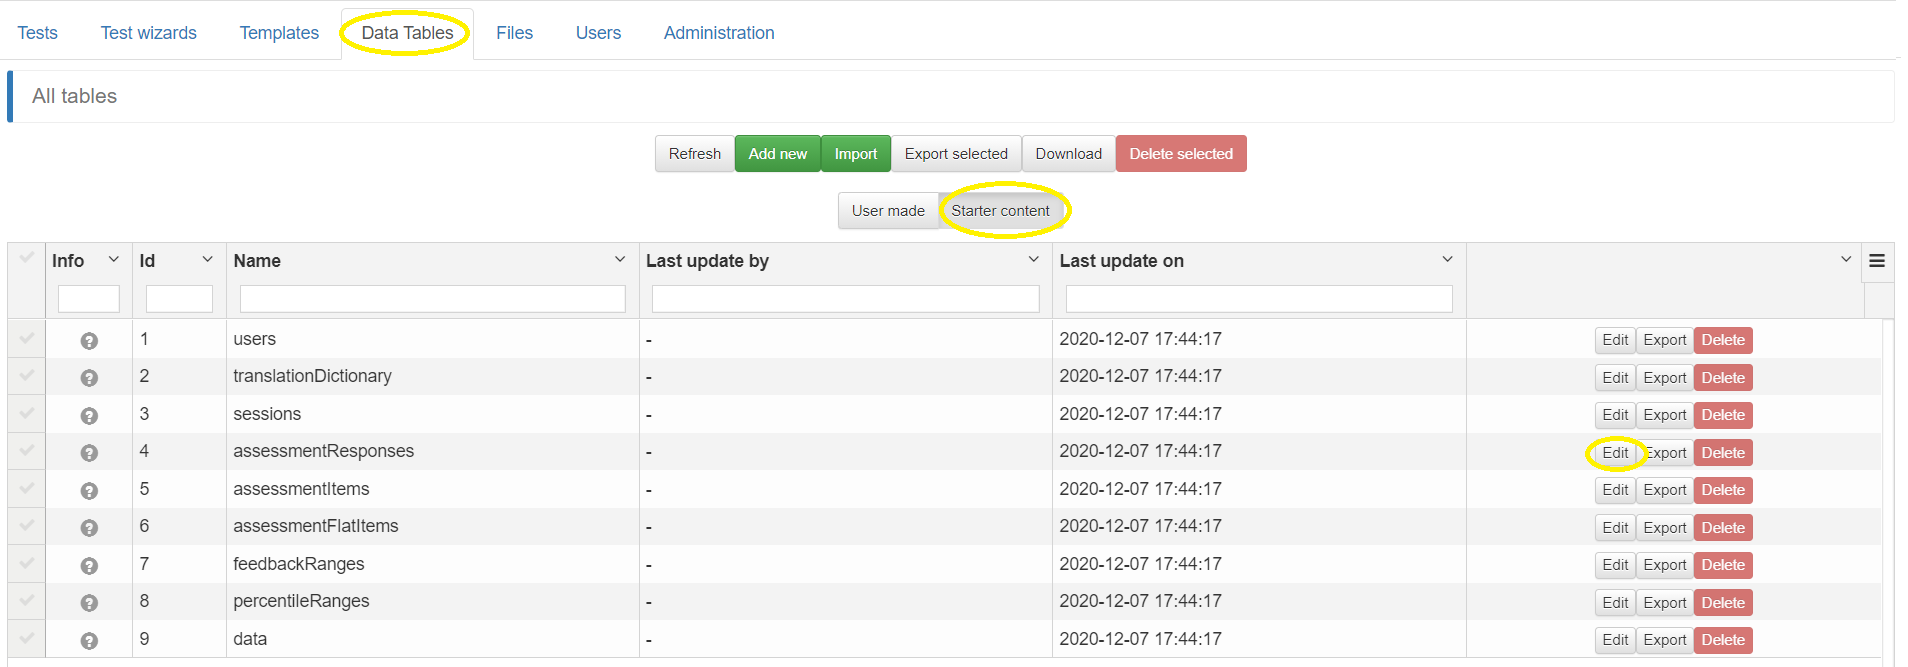
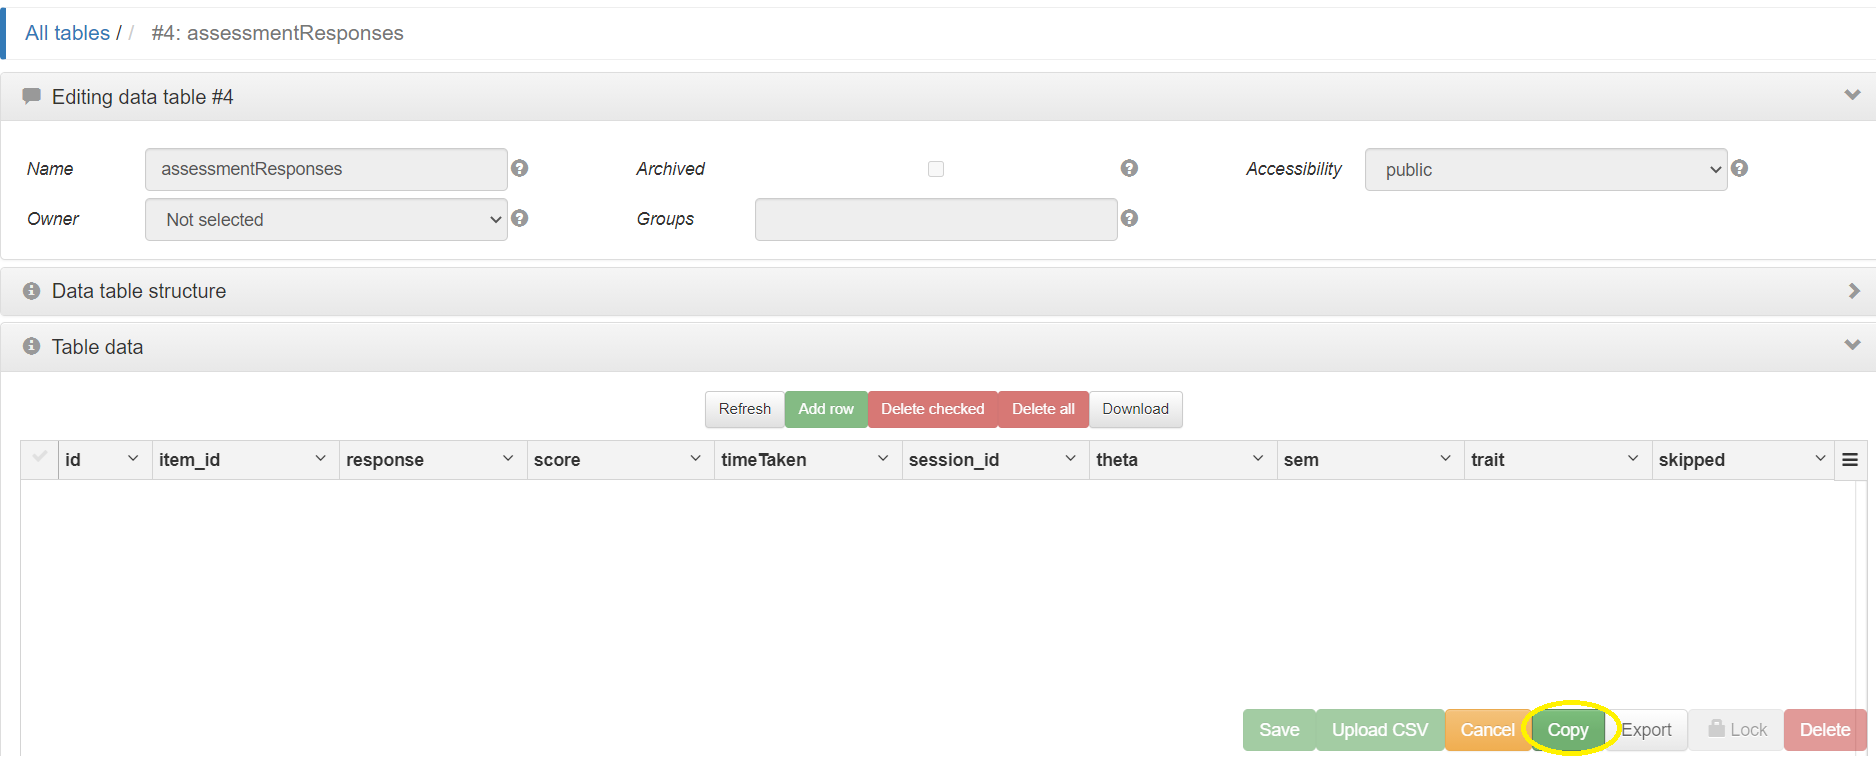
Give your new responses table a name (e.g. ExamplepolytomousCATResponses) under “Name of the new object” and click “save”; this creates a new data table that we can later tell our assessment node to use for storing the test responses.
Go to the Test tab and create a new test.
Using right click again, create an assessment node. In the items tab, set Type to Flat table. This tells the node to expect items in the flat table format. Set Order to CAT, which tells the assessment node to use the CAT algorithms. After an item is answered, the node will use the IRT parameters in your flat item table, and the CAT settings you have specified, to calculate the individual’s theta score and the standard error of measurement and choose the next item accordingly.
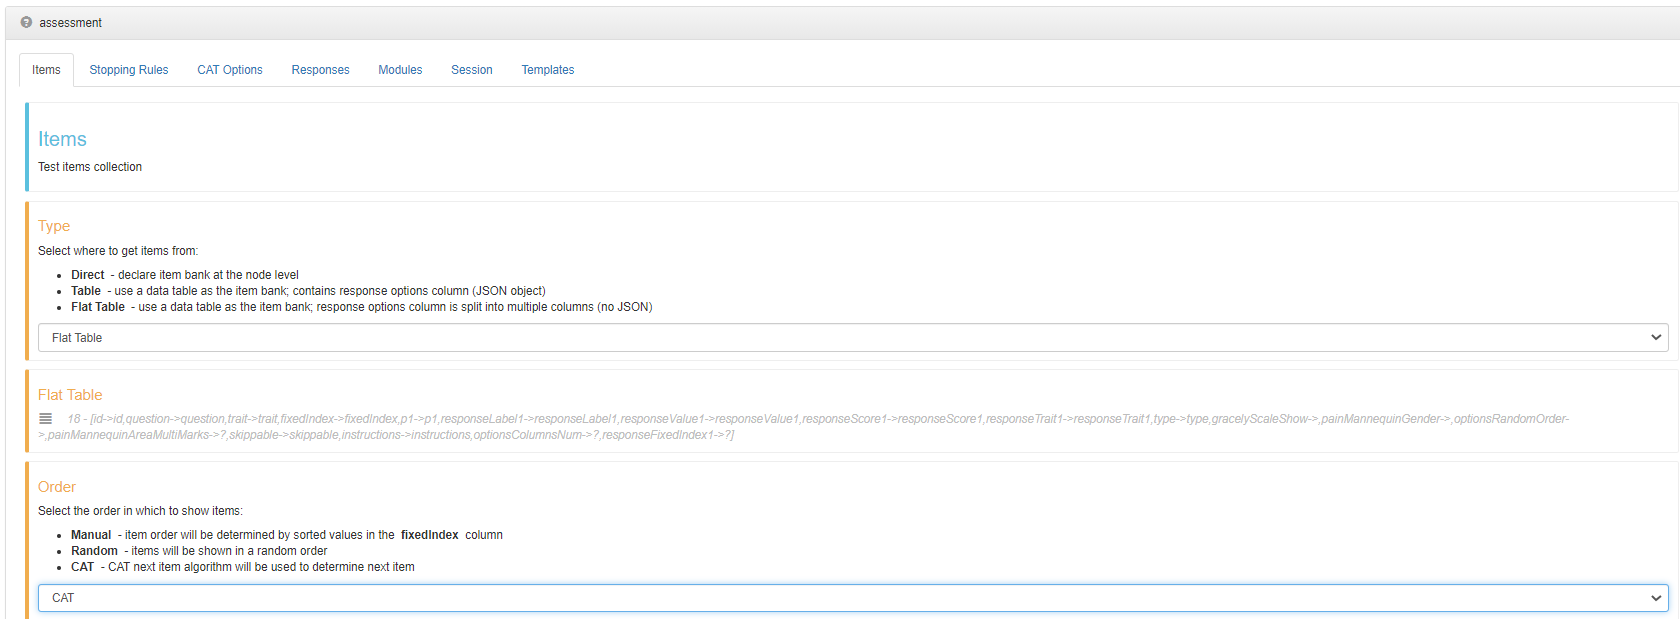
Click the Edit icon under Flat Table and choose the data table you created that contains your items (e.g. ExamplepolytomousCATFlatItems).

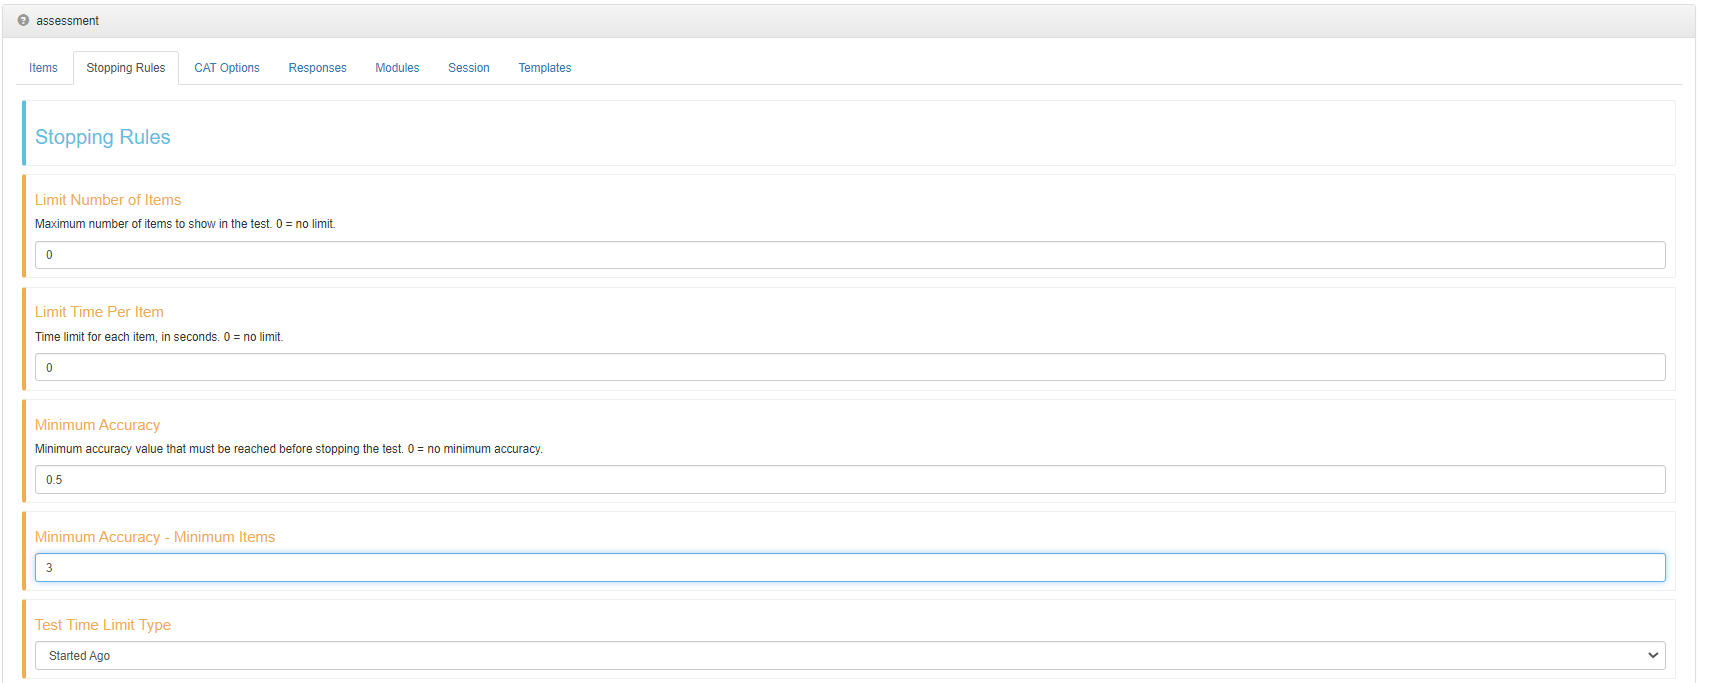
Under the Stopping Rules tab, we can set criteria that must be satisfied before the CAT stops asking questions. The relationship between the different stopping rules is OR, meaning that the test will stop when any one of the specified rules has been met. Note that the shorter the test time and the fewer items that have been answered, the less accurate the final measurement of ability is likely to be. For this tutorial, we will set “Minimum Accuracy” (represented by standard error of measurement) to 0.5 and “Limit Number of Items” to 3. This means that the test will stop EITHER when the standard error of measurement has reached 0.5 OR when 3 items have been administered.
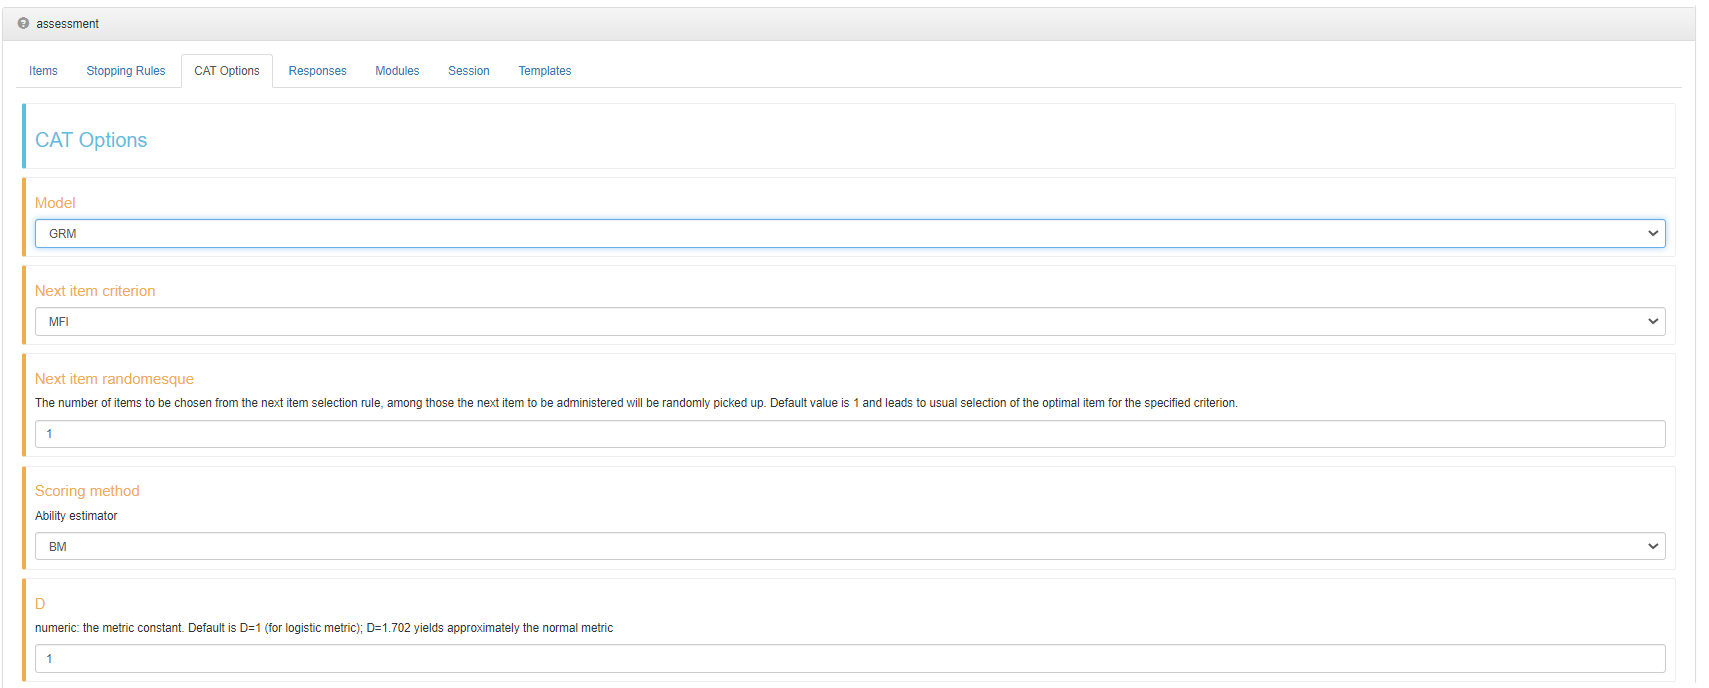
There are many settings in the CAT Options tab which you can use to customise how your CAT works. In this case we will use the Graded Response Model (i.e. set “Model” to GRM) which is appropriate for a polytomous test. Set the “Next item criterion” to MFI (Maximum Fisher Information), the “Next item randomesque” to 1 and the “Scoring method” to BM (Bayes-Modal Estimator).
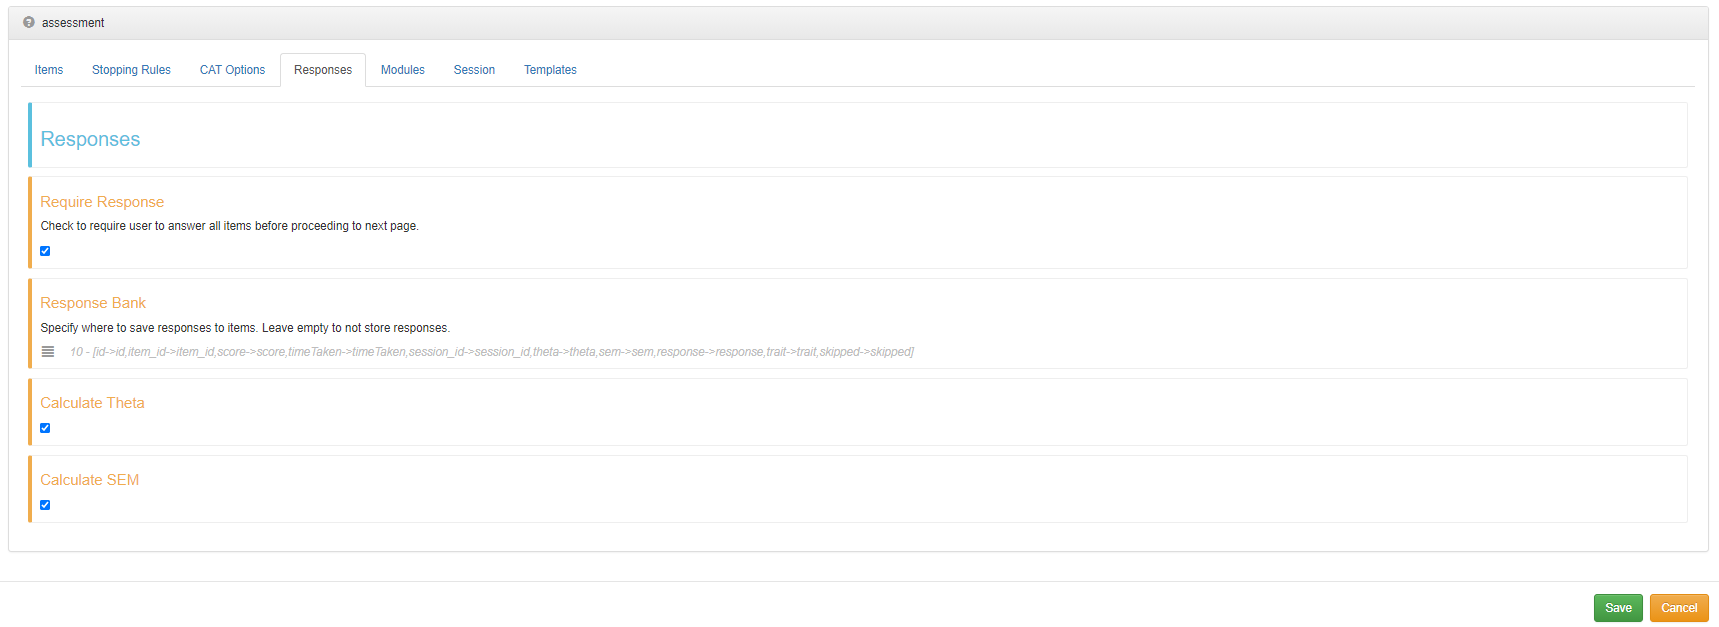
Under the Responses tab, select the following:
- “Require responses” ensures that an individual cannot skip a question. This is optional.
- Under “Response Bank” set the first option, “Table”, to the data table you created for storing responses (e.g. ExamplepolytomousCATResponses).
- “Calculate theta”: Theta is used to represent the ability of an individual. This tells the node to output theta value.
- “Calculate SEM”: SEM is the standard error measurement. This tells the node to output sem value.

Under the Templates tab, you can optionally tell the test to show a title, and other visual elements such as the instructions field (which can also be set from the ‘instructions’ column of your flat item table).
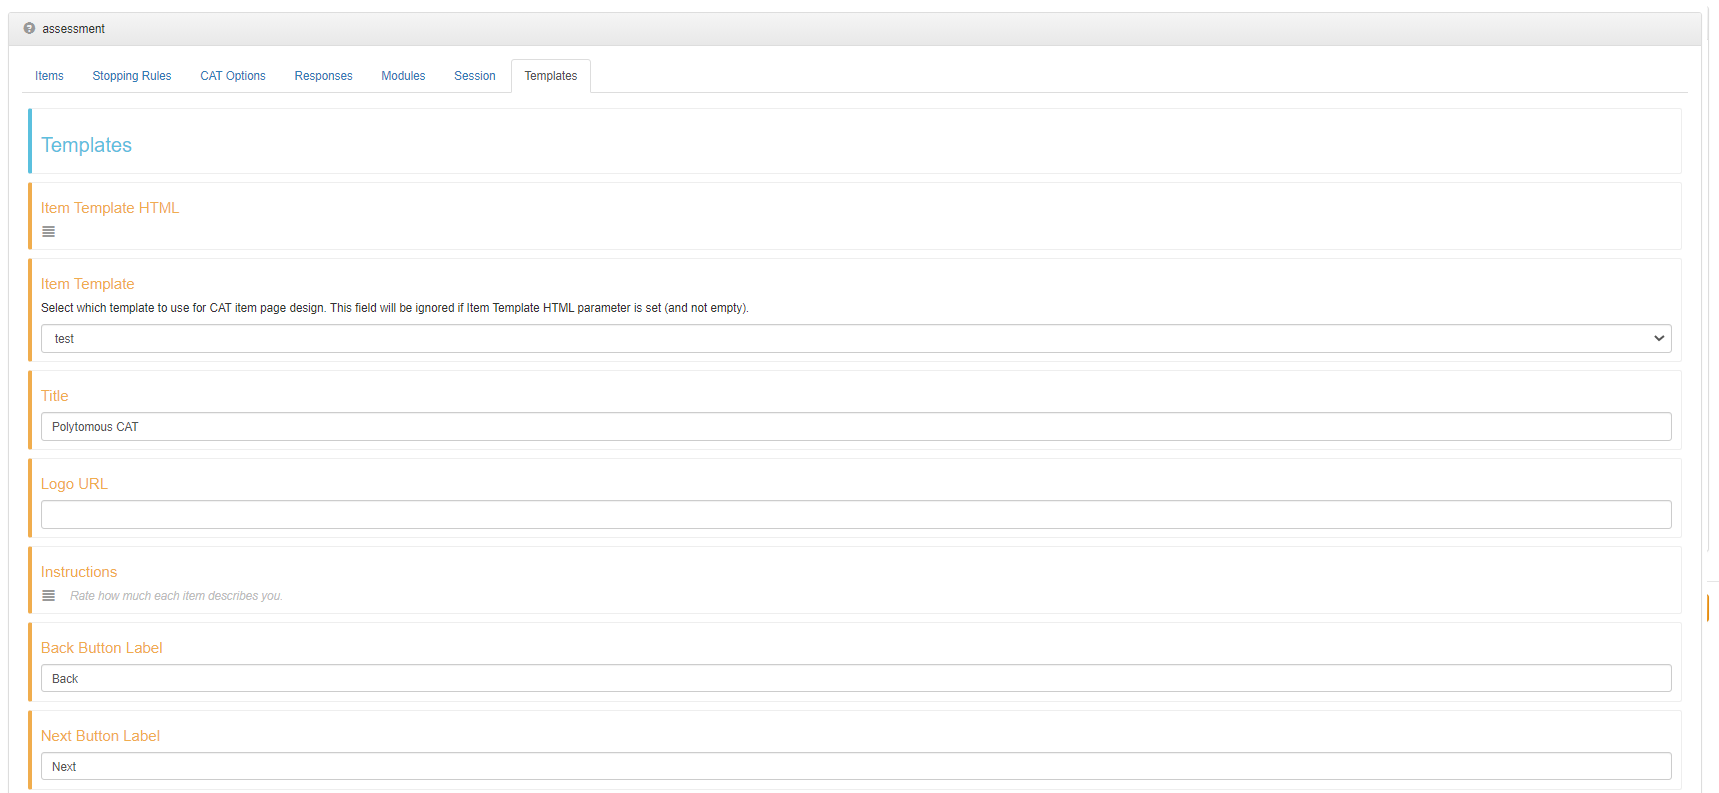
Also, make sure that “Show page info” is not selected. This prevents page numbers being shown, which is normally a good idea with CAT since the exact length of the test is not known in advance.

Save all settings to return to the flow chart test structure.
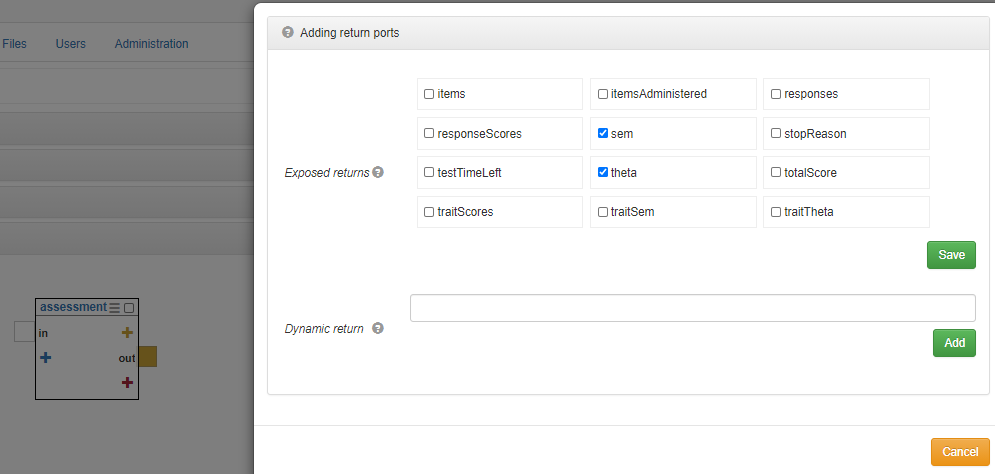
On the assessment node click the red cross and under “Exposed returns” select “sem” and “theta”. Note that if your CAT is measuring multiple traits, you can expose the traitTheta and traitSEM return ports to get a R list object containing key-value pairs of the theta and SEM scores for all traits. You can then filter these list objects as needed.
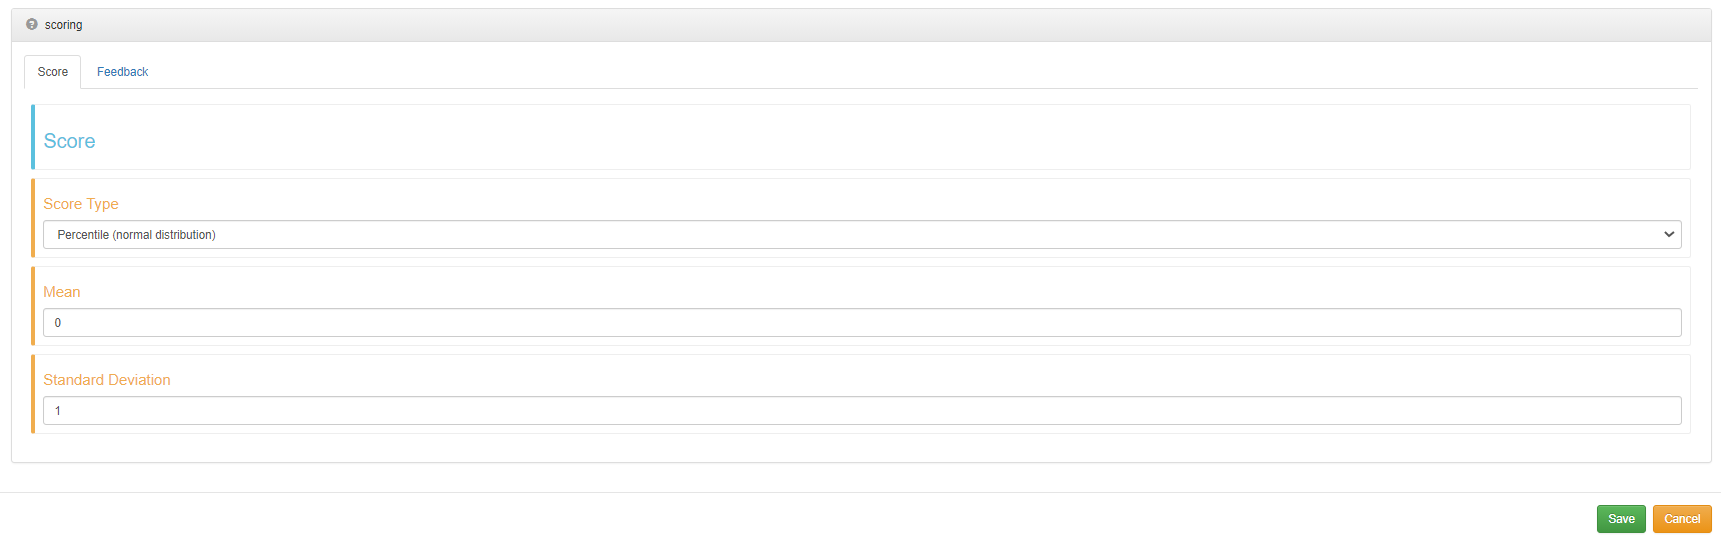
In this tutorial we’d like to convert our theta score to a percentile. We could do this using the pnorm() function in R, or we can use the scoring node. On the test flow chart page, right click and add a Scoring node between the assessment and showPage nodes. Set “Scoring Type” to percentile, the mean as 0 and the standard deviation as 1.
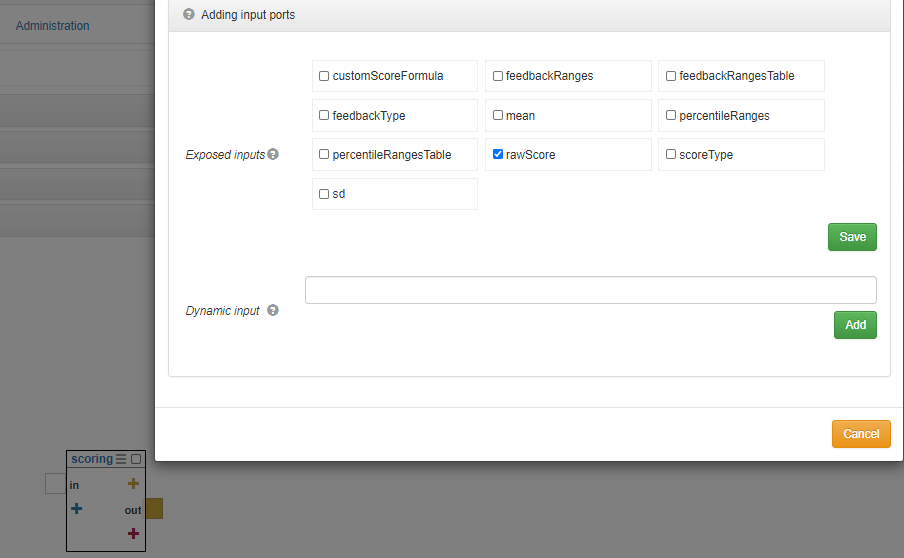
Back on the flow chart test structure page, on the scoring node you can set an input (by clicking the left blue cross) and an output (by clicking the right red cross). When adding the input, select “rawScore” from the “Exposed inputs section” and save.
Create an output on the scoring node called “score” and save to return to the test format.
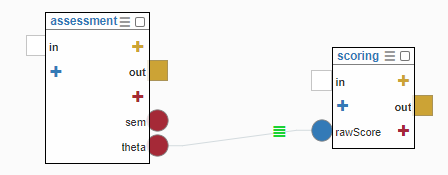
Connect the “theta” from the assessment node to the “rawScore” on the scoring node.
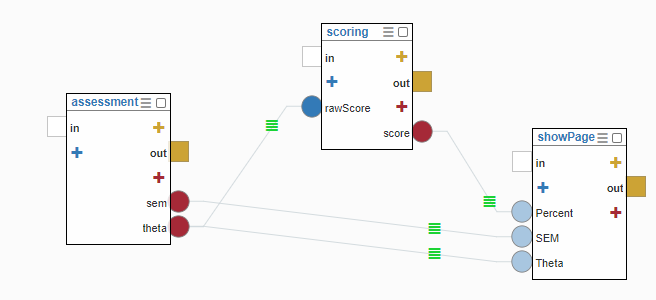
On the showPage node click the blue cross and under “Dynamic input” add “Theta”, “SEM” and “Percent” separately.
Then connect the “sem” and “theta” nodes on the assessment node and the showPage nodes. Also, connect the “score” from the scoring node to the “percent” on the showPage node.
The score on the output page will be to a high degree of accuracy ( multiple decimal places) so we want to round it in this case. To do so, click on the hamburger icon on the line that links the score output with the show page input and enter the following R code, to round the value to 1 decimal place:
round(score,1)On the showPage node we’re going to enter the Content we want to show on the showPage instance:
Thank you for participating in the test. Your scores are as follows:
Theta: {{Theta}}
SEM: {{SEM}}
Your score is higher than {{Percent}}% of the general population.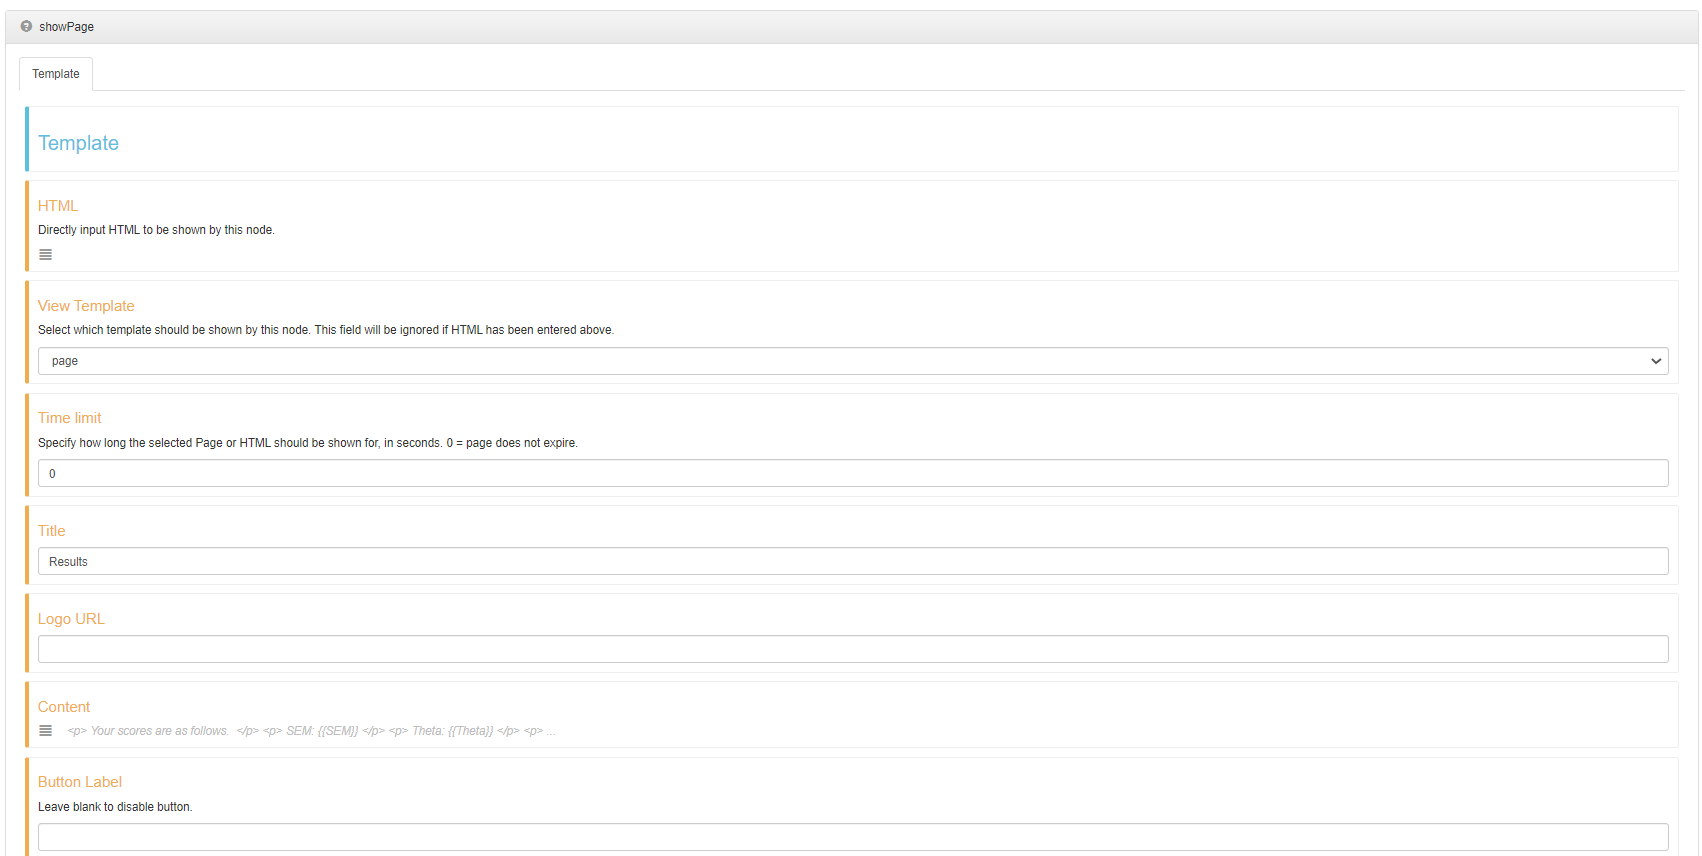
The Button Label text may be deleted as this is the final page of the test. Save and return to the test flowchart screen.
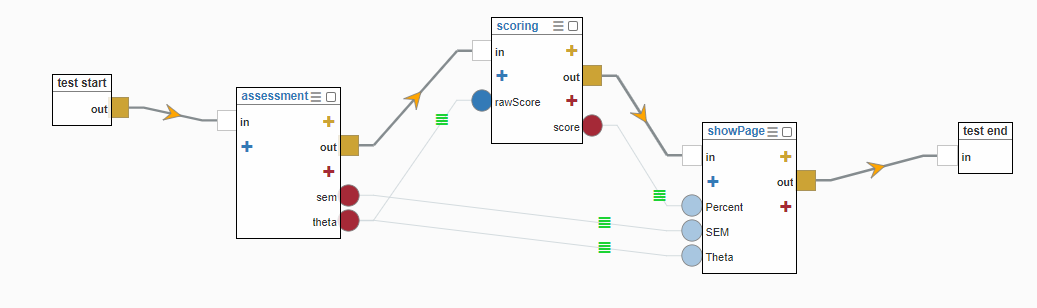
Finally, connect the test up using the in and out ports as shown.
You have now created a polytomous computer-adaptive test! You can then run your test to check it works. After running the test a few times, you can also check the data table to see how the data is saved.