Big 5 Personality Test (20 item) Tutorial - campsych/concerto-platform GitHub Wiki
This tutorial outlines the process of creating a 20-item big 5 personality test (the Mini-IPIP) in Concerto. Whilst basic knowledge of psychometrics is assumed, the tutorial results in a linear personality test that is ready to use.
In this guide we’re going to:
- Create and upload an item bank using a Flat Table
- Create a data table in which to store responses to our items
- Create the test format for our big-5 personality test
- Understand how to score a multi-factor personality test
- Present a feedback page showing the score and feedback
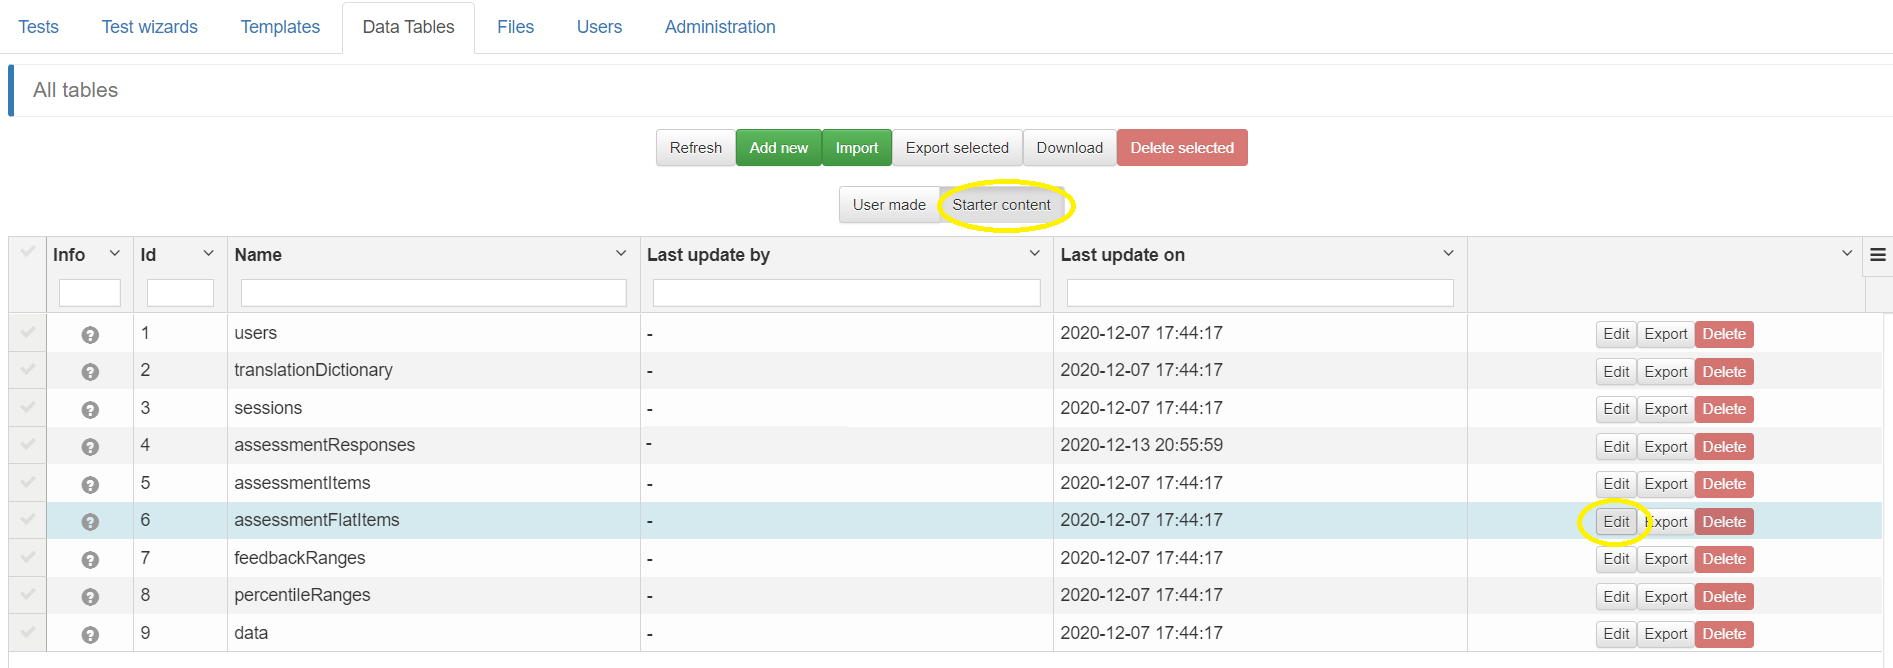
Under the Data Tables tab, click on starter content. Find assessmentFlatItems and edit to open. Create a copy of it and give it a new name (e.g. ‘MiniIPIPFlatItems’).
Download this data table to a .csv and input your items into it. Make sure to save your item bank file with UTF-8 Encoding. Flat Item table tutorial..
Once your item bank is ready, upload it to your data table, checking ‘Header row’. The default downloaded item table contains four response options. However, as this test uses five response options for each item, the Flat Item table is of a slightly different format. Therefore, checking ‘Restructure’ fits our items in the data table. This will mean you have your own items in a Flat table.
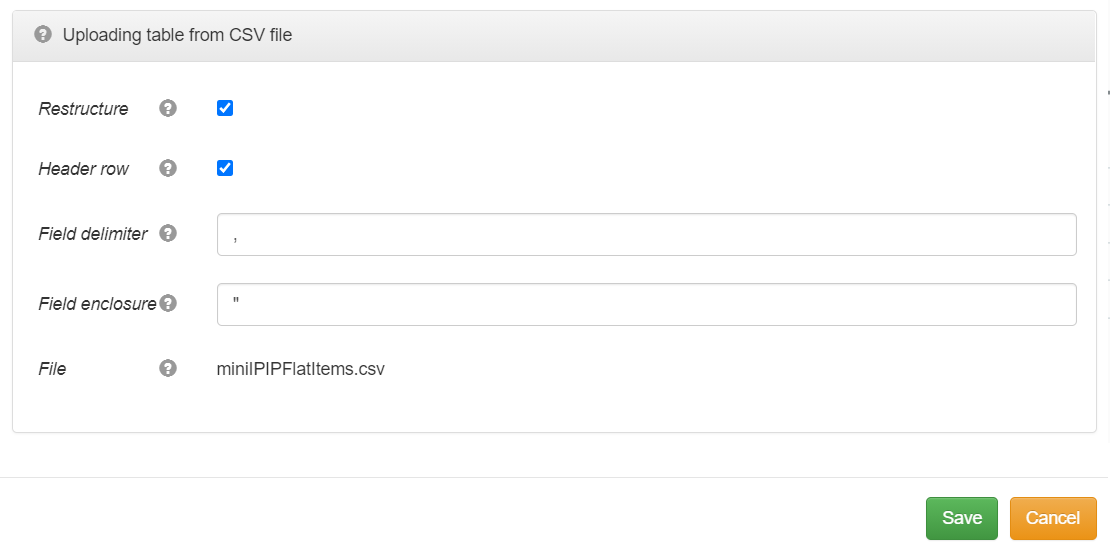
It is important to make sure that whilst the number of response options in the Flat Item table may change from the default, all other columns should be included in the adapted Flat Item table for the test to work.
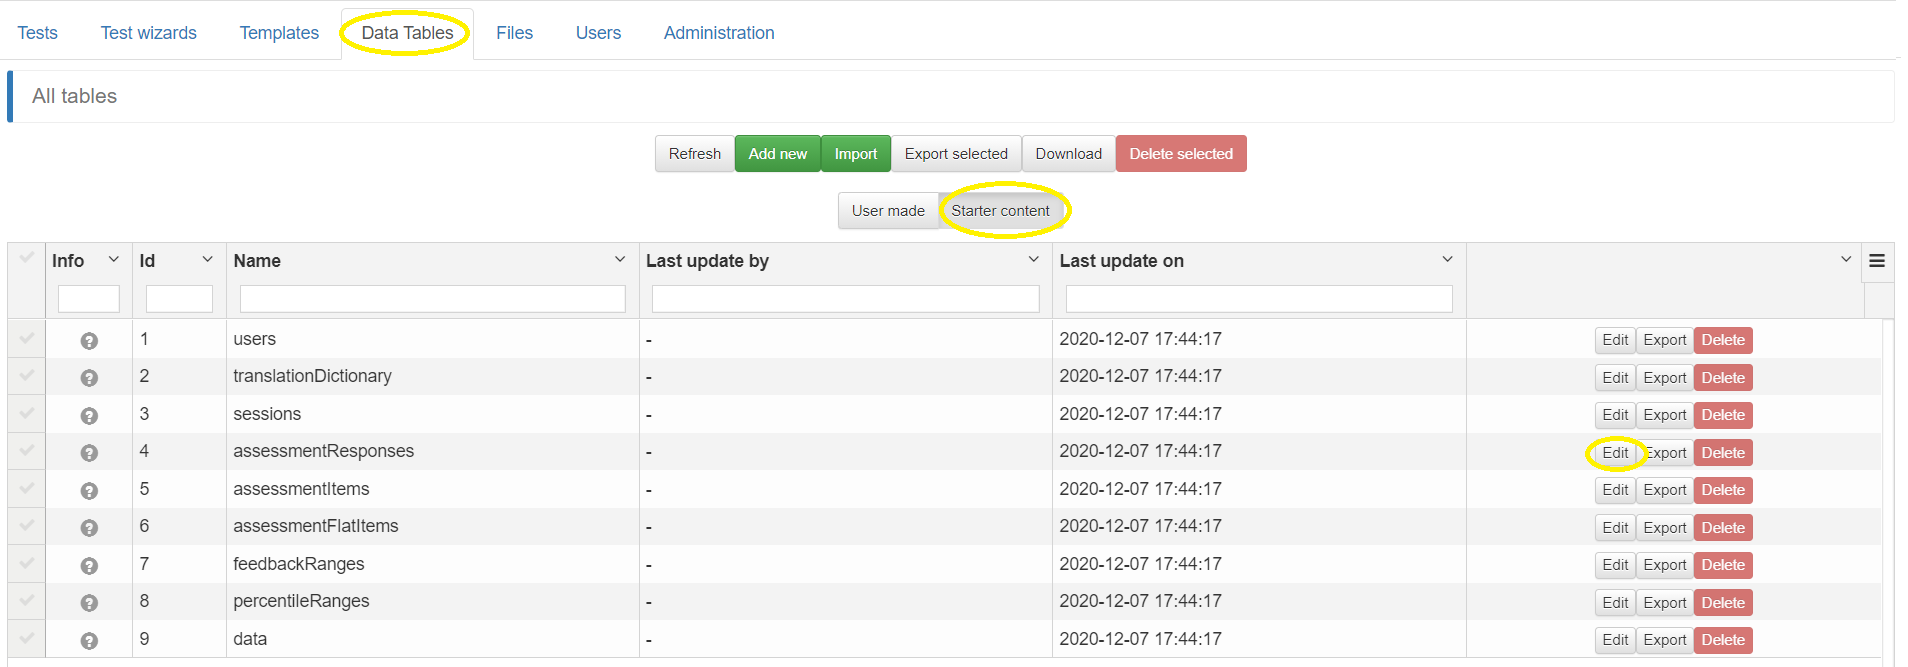
You can use the default assessmentResponses table to store responses to your test, if you want to. However, in this case we will create a new table. Under the Data Tables tab, make a copy of the assessmentResponses table.
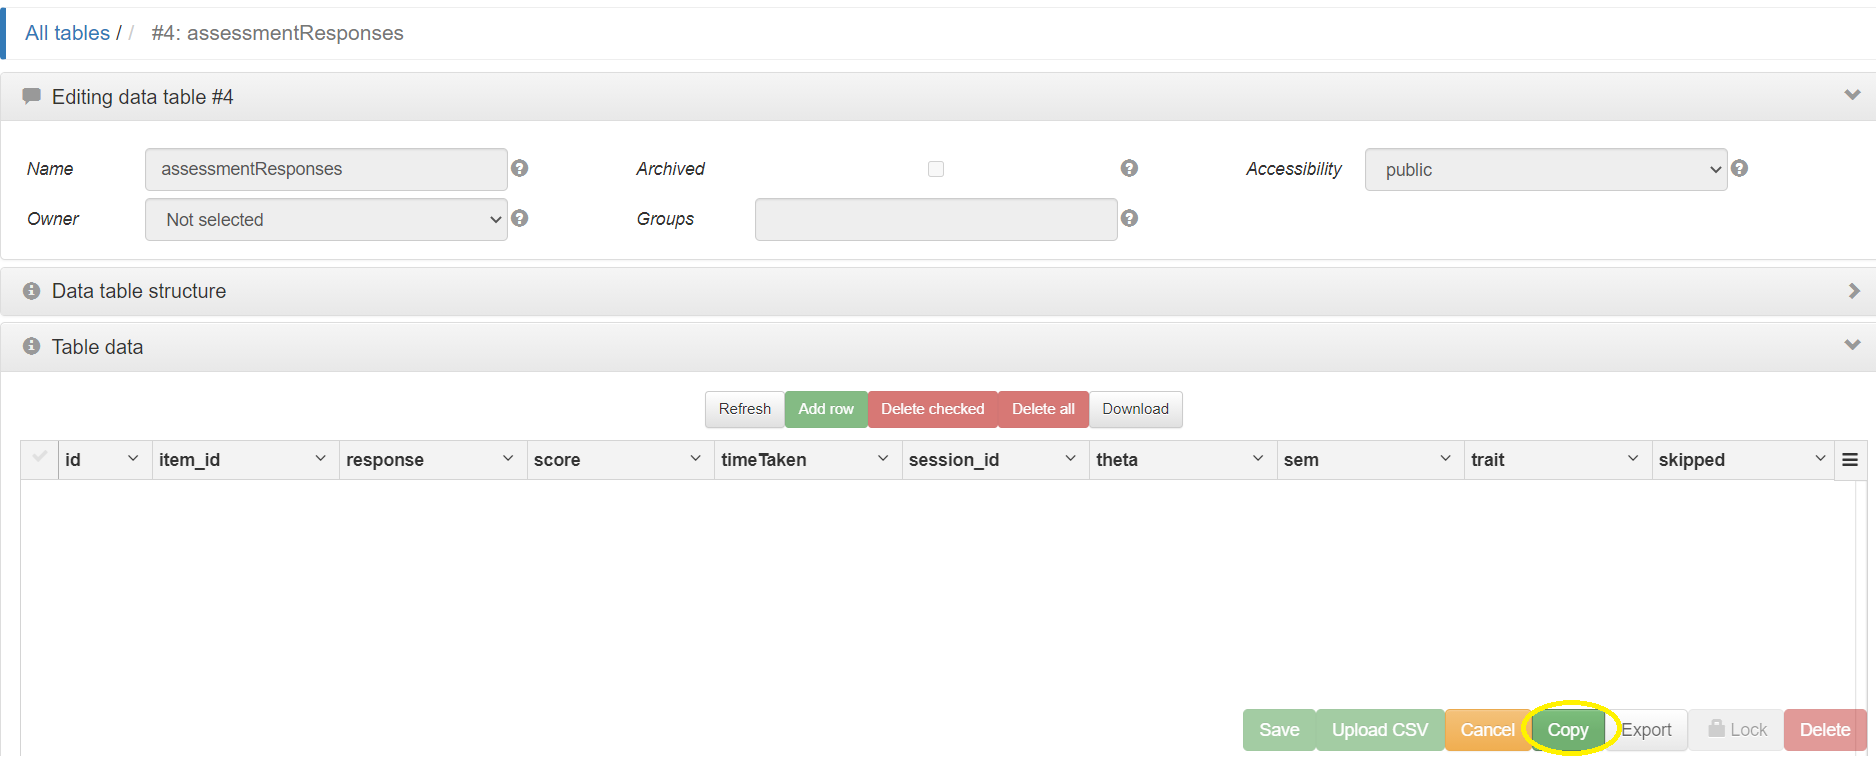
Give your new responses table a name (e.g. MiniIPIPResponses) under “Name of the new object” and click “save”; this creates a new data table that we can later tell our assessment node to use for storing the test responses.
Go to the Test tab and create a new test. Click “Edit” to open the test flow chart test structure.
Right click to add an optional set node.
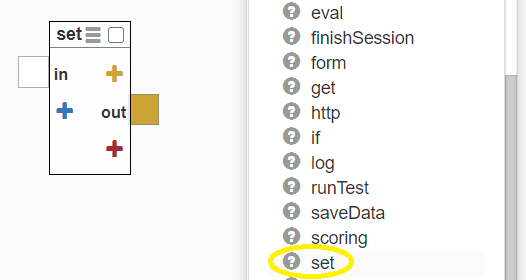
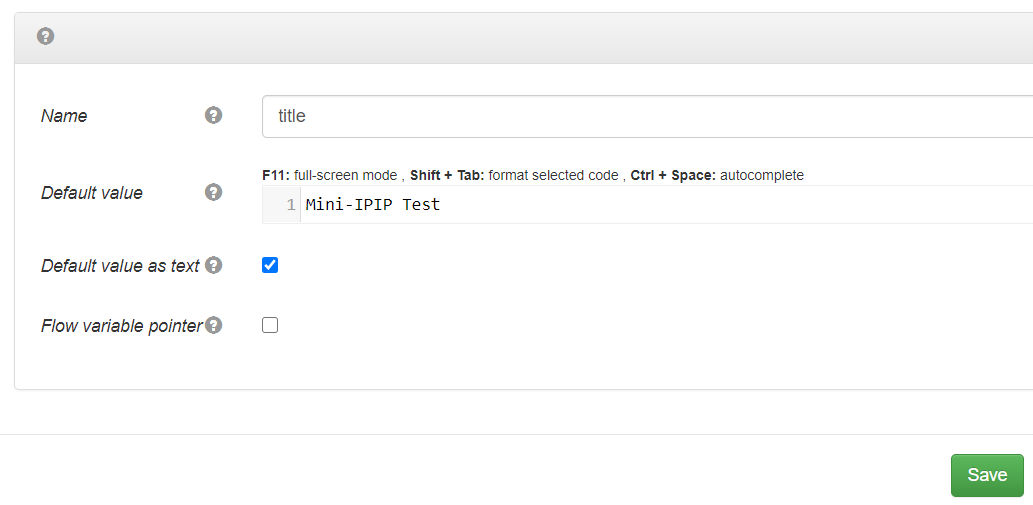
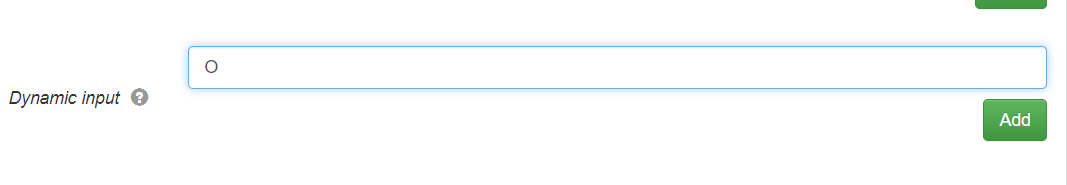
On the set node click the left blue cross. Add a “Dynamic input” called “title”. This will allow you to copy the title across the other nodes. Then click on “title” on the set node. Select the “Default value as text” box and fill in the title in the “Default value” box.
You can also set a logo in a similar manner.
Right click to add a showPage node and under “Content” you can fill in the instructions for the test. If using the data for the Mini-IPIP make sure to include the following reference:
References
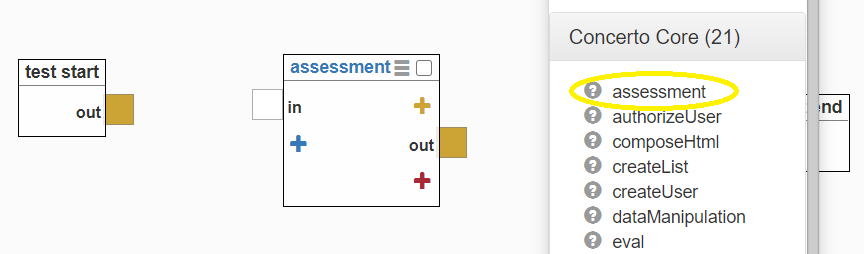
Donnellan, M.B., Oswald, F.L., Baird, B.M., & Lucas, R.E. (2006). The mini-IPIP scales: Tiny-yet-effective measures of the Big Five factors of personality. Psychological Assessment, 18, 192-203Using right click again, create an assessment node.
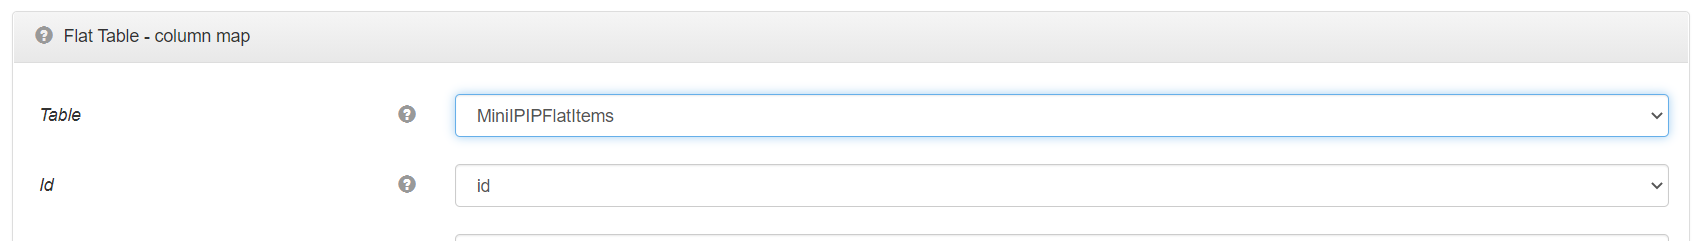
In the items tab, set Type to Flat table. This tells the node to expect items in the flat table format.
Set Order to Random, which tells the assessment node to show the items in a random order. You can also choose how many items are displayed on each page of the test by filling in Items Per Page.
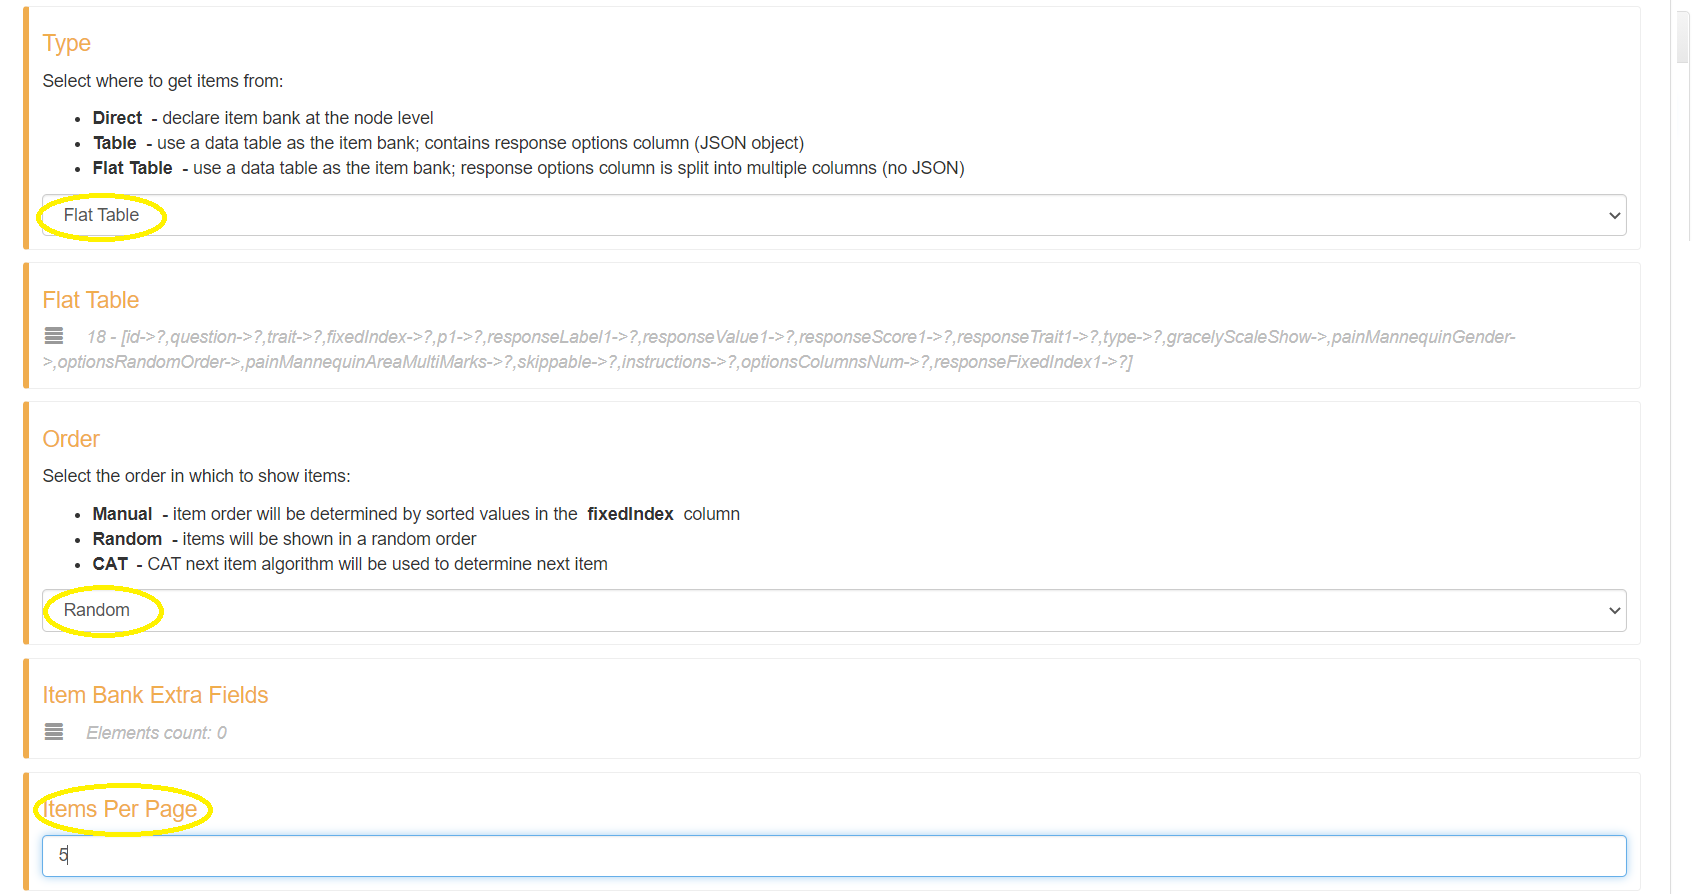
Click the Edit icon under Flat Table and choose the data table you created that contains your items (e.g. MiniIPIPFlatItems).
There are many settings in that can be used to customise how the test works. In this case we will just leave the settings under the ‘CAT Options’ tab as default. Under the ‘Stopping Rules’ tab you can limit the number of items or time taken for the test. However, we will leave these as default for the purpose of this test; all items will be administered.
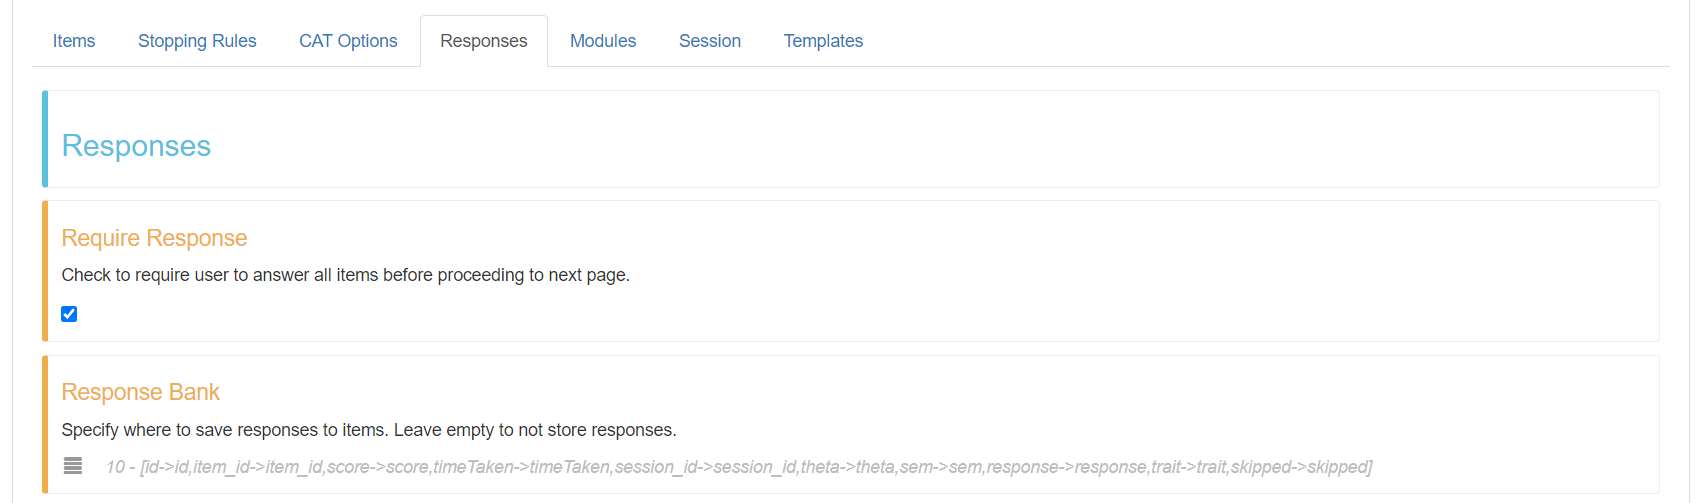
Under the Responses tab, select the following:
- “Require responses” ensures that an individual cannot skip a question. This is optional.
- Under “Response Bank” set the first option, “Table”, to the data table you created for storing responses (e.g. MiniIPIPResponses).

Under the Templates tab, you can add extra instructions under the instructions field (which can also be set from the ‘instructions’ column of your flat item table). Also, the “Show page info” enables the pages to be numbered which shows the test-taker how many pages they have to complete the test.
Save all settings to return to the flow chart test structure.
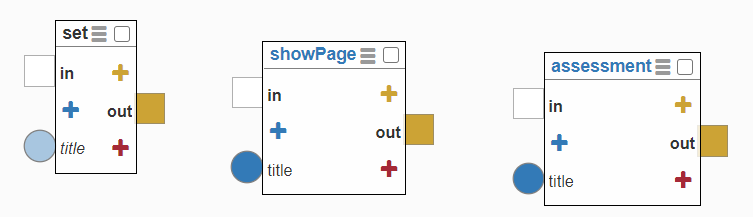
For both the showPage and assessment nodes, add inputs by clicking the left blue cross and selecting “title” from the “Exposed inputs”.
Back in the flow chart test structure click on “title” on the aforementioned nodes. Select “Flow variable pointer”. This allows the title from the set page to be carried on through the other nodes.
Again, this can be repeated for any other variables you set on the set node.
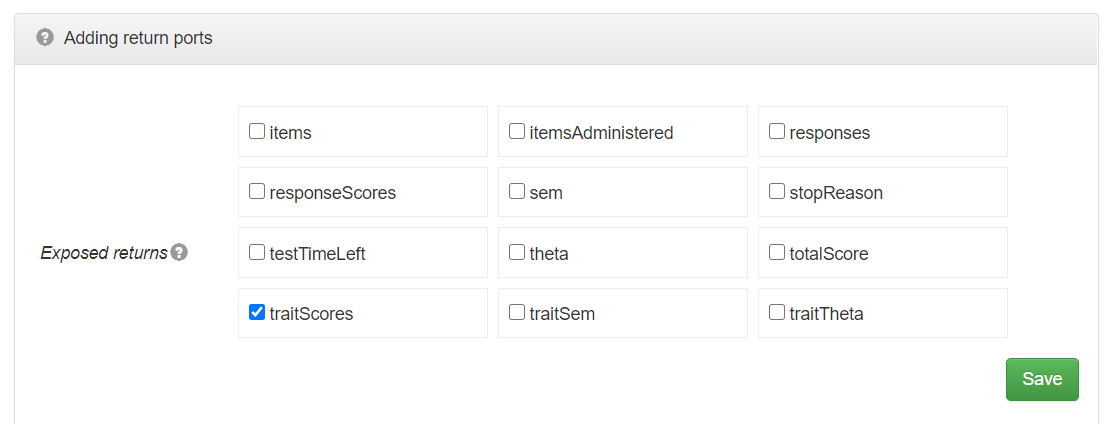
On the assessment node, click on the red cross on the right side to add a score output. Under “Exposed returns” select “traitScores” and save to return to test flow chart structure.
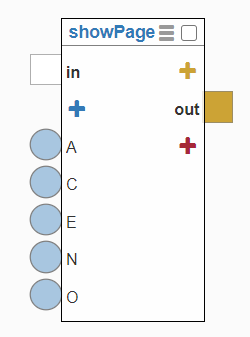
Create a showPage node by right clicking and selecting the showPage option. This is where feedback or scores will be relayed to the participant.
For this tutorial, the big Five personality traits, so “responseTraits” we can assign values of “O” for openness, “C” for conscientiousness, “E” for extraversion, “A” for agreeableness and “N” for neuroticism. So, to provide individual response trait scores, on the showPage node, add individual “Dynamic inputs” (by clicking the blue left cross on the node) called “O”, “C”, “E”, “A”, “N”.
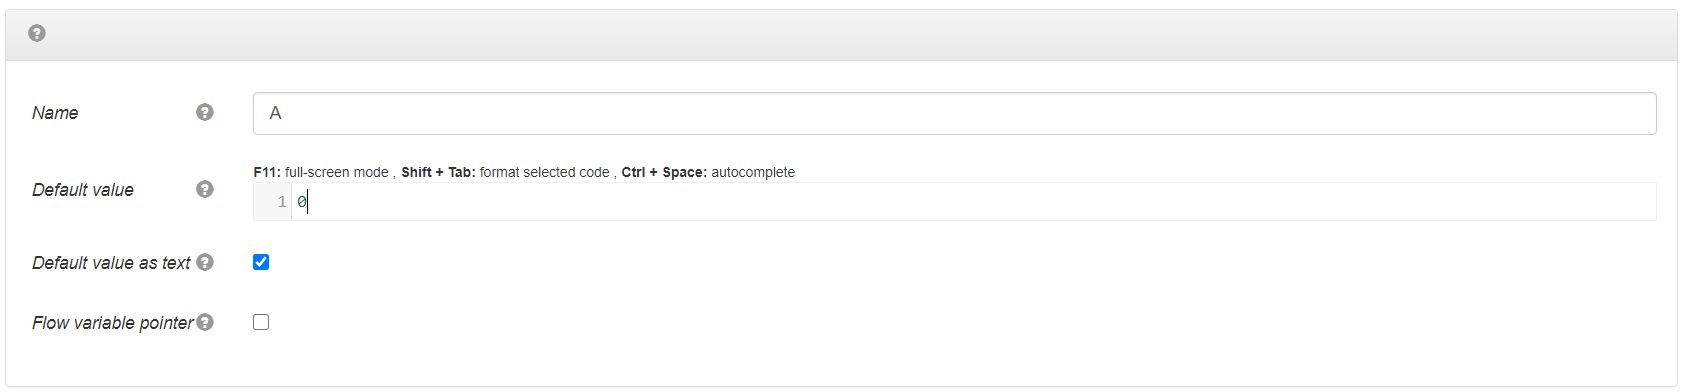
Make sure that each input has an initial default score of zero. To do this, click on the input letter on the showPage node. Set the “Default value” as “0” and select the “Default value as text” box.
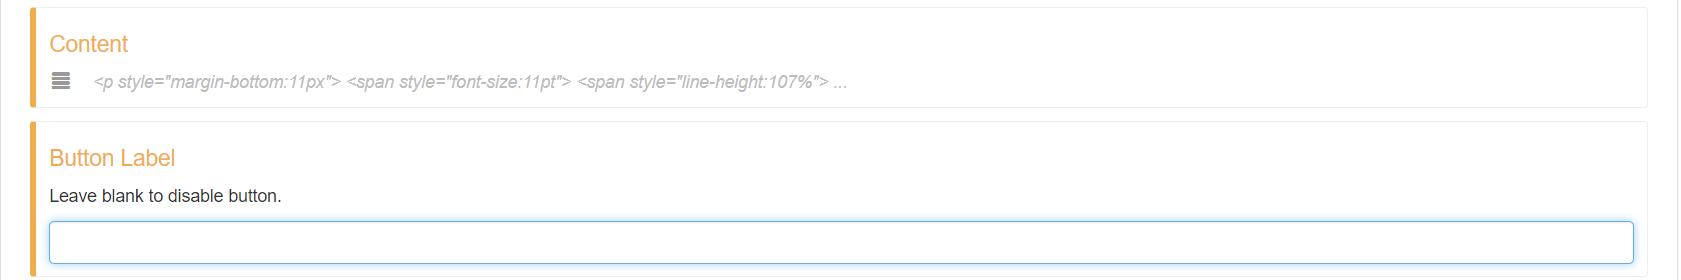
Open the showPage node, fill in the Title of the test and under “Content” you can present the feedback using code like the following:
Your scores are:
Openness: {{O}}
Conscientiousness: {{C}}
Extraversion: {{E}}
Agreeableness: {{A}}
Neuroticism: {{N}}
The Button Label text may be deleted as this is the final page of the test.
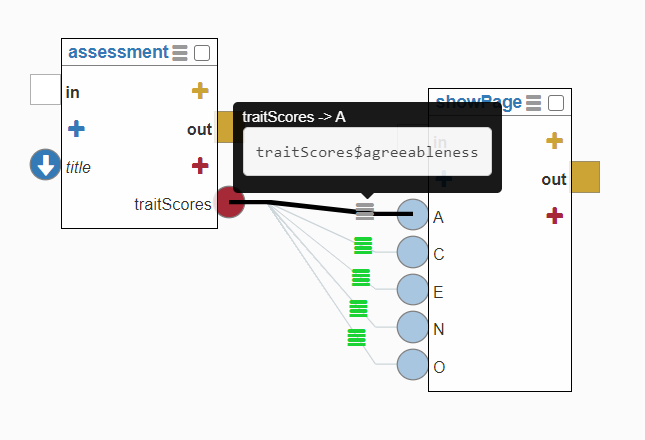
Connect the “traitScores” on the assessment node to the five individual trait inputs on the showPage node. On the connections, click the three green lines to assign the correct trait scores to each trait. For example, for agreeableness (A), write
traitScores$agreeablenessRepeat this labelling for the other traits.
Add “title” as an “Exposed input” on the showPage node, as with previous nodes, and select “title”. Then select the “Flow variable pointer”.
Finally, connect together the nodes to complete the test.
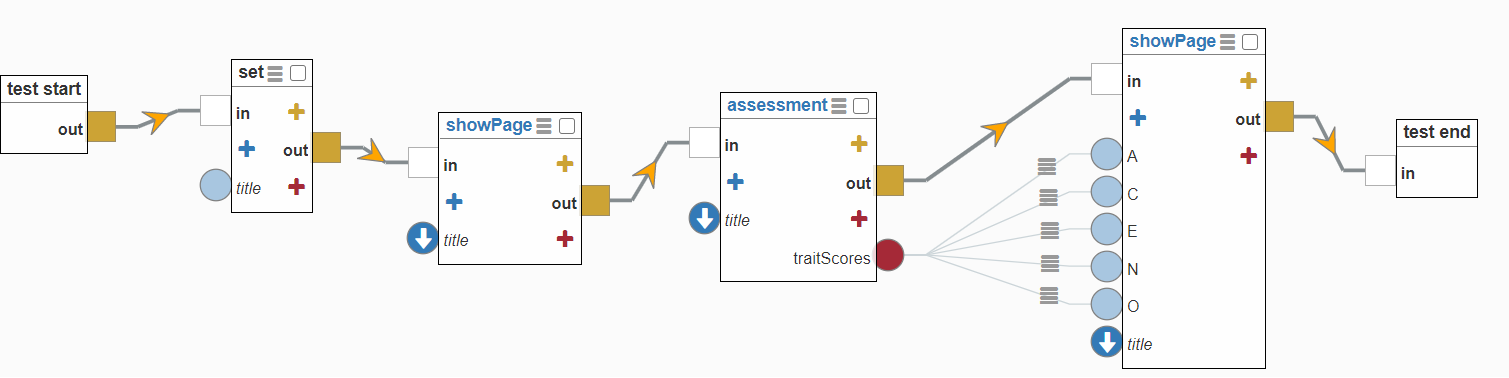
You have now completed a full test! You can then run your test to check it works. After running the test a few times, you can also check the data table to see how the data is saved.