debugging.md - brainchildservices/curriculum GitHub Wiki
Slide 1
Debug JavaScript
Step 1: Reproduce the bug
Finding a series of actions that consistently reproduces a bug is always the first step to debugging.
-
Save the Demo file to your local drive Demo.html and run it.
-
Enter 5 in the Number 1 text box.
-
Enter 1 in the Number 2 text box.
-
Click Add Number
1and Number2. The label below the button says5 + 1 = 51. The result should be6. This is the bug you're going to fix.
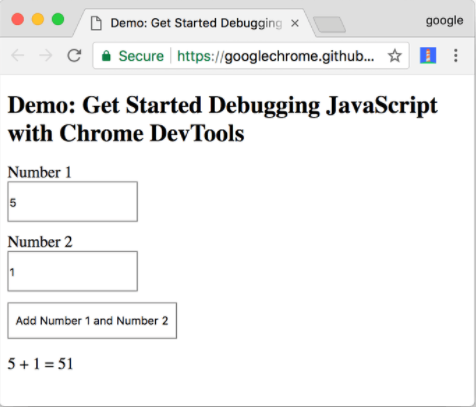
Figure 1. The result of 5 + 1 is 51. It should be 6.
Slide 2
Step 2: Get familiar with the Sources panel UI
DevTools provides a lot of different tools for different tasks, such as changing CSS, profiling page load performance, and monitoring network requests. The Sources panel is where you debug JavaScript.
- Open DevTools by pressing F12 or Control+Shift+I (Windows, Linux). This shortcut opens the Console panel. Command+Option+I on Mac
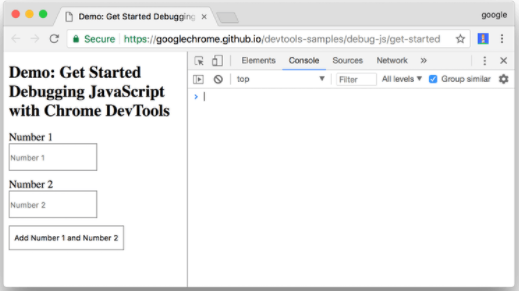
Figure 2. The Console panel
Slide 3
- Click the Sources tab.
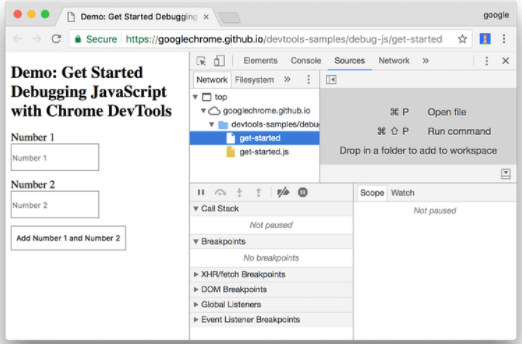
Figure 3. The Sources panel
Slide 3 Downwards
The Sources panel UI has 3 parts:
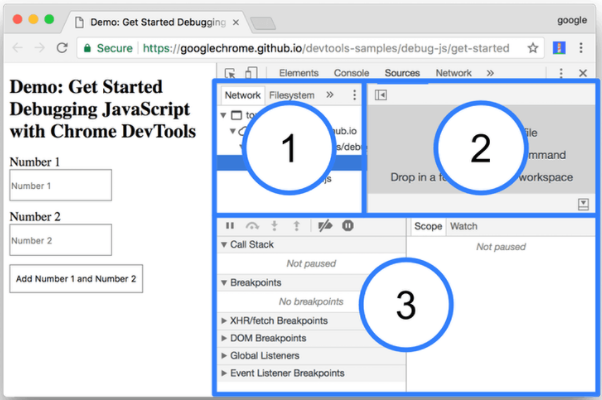
Figure 4. The 3 parts of the Sources panel UI
  * The File Navigator pane. Every file that the page requests is listed here.
  * The Code Editor pane. After selecting a file in the File Navigator pane, the contents of that file are displayed here.
  * The JavaScript Debugging pane. Various tools for inspecting the page's JavaScript. If your DevTools window is wide, this pane is displayed to the
  right of the Code Editor pane.
Slide 4
Step 3: Pause the code with a breakpoint
A common method for debugging a problem like this is to insert a lot of console.log() statements into the code, in order to inspect values as the script executes. For example:
  function updateLabel() {
    var addend1 = getNumber1();
    console.log('addend1:', addend1);
    var addend2 = getNumber2();
    console.log('addend2:', addend2);
    var sum = addend1 + addend2;
    console.log('sum:', sum);
    label.textContent = addend1 + ' + ' + addend2 + ' = ' + sum;
  }
Slide 4 DownWards
The console.log() method may get the job done, but breakpoints can get it done faster. A breakpoint lets you pause your code in the middle of its
execution, and examine all values at that moment in time. Breakpoints have a few advantages over the console.log() method:
- With
console.log(), you need to manually open the source code, find the relevant code, insert theconsole.log()statements, and then reload the page in order to see the messages in the Console. With breakpoints, you can pause on the relevant code without even knowing how the code is structured. - In your
console.log()statements you need to explicitly specify each value that you want to inspect. With breakpoints, DevTools shows you the values of all variables at that moment in time. Sometimes there are variables affecting your code that you're not even aware of.
Slide 4 DownWards
In short, breakpoints can help you find and fix bugs faster than the console.log() method.
If you take a step back and think about how the app works, you can make an educated guess that the incorrect sum (5 + 1 = 51) gets computed in the
click event listener that's associated to the Add Number 1 and Number 2 button. Therefore, you probably want to pause the code around the time that
the click listener executes. Event Listener Breakpoints let you do exactly that:
-
In the JavaScript Debugging pane, click Event Listener Breakpoints to expand the section. DevTools reveals a list of expandable event categories, such as Animation and Clipboard.
-
Next to the Mouse event category, click Expand
 . DevTools reveals a list of mouse events, such as click and mousedown. Each event has a checkbox next to it.
 -
Check the click checkbox. DevTools is now set up to automatically pause when
any clickevent listener executes.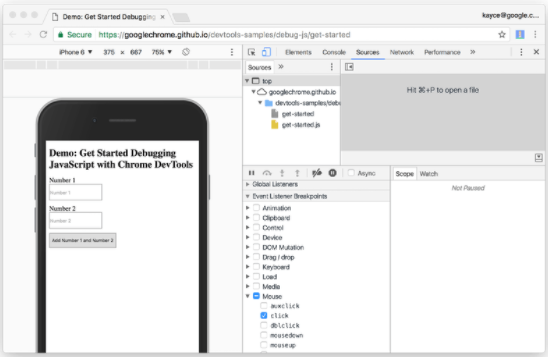
Figure 5. The click checkbox is enabled
-
Back on the demo, click Add Number 1 and Number 2 again. DevTools pauses the demo and highlights a line of code in the Sources panel. DevTools should be paused on this line of code:
function onClick() {If you're paused on a different line of code, press Resume Script Execution
 until you're paused on the correct line.
Slide 5
Step 4: Step through the code
One common cause of bugs is when a script executes in the wrong order. Stepping through your code enables you to walk through your code's execution, one line at a time, and figure out exactly where it's executing in a different order than you expected. Try it now:
-
On the Sources panel of DevTools, click Step into next function call
 to step through the execution of the onClick() function, one line at a time. DevTools highlights the following line of
code:
to step through the execution of the onClick() function, one line at a time. DevTools highlights the following line of
code:if (inputsAreEmpty()) { -
Click Step over next function call
 .
DevTools executes inputsAreEmpty() without stepping into it. Notice how DevTools skips a few lines of code. This is because inputsAreEmpty()
evaluated to false, so the if statement's block of code didn't execute.
.
DevTools executes inputsAreEmpty() without stepping into it. Notice how DevTools skips a few lines of code. This is because inputsAreEmpty()
evaluated to false, so the if statement's block of code didn't execute.
Slide 6
Step 5: Set a line-of-code breakpoint
Line-of-code breakpoints are the most common type of breakpoint. When you've got a specific line of code that you want to pause on, use a line-of-code breakpoint:
-
Look at the last line of code in updateLabel():
label.textContent = addend1 + ' + ' + addend2 + ' = ' + sum;
-
To the left of the code you can see the line number of this particular line of code, which is 32. Click on 32. DevTools puts a blue icon on top of 32. This means that there is a line-of-code breakpoint on this line. DevTools now always pauses before this line of code is executed.
-
Click Resume script execution Resume Script Execution. The script continues executing until it reaches line 32. On lines 29, 30, and 31, DevTools prints out the values of addend1, addend2, and sum to the right of each line's semi-colon.
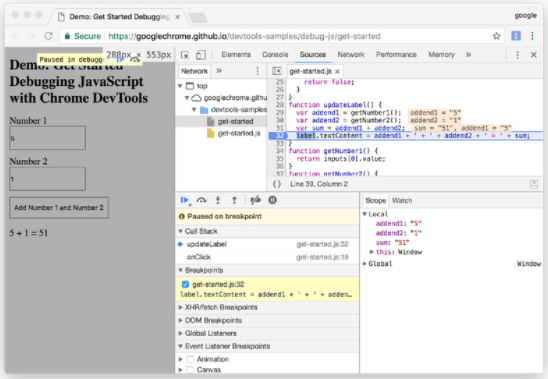
Figure 6. DevTools pauses on the line-of-code breakpoint on line 32
For more Visit :- https://developer.chrome.com/docs/devtools/workspaces/