Assignment 3 : Data set Pathway and Network Analysis - bcb420-2023/Metyu_Melkonyan GitHub Wiki
Part 1: Non-thresholded Gene set Enrichment Analysis
Objectives
- To analyze C2 Reactom Geneset published 2023 by using Non-thresholded gene enrichment analysis
- Doing pre-ranked analysis on the geneset containing different species' reaction pathways
- Summarizing gene enrichment results, defining key genes from the Reactome geneset, underlying the validity of the pre-ranked geneset from the analysis
- Comparing thresholded analysis from Assignment 2 to the non-thresholded analysis in Assignment 3
GSEA: Computational method that allows previously defined genes to show statistical significance in terms of over-expression or down-expression. Which indicates the phenotype associated with the trait. GSEA uses statistical approaches to come up with the highest enriched gene pathways associated with either geneset along with the pre-ranked gene list or geneset per se.
Jaccard Similarity Coefficient: it is a similarity or difference between two datasets of shared and distinct features. The Jaccard similarity coefficient defines how similar two geneset are. The similarity coefficient index is set from 0-1 in a way to set up the cut-off.
Cytoscape: it is an open-source program that allows visualization of enriched gene maps by using different apps, and parameters as well as different analyses such as post-analysis by using different genesets.
Duration
Date started: 25 March 2023 Data finished: 28 March 2023
Time estimated: ~4 hours| Time took: ~5 hours
Steps Taken
- Downloaded the geneset
- Analyzed the geneset
- Used GSEA for pre-ranked gene enrichment analysis
- Compared gene enrichment results to the thresholded gene enrichment results
- Used stringent search parameters to detect genes from different Reactome genesets including pathways from different species.
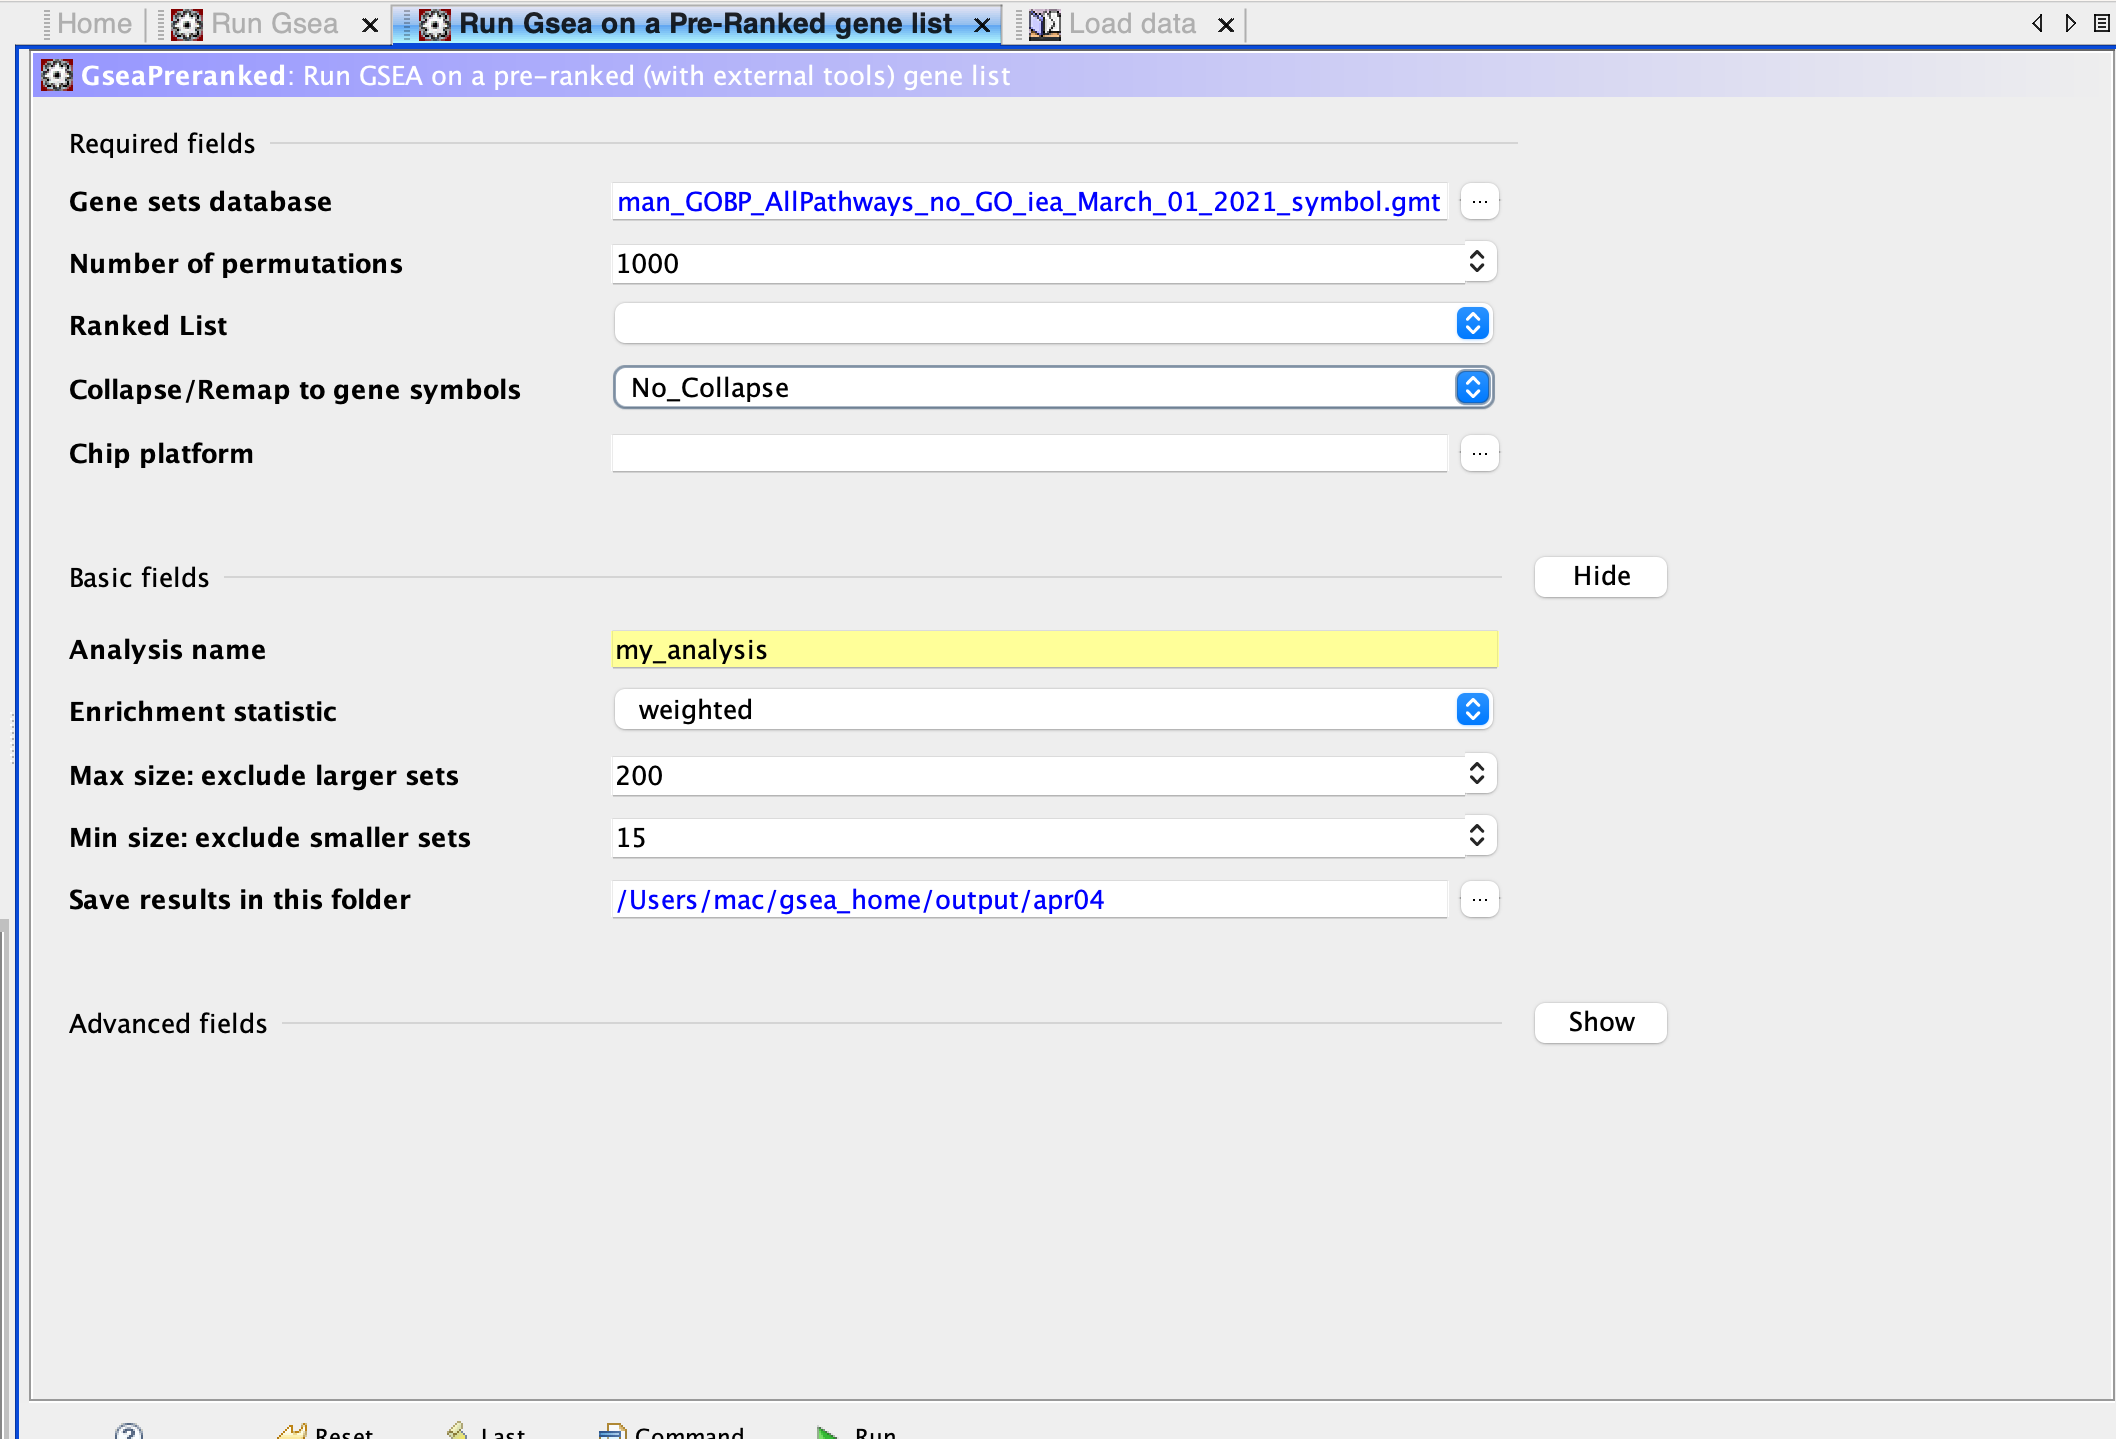
Figure 1 GSEA running on Pre-ranked Gene List Panel: I used no collapse to remap gene symbols to avoid confusion. 200 max gene size and 15 min gene size to have more stringent values. I used 1000 permutations that allowed for a shorter running time.
Conclusion
The enrichment results outline the gene pathways along with genesets associated with those pathways to be similar to those I observed in my thresholded gene enrichment analysis by using g:Profile.
Part 2: Visualize your Gene set Enrichment Analysis in Cytoscape
Objectives
- Visualize the geneset by using the GSEA enrichment map visualization tool.
- Getting accustomed to using the GSEA and Cytoscape integrating enrichment map tools with pathway analysis tools
- Using Genemania to further enrich the pathway analysis.
Duration
Date started: 25 March 2023 Data finished: March 28 2023
Time estimated: ~5 hours| Time took: ~8 hours
Steps Taken
- Used Cytoscape for gene enrichment visualization
- Analyzed Reactome data and investigated reaction image
- Annotated genes by using Reactome and GeneMania geneset Bader lab genesets
- Analyzed nodes & edges , visualizing publication ready figure
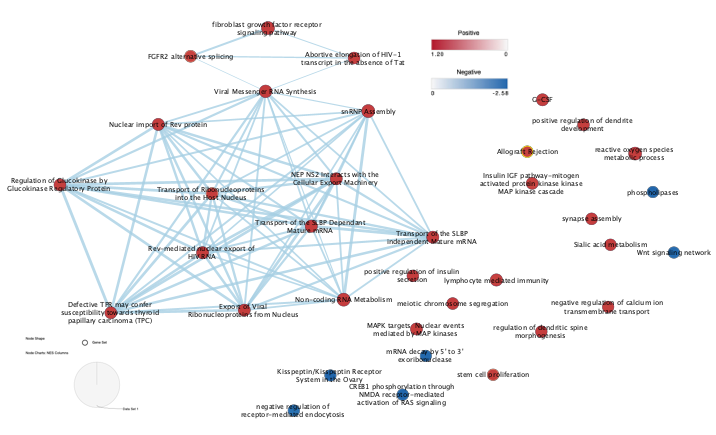
Figure 2 Preliminary Cytoscape Pathway Enrichment Visualization: Both apoptotic and viral gene set are separated from each other. Mesenchymal apoptotic gene sets are apparent. Both upregulated (Red) and downregulated (Blue) gene sets are observed. This includes the whole enrichment map.
Conclusion
I have concluded with the finding that there is a strong viral effect that correlates to what the main paper authors proved that the cancerous genes are involved in mainly apoptosis and reactive oxygen species(ROS) including. There is also viral oncogenic gene clustering. Most of the oncogenic genes are not associating with one another via different pathways. The visualization allowed me to better understand the interaction between these viral pathways and find out their interaction between cancer and viral gene sets. Furthermore, the analyisis on part 3 is conclusive. This enrichment map analysis paves a path for the signature geneset analysis to further nail down into cancer.
Part 3: Signature Geneset analysis: Drug Bank p53
Objectives
- Post analyzes the geneset and understand if there is any association between the viral genes and p53 (Guardian of the genome)
- Analyze the geneset based on the conclusion the main paper's authors made
DrugBank: Drugbank contains a lot of different datasets of genes, transcription factors or different enhancers that are associated with disease-given responsible genes in the datasets. I chose the p53 dataset to strengthen my previous hypothesis of cancerous viral genes are responsible for pancreas cancer apoptosis. My analysis concluded that there is indeed a relationship between viral cancer genes and p53 associated cancer pathways.

Figure 3 Signature gene set p53 against all gene sets enriched: Post analysis coefficient of 0.25 Mann-Whitney cut-off (Two-sided) was used. Post-analysis results also show that p63 is mainly involved in reactive oxygen species (ROS) metabolism. ROS are known to be tumor growth promoters which then cause EMT in different human tissues as well as trigger cancer of different type. Portion of the previous figure was cropped, due to complications in the figure. The strong interaction with edges is apparent.
Duration
Date started: 26 March 2023 Data finished: March 28 2023
Time estimated: ~3 hours | Time took: ~5 hours
Steps Taken
- Analyzed and decided on p53 geneset from Bader's lab geneset results of 1 March 2023
- Analyzed gene enrichment data to see if there is the interaction between p53 and viral genes
- Analyzed the Reactome database along with GeneMania to see if the viral oncogenic genes are associated with one another
Conclusion
The guardian of the genome shows strong relationships both physically and in terms of the pathway. This concludes the authors' conclusion of the underestimated viral effect and sialic acid effect. Physical interaction is more prevalent than other types of interactions such as pathways. There is still research required in this field to further elaborate the sub-type switching genes' relationship with viruses such as HIV-1 and Epstein-Barr Virus. This report is conclusive because I specifically look at both sialic acid effect, virus effect and their interaction between the guardin of genome (p53) Furth research should adress the underestimated virus effect on both liver and pancreas cancer types. It is important to find out the malignant effect of both HIV and Epstein Bar Virus on sub-type switching in pancreas cancer.
Reference
-
Adams, Christina R, Htet Htwe Htwe, Timothy Marsh, Aprilgate L Wang, Megan L Montoya, Lakshmipriya Subbaraj, Aaron D Tward, Nabeel Bardeesy, and Rushika M Perera. 2019. “Transcriptional Control of Subtype Switching Ensures Adaptation and Growth of Pancreatic Cancer.” Elife 8: e45313.
-
Allaire, JJ, Yihui Xie, Jonathan McPherson, Javier Luraschi, Kevin Ushey, Aron Atkins, Hadley Wickham, Joe Cheng, Winston Chang, and Richard Iannone. 2021. rmarkdown: Dynamic Documents for R. https://github.com/rstudio/rmarkdown.
-
Aloni-Grinstein, Ronit, Meital Charni-Natan, Hilla Solomon, and Varda Rotter. 2018. “P53 and the Viral Connection: Back into the Future ‡.” Cancers 10 (6). https://doi.org/10.3390/cancers10060178.
-
Gillespie, Marc, Bijay Jassal, Ralf Stephan, Marija Milacic, Karen Rothfels, Andrea Senff-Ribeiro, Johannes Griss, et al. 2021. “The reactome pathway knowledgebase 2022.” Nucleic Acids Research 50 (D1): D687–92. https://doi.org/10.1093/nar/gkab1028.
-
Kamiza, Abram Bunya, Segun Fatumo, Mwiza Gideon Singini, Chih-Ching Yeh, and Tinashe Chikowore. 2022. “Hepatitis B Infection Is Causally Associated with Extrahepatic Cancers: A Mendelian Randomization Study.” EBioMedicine 79 (April): 104003.
-
Merico, Ruth AND Stueker, Daniele AND Isserlin. 2010. “Enrichment Map: A Network-Based Method for Gene-Set Enrichment Visualization and Interpretation.” PLOS ONE 5 (11): 1–12. https://doi.org/10.1371/journal.pone.0013984.
-
Munkley, Jennifer, and Emma Scott. 2019. “Targeting Aberrant Sialylation to Treat Cancer.” Medicines (Basel) 6 (4). R Core Team. 2022. R: A Language and Environment for Statistical Computing. Vienna, Austria: R Foundation for Statistical Computing. https://www.r-project.org/.
-
Shannon, Paul, Andrew Markiel, Owen Ozier, Nitin S Baliga, Jonathan T Wang, Daniel Ramage, Nada Amin, Benno Schwikowski, and Trey Ideker. 2003. “Cytoscape: A Software Environment for Integrated Models of Biomolecular Interaction Networks.” Genome Res 13 (11): 2498–2504.
-
Subramanian, Aravind, Pablo Tamayo, Vamsi K. Mootha, Sayan Mukherjee, Benjamin L. Ebert, Michael A. Gillette, Amanda Paulovich, et al. 2005. “Gene Set Enrichment Analysis: A Knowledge-Based Approach for Interpreting Genome-Wide Expression Profiles.” Proceedings of the National Academy of Sciences 102 (43): 15545–50. https://doi.org/10.1073/pnas.0506580102.
-
Zhou, Xiaoman, Ganglong Yang, and Feng Guan. 2020. “Biological Functions and Analytical Strategies of Sialic Acids in Tumor.” Cells 9 (2). Zuberi, Khalid, Max Franz, Harold Rodriguez, Jason Montojo, Christian Tannus Lopes, Gary D Bader, and Quaid Morris. 2013. “GeneMANIA Prediction Server 2013 Update.” Nucleic Acids Res 41 (Web Server issue): W115–22.