ICP 14 - awais546/Big-Data-Programming-Hadoop-Pyspark GitHub Wiki
Big Data Programming Hadoop/Pyspark
Spark Mlib
Introduction
MLlib is Spark's scalable machine learning library consisting of common learning algorithms and utilities, including classification, regression, clustering, collaborative filtering, dimensionality reduction, as well as underlying optimization primitives
Tasks
1. Classification
Naïve Bayes
Use the following line of code to import the Naive Bayes.
from pyspark.ml.classification import NaiveBayes
Use the below line of code to import Decision Tree Classifier
from pyspark.ml.classification import DecisionTreeClassifier
Use the following line to import Random Forest classifier
from pyspark.ml.classification import RandomForestClassifier
To download the dataset go to the following link.
https://archive.ics.uci.edu/ml/datasets/Adult
The results of the three classifiers are shown below in the below screenshot.

Decision tree gives the best accuracy. The difference between all these algorithms are given below.
Naive Bayes vs Decision Tree

The probability between Decision tree and Random forest is almost equal.
When to Use Decision Tree?
-
When you want your model to be simple and explainable
-
When you want non parametric model
-
When you don't want to worry about feature selection or regularization or worry about multi-collinearity.
-
You can overfit the tree and build a model if you are sure of validation or test data set is going to be subset of training data set or almost overlapping instead of unexpected.
When to use Random Forest?
-
When you don't bother much about interpreting the model but want better accuracy.
-
Random forest will reduce variance part of error rather than bias part, so on a given training data set decision tree may be more accurate than a random forest. But on an unexpected validation data set, Random forest always wins in terms of accuracy.
2. Clustering
KMean Clustering
In order to use Kmean Clustering use the following line of code.
from pyspark.ml.clustering import KMeans
Use the following link to download the dataset.
https://archive.ics.uci.edu/ml/datasets/Diabetes+130-US+hospitals+for+years+1999-2008
Following are the result of Kmean Clustering.
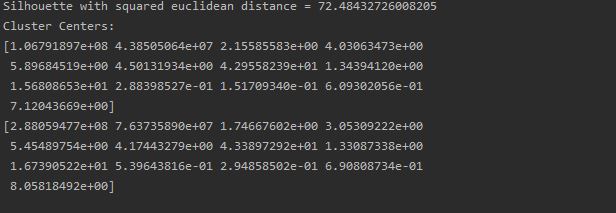
The K-means algorithm identifies k number of centroids, and then allocates every data point to the nearest cluster, while keeping the centroids as small as possible.
3. Regression
- Linear regression
Simple linear regression is useful for finding relationship between two continuous variables. One is predictor or independent variable and other is response or dependent variable. It looks for statistical relationship but not deterministic relationship.
To import linear regression module use the following piece of code.
from pyspark.ml.regression import LinearRegression
To download the dataset use the following link.
https://archive.ics.uci.edu/ml/datasets/Automobile
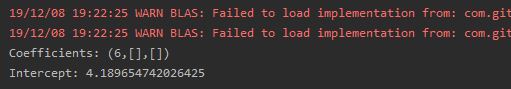
The root mean square error is as follows.

- Logistic Regression
Use the following line to import logistic regression.
Logistic regression is a statistical model that in its basic form uses a logistic function to model a binary dependent variable, although many more complex extensions exist. In regression analysis, logistic regression (or logit regression) is estimating the parameters of a logistic model (a form of binary regression).
from pyspark.ml.classification import LogisticRegression
The results are as follows.
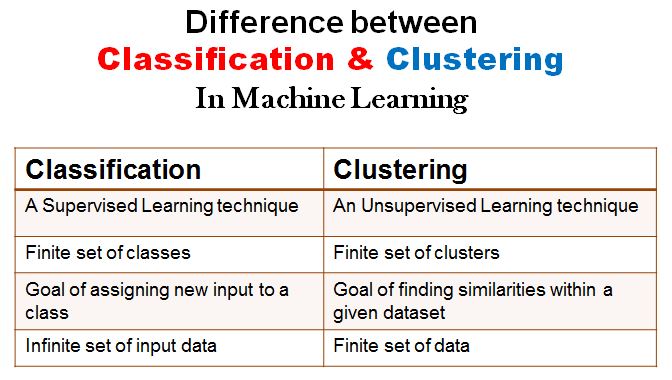
Difference between classification and clustering