ICP 12 - awais546/Big-Data-Programming-Hadoop-Pyspark GitHub Wiki
Big Data Programming Hadoop/Pyspark
GraphX and GraphFrames
Introduction
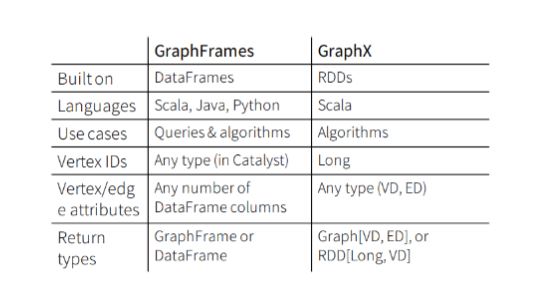
GraphFrames is a package for Apache Spark which provides DataFrame-based Graphs. It provides high-level APIs in Scala, Java, and Python. The difference between GraphX and GraphFrames are as follows.
Installations
For this ICP we first had to download some packages. Download the graphframes jar file from the following link.
https://spark-packages.org/package/graphframes/graphframes
Add the following line in code or make an environment variable.
os.environ["PYSPARK_SUBMIT_ARGS"] = ("--packages graphframes:graphframes:0.5.0-spark2.0-s_2.11 pyspark-shell")
In python you can download the packages through pip as well. Run the following command in command prompt.
python -m pip install graphframes
ICP Task
In this ICP we had to perform graphframes functions on a dataset. To download the datasets use the following link.
https://umkc.app.box.com/s/1drojp9ndqhlpee0gdvuvwuygk8phdyb
The ICP tasks had 10 parts. The description of each part and the output of screenshot is given below.
1. Import the dataset as a csv file and create data framesdirectly on importthan create graph out of the data frame created. Use the following commands to load the csv files.
df_station = sqlContext.read.csv("201508_station_data.csv", inferSchema = True, header = True)
df_trip = sqlContext.read.csv("201508_trip_data.csv", inferSchema = True, header = True)
To make the graph use the following command.
g = GraphFrame(df_station, df_trip) #(vertices,edges)
Make sure in the vertices dataframe there must be column names as follows.
- id
In the edges dataframe there should be the following column names.
- src
- dst
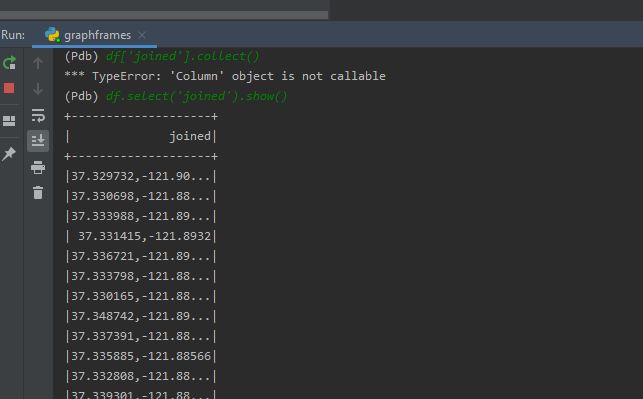
2. Concatenate chunks into list & convert to DataFrame
In order to join the two columns use the following command. I have joined two columns. 'lat' and 'long'.
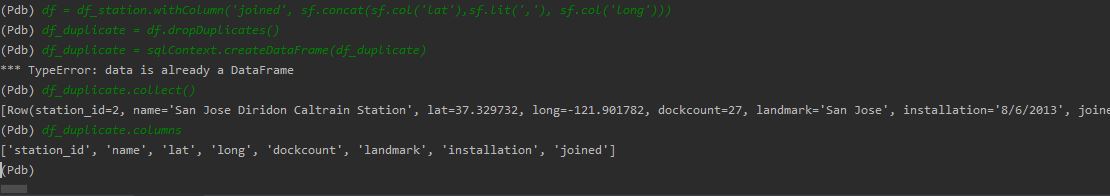
3. Remove duplicates.
To remove the duplicates use the following line.
df_duplicate = df.dropDuplicates()
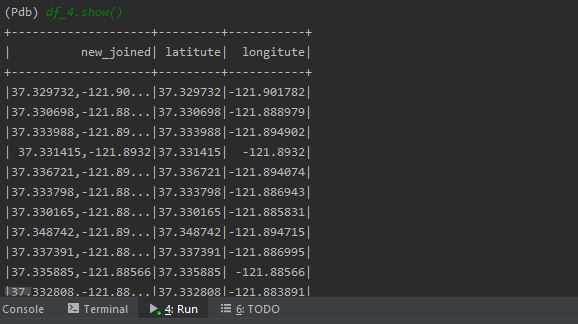
4. Name Columns
Use the following code for renaming the columns and save it in a dataframe.
df_4 = df.selectExpr("joined as new_joined", "lat as latitute","long as longitute")
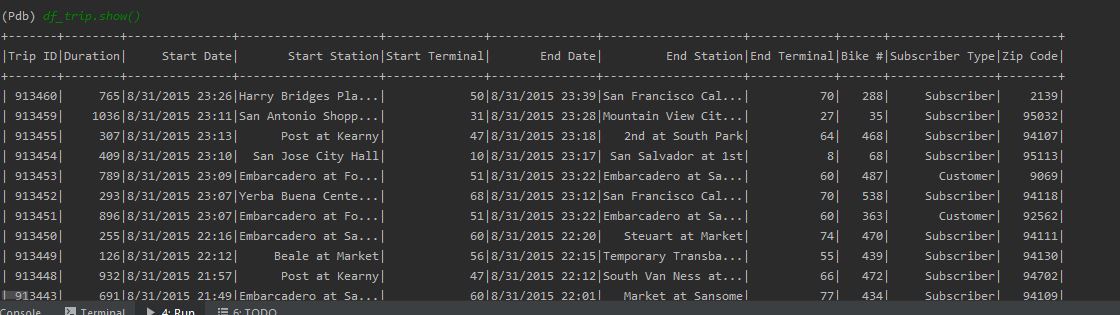
5. Output DataFrame.
In order to print the dataframe use the following command.
df_trip.show()
6. Create vertices.
Graph vertices are made when we make the graph. In the above example df_station dataframe is the vertices dataframe.
g = GraphFrame(df_station, df_trip) #(vertices,edges)
7. Show Vertices.
When the graph object is made we can show the vertices of it by executing the following line.
g.vertices.show()

8. Show edges.
In order to show the edges use the following command.
g.edges.show()

9. Vertex in-Degree
Run the following command to show the Degrees.
g.degrees.show()

10. Vertex in degree and out degree.
g.indegrees.show()
g.outdegrees.show()

11. Apply the motif findings.
In order to find the paths of two vertices (find motifs). Use the following line of code. In my example I am showing all the possible paths from 50 to 70.
g.find("(50)-[]->(70)").show()
