Chart gallery - archofthings/home-assistant-frank-energie GitHub Wiki
Ready-to-use dashboard cards. Add a card with Edit dashboard → Add card → Manual and paste the YAML.
Prices
- Today's prices
- Today and tomorrow
- The next 12 hours
- Gas price, today and tomorrow
- Current price gauge
- Price overview
- Upcoming prices as a table
- Price history
Price analysis
Usage and costs 🔑
- Yesterday per hour
- Costs per day
- Usage and feed-in per day
- Costs per month
- Usage per month
- Invoices per month, this year and last year
- This month: actual and expected
- This month at a glance
- Cost breakdown this month
- Month chart with navigation
- Real and saved costs per month
| Cards marked | Need |
|---|---|
| ApexCharts | The ApexCharts Card from HACS |
| Mushroom | The Mushroom cards from HACS, version 5 or newer |
| Built-in | Nothing extra |
Each card says which sensor group it needs. Replace the entity IDs with yours if they differ, see About entity IDs.
-
Hourly or quarter-hour prices: the cards use
30 * 60 * 1000(half an hour) to centre the columns on hourly prices. With quarter-hour prices change it to7.5 * 60 * 1000, in thedata_generatorlines and in the tooltip. -
Scale: set
maxof the price axis to a little above your highest price, andmaxof the solar axis to your peak production in kWh per hour. - Use one column series with colours per column; a separate series per colour makes the columns very narrow.
- Don't return
nullvalues and don't use anareaseries; the card then stays on "Loading". - When you change a card: a series returns either
[time, value]pairs, or{ x, y, fillColor }objects for coloured columns. Use the objects only on an axis with a fixedminandmax; on an automatic axis the card stays on "Loading". - With
show_states: true, a series that returns{ x, y, fillColor }objects shows "N/A" in the header. Addshow:→in_header: rawto that series; the header then shows the state of the entity, here the current price. - If a card shows nothing at all, check that the pasted
data_generatorcode is complete. One cut-off line stops the whole card. -
Stacked columns: leave out the card's own
yaxis:list and set the axis underapex_config; with ayaxis:list the columns stand next to each other. Give every series one value per day or month (0 where there is no data), otherwise the columns become very thin. - A card with
update_intervalonly reloads on that timer and ignores changes of its entity. Leave it out when a helper should switch the chart. - The tooltip uses Dutch date notation (
nl-NL); change it to your own, for exampleen-GB.
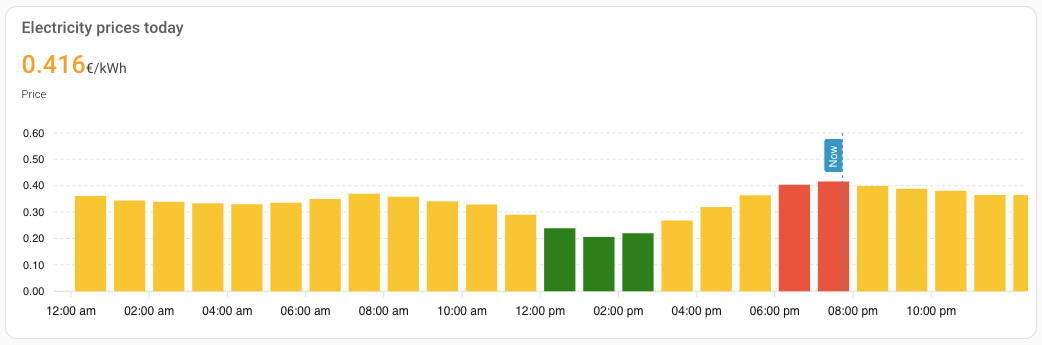
ApexCharts. Needs: nothing extra (works without the price analysis). Columns are coloured with two prices you set in the card itself.
Show YAML
type: custom:apexcharts-card
header:
  show: true
  title: Electricity prices today
  show_states: true
  colorize_states: true
graph_span: 24h
span:
  start: day
now:
  show: true
  label: Now
yaxis:
  - id: price
    decimals: 2
    min: 0
    max: 0.6
series:
  - entity: sensor.frank_energie_prices_current_electricity_price_all_in
    name: Price
    type: column
    yaxis_id: price
    float_precision: 3
    unit: €/kWh
    show:
      in_header: raw
    data_generator: >
      const cheap = 0.25;

      const expensive = 0.40;

      const prices = entity.attributes.prices;

      if (!prices || prices.length === 0) {
        return [{ x: Date.now(), y: 0 }];
      }

      return prices.map((p) => {
        const x = new Date(p.from).getTime() + 30 * 60 * 1000;
        const color = p.price > expensive ? '#F44336' : (p.price <= cheap ? 'green' : '#FFC107');
        return { x: x, y: p.price, fillColor: color };
      });
apex_config:
  chart:
    height: 220
  xaxis:
    labels:
      datetimeUTC: false
  plotOptions:
    bar:
      columnWidth: 80%
  tooltip:
    x:
      formatter: |
        EVAL:function(val) {
          const realStart = new Date(val - 30 * 60 * 1000);
          return realStart.toLocaleString('nl-NL', { day: 'numeric', month: 'short', hour: '2-digit', minute: '2-digit' });
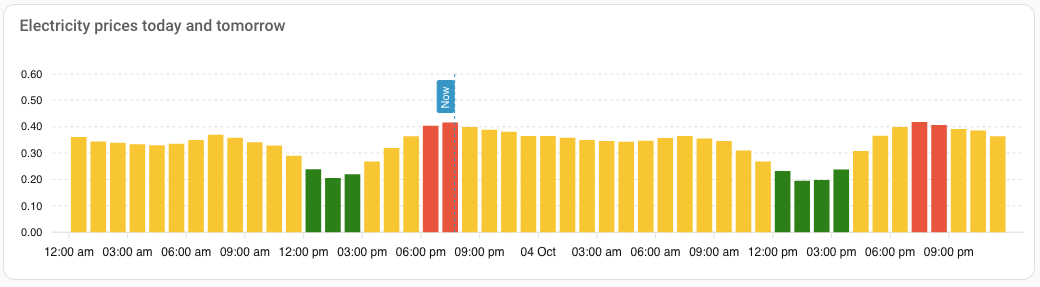
}ApexCharts. Needs: nothing extra. Shows 48 hours; the second half fills in when tomorrow's prices are published.
Show YAML
type: custom:apexcharts-card
header:
  show: true
  title: Electricity prices today and tomorrow
graph_span: 48h
span:
  start: day
now:
  show: true
  label: Now
yaxis:
  - id: price
    decimals: 2
    min: 0
    max: 0.6
series:
  - entity: sensor.frank_energie_prices_current_electricity_price_all_in
    name: Price
    type: column
    yaxis_id: price
    float_precision: 3
    unit: €/kWh
    data_generator: >
      const cheap = 0.25;

      const expensive = 0.40;

      const prices = entity.attributes.prices;

      if (!prices || prices.length === 0) {
        return [{ x: Date.now(), y: 0 }];
      }

      return prices.map((p) => {
        const x = new Date(p.from).getTime() + 30 * 60 * 1000;
        const color = p.price > expensive ? '#F44336' : (p.price <= cheap ? 'green' : '#FFC107');
        return { x: x, y: p.price, fillColor: color };
      });
apex_config:
  chart:
    height: 220
  xaxis:
    labels:
      datetimeUTC: false
  plotOptions:
    bar:
      columnWidth: 80%
  tooltip:
    x:
      formatter: |
        EVAL:function(val) {
          const realStart = new Date(val - 30 * 60 * 1000);
          return realStart.toLocaleString('nl-NL', { day: 'numeric', month: 'short', hour: '2-digit', minute: '2-digit' });
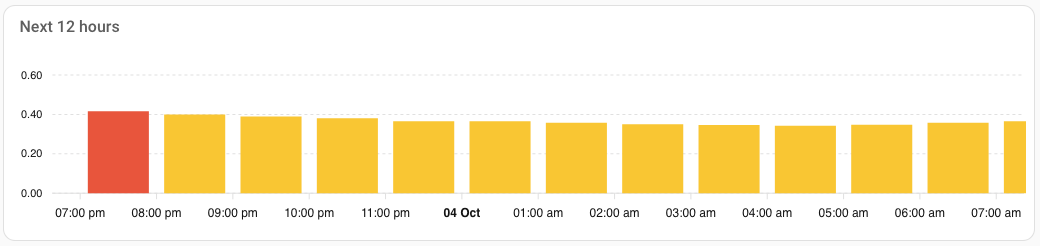
}ApexCharts. Needs: nothing extra. A compact chart that always starts at the current hour.
Show YAML
type: custom:apexcharts-card
header:
  show: true
  title: Next 12 hours
graph_span: 12h
span:
  start: hour
yaxis:
  - id: price
    decimals: 2
    min: 0
    max: 0.6
series:
  - entity: sensor.frank_energie_prices_current_electricity_price_all_in
    name: Price
    type: column
    yaxis_id: price
    float_precision: 3
    unit: €/kWh
    data_generator: >
      const cheap = 0.25;

      const expensive = 0.40;

      const prices = (entity.attributes.prices || []).filter((p) => new
      Date(p.till).getTime() > Date.now());

      if (prices.length === 0) {
        return [{ x: Date.now(), y: 0 }];
      }

      return prices.map((p) => {
        const x = new Date(p.from).getTime() + 30 * 60 * 1000;
        const color = p.price > expensive ? '#F44336' : (p.price <= cheap ? 'green' : '#FFC107');
        return { x: x, y: p.price, fillColor: color };
      });
apex_config:
  chart:
    height: 180
  xaxis:
    labels:
      datetimeUTC: false
  plotOptions:
    bar:
      columnWidth: 80%
  tooltip:
    x:
      formatter: |
        EVAL:function(val) {
          const realStart = new Date(val - 30 * 60 * 1000);
          return realStart.toLocaleString('nl-NL', { hour: '2-digit', minute: '2-digit' });
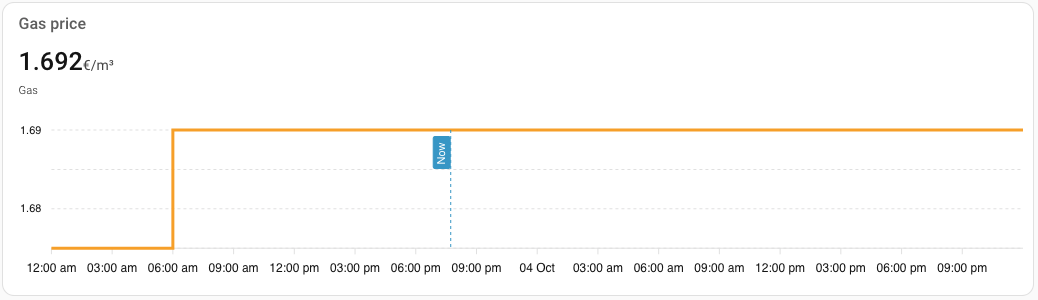
}ApexCharts. Needs: nothing extra. The gas price changes once a day, so a stepped line fits best.
Show YAML
type: custom:apexcharts-card
header:
  show: true
  title: Gas price
  show_states: true
graph_span: 48h
span:
  start: day
now:
  show: true
  label: Now
yaxis:
  - id: price
    decimals: 2
series:
  - entity: sensor.frank_energie_prices_current_gas_price_all_in
    name: Gas
    type: line
    curve: stepline
    yaxis_id: price
    float_precision: 3
    unit: €/m³
    stroke_width: 3
    data_generator: >
      const prices = entity.attributes.prices;

      if (!prices || prices.length === 0) {
        return [[Date.now(), 0]];
      }

      return prices.map((p) => {
        return [new Date(p.from).getTime(), p.price];
      });
apex_config:
  chart:
    height: 180
  xaxis:
    labels:
datetimeUTC: falseBuilt-in. Needs: nothing extra. Set the two severity prices to your own cheap and expensive price.
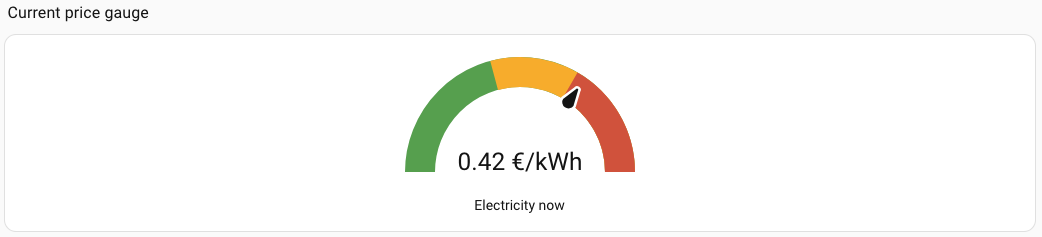
type: gauge
entity: sensor.frank_energie_prices_current_electricity_price_all_in
name: Electricity now
min: 0
max: 0.6
needle: true
severity:
  green: 0
  yellow: 0.25
red: 0.4Built-in. Needs: Daily statistics and Upcoming and tomorrow prices. Remove the rows of a group you don't use.
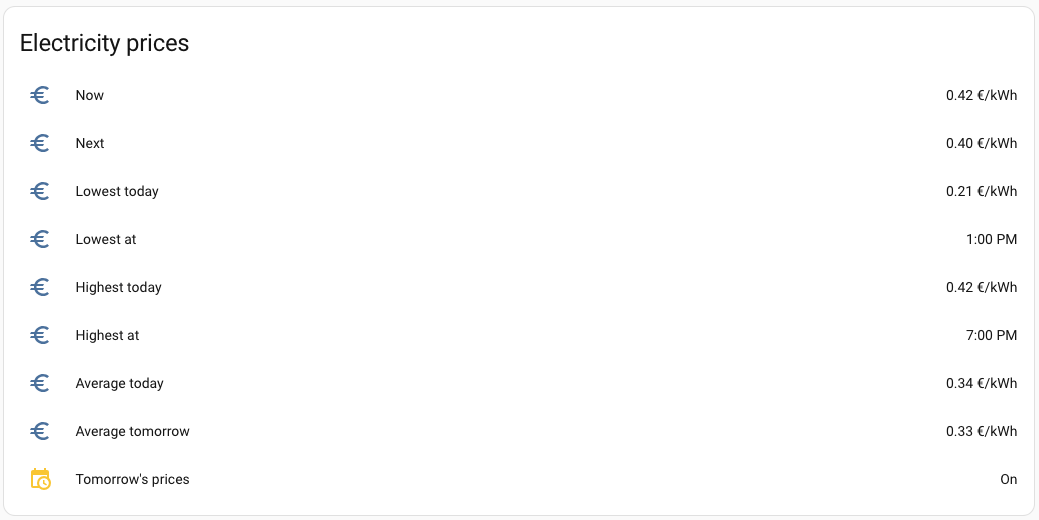
type: entities
title: Electricity prices
entities:
  - entity: sensor.frank_energie_prices_current_electricity_price_all_in
    name: Now
  - entity: sensor.frank_energie_prices_next_electricity_price_all_in
    name: Next
  - entity: sensor.frank_energie_prices_lowest_energy_price_today
    name: Lowest today
  - type: attribute
    entity: sensor.frank_energie_prices_lowest_energy_price_today
    attribute: from_time
    name: Lowest at
    format: time
  - entity: sensor.frank_energie_prices_highest_energy_price_today
    name: Highest today
  - type: attribute
    entity: sensor.frank_energie_prices_highest_energy_price_today
    attribute: from_time
    name: Highest at
    format: time
  - entity: sensor.frank_energie_prices_average_electricity_price_today
    name: Average today
  - entity: sensor.frank_energie_prices_average_electricity_price_tomorrow
    name: Average tomorrow
  - entity: binary_sensor.frank_energie_prices_tomorrow_s_prices_available
name: Tomorrow's pricesBuilt-in. Needs: nothing extra. Lists the next 12 slots; change [:12] for more or fewer.
type: markdown
title: Upcoming prices
content: |
  | Time | Price |
  |:--|--:|
  {% for p in (state_attr('sensor.frank_energie_prices_current_electricity_price_all_in', 'prices') | selectattr('till', 'gt', now()) | list)[:12] -%}
  | {{ (p['from'] | as_local).strftime('%H:%M') }} | € {{ '%.3f' | format(p.price) }} |
{% endfor %}Built-in. Needs: nothing extra. The average, lowest and highest all-in price per day over the last 30 days, from Home Assistant's long-term statistics.
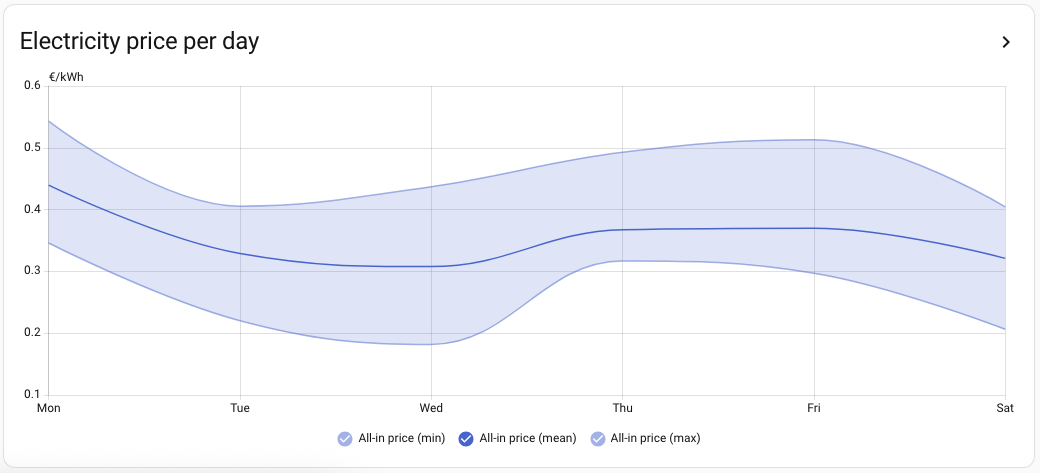
type: statistics-graph
title: Electricity price per day
entities:
  - entity: sensor.frank_energie_prices_current_electricity_price_all_in
    name: All-in price
period: day
days_to_show: 30
chart_type: line
stat_types:
  - mean
  - min
- maxThese cards need the Price analysis group. Colours: yellowgreen = cheap + solar, green = cheap, yellow = normal, red = expensive.
ApexCharts. Columns coloured by level, the solar forecast on the right axis, and an optional Sell line: the feed-in price of every slot, read from the prices attribute of Current electricity feed-in price (needs the Feed-in price sensor group, version 1.8.4 or newer). The same series works in the tomorrow card. Remove the Sell or Solar forecast series if you don't use them.
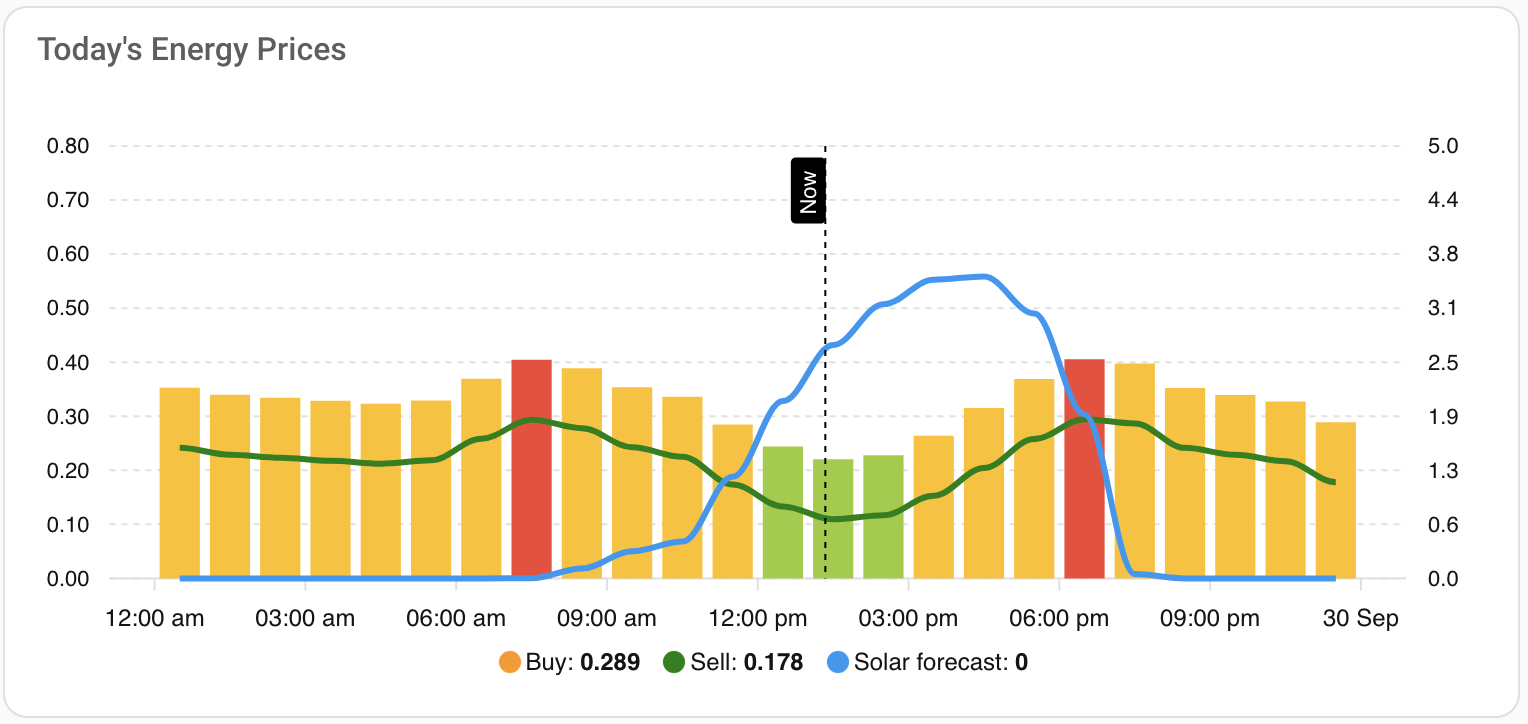
Show YAML
type: custom:apexcharts-card
header:
  show: true
  title: Today's Energy Prices
graph_span: 24h
span:
  start: day
now:
  show: true
  color: black
  label: Now
yaxis:
  - id: price
    decimals: 2
    min: 0
    max: 0.8
    apex_config:
      tickAmount: 8
  - id: solar
    opposite: true
    decimals: 1
    min: 0
    max: 5
series:
  - entity: sensor.frank_energie_prices_electricity_price_analysis_today
    name: Price
    type: column
    yaxis_id: price
    float_precision: 3
    data_generator: >
      if (!entity.attributes.slots || entity.attributes.slots.length === 0) {
        return [{ x: Date.now(), y: 0 }];
      }

      const colorMap = { cheap_solar: 'yellowgreen', cheap: 'green', normal:
      '#FFC107', expensive: '#F44336' };

      return entity.attributes.slots.map((p) => {
        const centeredX = new Date(p.from).getTime() + 30 * 60 * 1000;
        return { x: centeredX, y: p.price, fillColor: colorMap[p.level] };
      });
  - entity: sensor.frank_energie_prices_current_electricity_feed_in_price
    name: Sell
    type: line
    color: green
    yaxis_id: price
    float_precision: 3
    stroke_width: 3
    data_generator: >
      const prices = entity.attributes.prices;

      if (!prices || prices.length === 0) {
        return [{ x: Date.now(), y: 0 }];
      }

      return prices.map((p) => {
        const centeredX = new Date(p.from).getTime() + 30 * 60 * 1000;
        return { x: centeredX, y: p.price };
      });
  - entity: sensor.frank_energie_prices_electricity_price_analysis_today
    name: Solar forecast
    type: line
    yaxis_id: solar
    color: '#2196F3'
    stroke_width: 3
    data_generator: >
      if (!entity.attributes.slots || entity.attributes.slots.length === 0) {
        return [{ x: Date.now(), y: 0 }];
      }

      return entity.attributes.slots.map((p) => {
        const centeredX = new Date(p.from).getTime() + 30 * 60 * 1000;
        return { x: centeredX, y: p.solar_kwh };
      });
apex_config:
  chart:
    height: 220
  xaxis:
    labels:
      datetimeUTC: false
  plotOptions:
    bar:
      columnWidth: 80%
  tooltip:
    x:
      formatter: |
        EVAL:function(val) {
          const realStart = new Date(val - 30 * 60 * 1000);
          return realStart.toLocaleString('nl-NL', { day: 'numeric', month: 'short', year: 'numeric', hour: '2-digit', minute: '2-digit' });
        }
grid_options:
  columns: 24
rows: autoApexCharts. The same for tomorrow. Empty until tomorrow's prices are published.
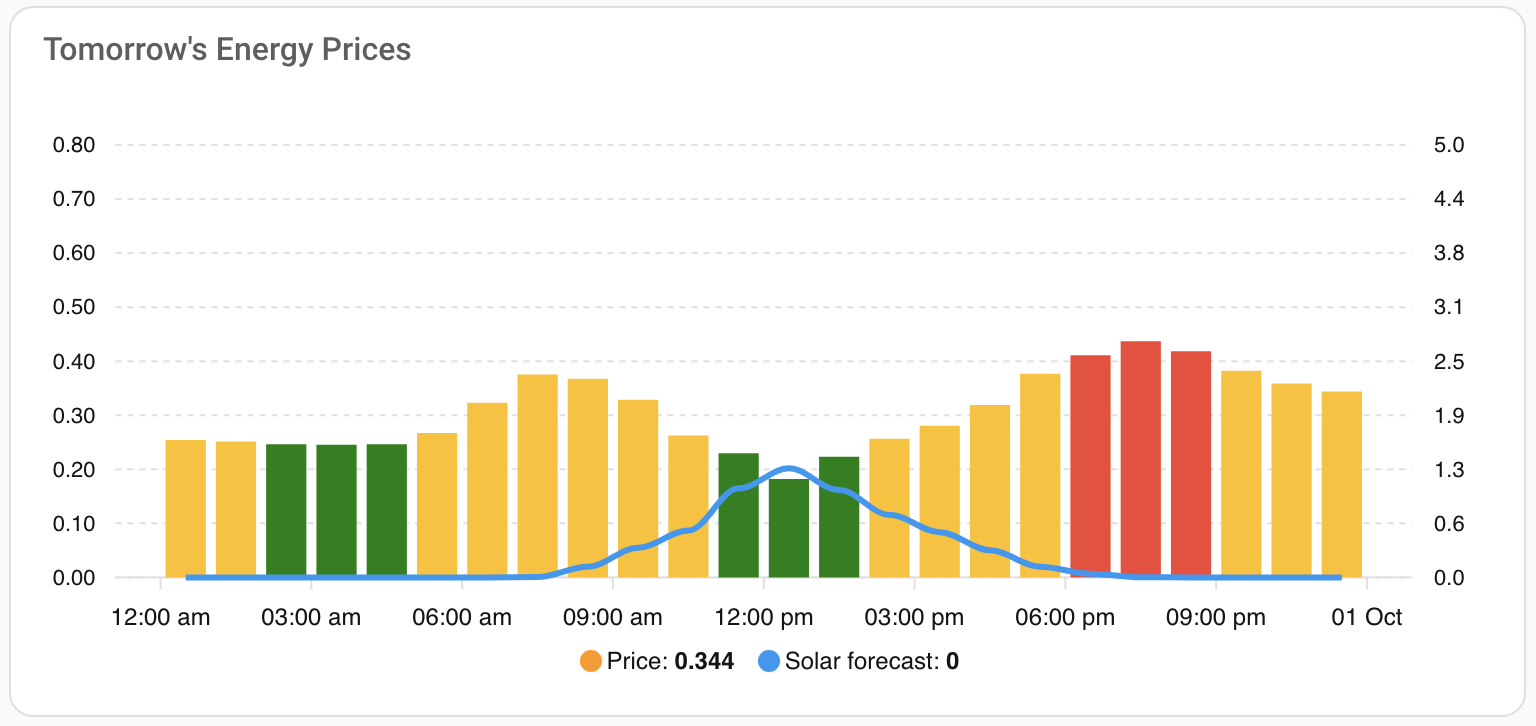
Show YAML
type: custom:apexcharts-card
header:
  show: true
  title: Tomorrow's Energy Prices
graph_span: 24h
span:
  start: day
  offset: +1d
yaxis:
  - id: price
    decimals: 2
    min: 0
    max: 0.8
    apex_config:
      tickAmount: 8
  - id: solar
    opposite: true
    decimals: 1
    min: 0
    max: 5
series:
  - entity: sensor.frank_energie_prices_electricity_price_analysis_tomorrow
    name: Price
    type: column
    yaxis_id: price
    float_precision: 3
    data_generator: >
      if (!entity.attributes.slots || entity.attributes.slots.length === 0) {
        return [{ x: Date.now(), y: 0 }];
      }

      const colorMap = { cheap_solar: 'yellowgreen', cheap: 'green', normal:
      '#FFC107', expensive: '#F44336' };

      return entity.attributes.slots.map((p) => {
        const centeredX = new Date(p.from).getTime() + 30 * 60 * 1000;
        return { x: centeredX, y: p.price, fillColor: colorMap[p.level] };
      });
  - entity: sensor.frank_energie_prices_electricity_price_analysis_tomorrow
    name: Solar forecast
    type: line
    yaxis_id: solar
    color: '#2196F3'
    stroke_width: 3
    data_generator: >
      if (!entity.attributes.slots || entity.attributes.slots.length === 0) {
        return [{ x: Date.now(), y: 0 }];
      }

      return entity.attributes.slots.map((p) => {
        const centeredX = new Date(p.from).getTime() + 30 * 60 * 1000;
        return { x: centeredX, y: p.solar_kwh };
      });
apex_config:
  chart:
    height: 220
  xaxis:
    labels:
      datetimeUTC: false
  plotOptions:
    bar:
      columnWidth: 80%
  tooltip:
    x:
      formatter: |
        EVAL:function(val) {
          const realStart = new Date(val - 30 * 60 * 1000);
          return realStart.toLocaleString('nl-NL', { day: 'numeric', month: 'short', year: 'numeric', hour: '2-digit', minute: '2-digit' });
        }
grid_options:
  columns: 24
rows: autoApexCharts. One 48-hour chart with the levels of both days. The card reads the tomorrow sensor through hass.states.
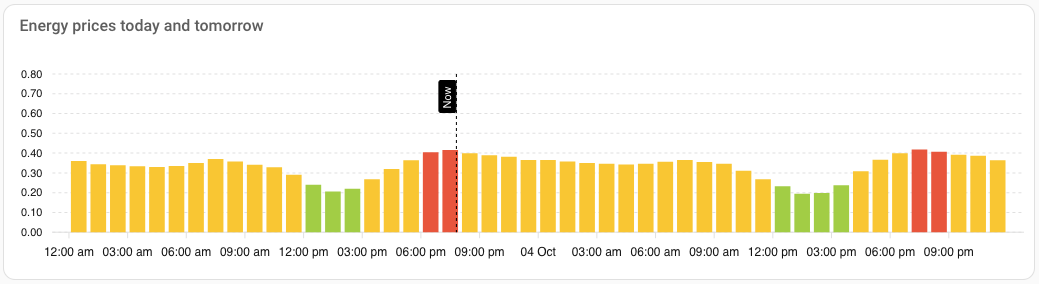
Show YAML
type: custom:apexcharts-card
header:
  show: true
  title: Energy prices today and tomorrow
graph_span: 48h
span:
  start: day
now:
  show: true
  color: black
  label: Now
yaxis:
  - id: price
    decimals: 2
    min: 0
    max: 0.8
    apex_config:
      tickAmount: 8
series:
  - entity: sensor.frank_energie_prices_electricity_price_analysis_today
    name: Price
    type: column
    yaxis_id: price
    float_precision: 3
    data_generator: >
      const tomorrow =
      hass.states['sensor.frank_energie_prices_electricity_price_analysis_tomorrow'];

      const slots = (entity.attributes.slots || []).concat((tomorrow &&
      tomorrow.attributes.slots) || []);

      if (slots.length === 0) {
        return [{ x: Date.now(), y: 0 }];
      }

      const colorMap = { cheap_solar: 'yellowgreen', cheap: 'green', normal:
      '#FFC107', expensive: '#F44336' };

      return slots.map((p) => {
        const centeredX = new Date(p.from).getTime() + 30 * 60 * 1000;
        return { x: centeredX, y: p.price, fillColor: colorMap[p.level] };
      });
apex_config:
  chart:
    height: 220
  xaxis:
    labels:
      datetimeUTC: false
  plotOptions:
    bar:
      columnWidth: 80%
  tooltip:
    x:
      formatter: |
        EVAL:function(val) {
          const realStart = new Date(val - 30 * 60 * 1000);
          return realStart.toLocaleString('nl-NL', { day: 'numeric', month: 'short', hour: '2-digit', minute: '2-digit' });
}Built-in. The level now, the two on/off signals and when the next cheapest period starts and ends.
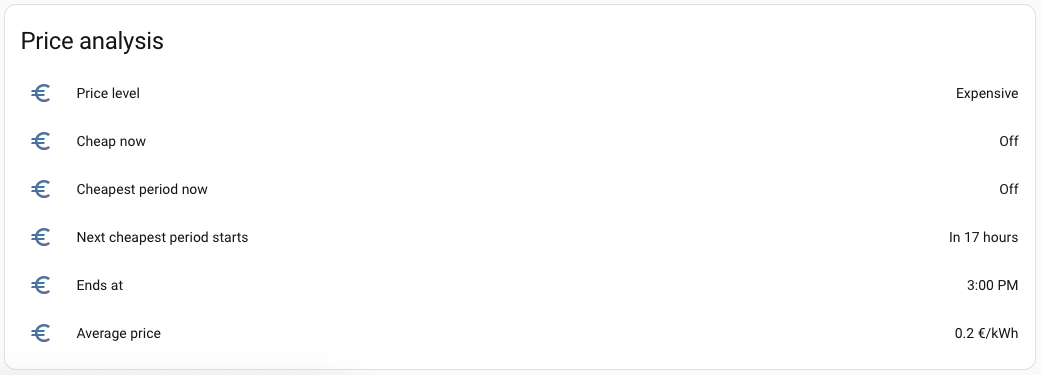
type: entities
title: Price analysis
entities:
  - entity: sensor.frank_energie_prices_electricity_price_level
    name: Price level
  - entity: binary_sensor.frank_energie_prices_cheap_electricity_price_now
    name: Cheap now
  - entity: binary_sensor.frank_energie_prices_cheapest_electricity_period_now
    name: Cheapest period now
  - entity: sensor.frank_energie_prices_next_cheapest_electricity_period
    name: Next cheapest period starts
    format: relative
  - type: attribute
    entity: sensor.frank_energie_prices_next_cheapest_electricity_period
    attribute: end
    name: Ends at
    format: time
  - type: attribute
    entity: sensor.frank_energie_prices_next_cheapest_electricity_period
    attribute: average_price
    name: Average price
suffix: €/kWhThese cards need a login 🔑.
- Cards with statistics need the Energy dashboard statistics group. Replace
YOUR_SITEin the statistic IDs with your own; find them under Developer tools → Statistics by searching forfrank_energie:. You can also build these cards in the visual editor and pick the statistics from the list. - Frank Energie's data arrives a day later, so the newest column is yesterday.
ApexCharts. Needs: Daily usage and costs. Usage and feed-in per hour as columns, costs as a line.
Show YAML
type: custom:apexcharts-card
header:
  show: true
  title: Yesterday per hour
  show_states: true
graph_span: 24h
span:
  start: day
  offset: -1d
yaxis:
  - id: energy
    decimals: 1
    min: 0
  - id: costs
    opposite: true
    decimals: 2
series:
  - entity: sensor.frank_energie_costs_electricity_usage_yesterday
    name: Usage
    type: column
    yaxis_id: energy
    color: '#2196F3'
    float_precision: 2
    data_generator: >
      const hours = entity.attributes.hours;

      if (!hours || hours.length === 0) {
        return [[Date.now(), 0]];
      }

      return hours.map((h) => {
        return [new Date(h.from).getTime() + 30 * 60 * 1000, h.usage];
      });
  - entity: sensor.frank_energie_costs_feed_in_yesterday
    name: Feed-in
    type: column
    yaxis_id: energy
    color: '#FF9800'
    float_precision: 2
    data_generator: >
      const hours = entity.attributes.hours;

      if (!hours || hours.length === 0) {
        return [[Date.now(), 0]];
      }

      return hours.map((h) => {
        return [new Date(h.from).getTime() + 30 * 60 * 1000, h.usage];
      });
  - entity: sensor.frank_energie_costs_electricity_costs_yesterday
    name: Costs
    type: line
    yaxis_id: costs
    color: '#F44336'
    stroke_width: 3
    float_precision: 2
    data_generator: >
      const hours = entity.attributes.hours;

      if (!hours || hours.length === 0) {
        return [[Date.now(), 0]];
      }

      return hours.map((h) => {
        return [new Date(h.from).getTime() + 30 * 60 * 1000, h.costs];
      });
apex_config:
  chart:
    height: 220
  xaxis:
    labels:
      datetimeUTC: false
  plotOptions:
    bar:
      columnWidth: 80%
No feed-in? Remove the Feed-in series. For gas, use sensor.frank_energie_costs_gas_usage_yesterday and sensor.frank_energie_costs_gas_costs_yesterday in the same way.
Built-in, statistics. Electricity costs, gas costs and feed-in revenue per day over the last 30 days.
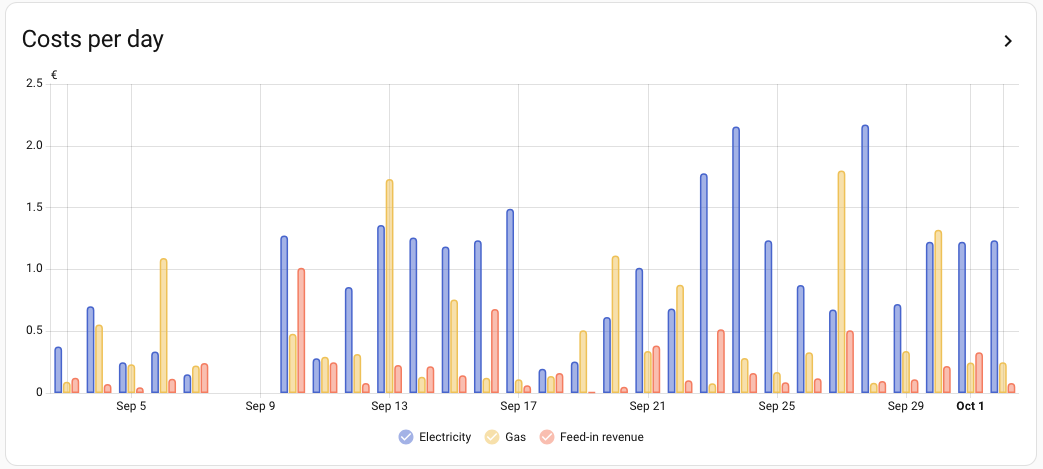
type: statistics-graph
title: Costs per day
entities:
  - entity: frank_energie:electricity_costs_YOUR_SITE
    name: Electricity
  - entity: frank_energie:gas_costs_YOUR_SITE
    name: Gas
  - entity: frank_energie:feed_in_revenue_YOUR_SITE
    name: Feed-in revenue
period: day
days_to_show: 30
chart_type: bar
stat_types:
- changeBuilt-in, statistics. Electricity taken from the grid and fed back, per day.
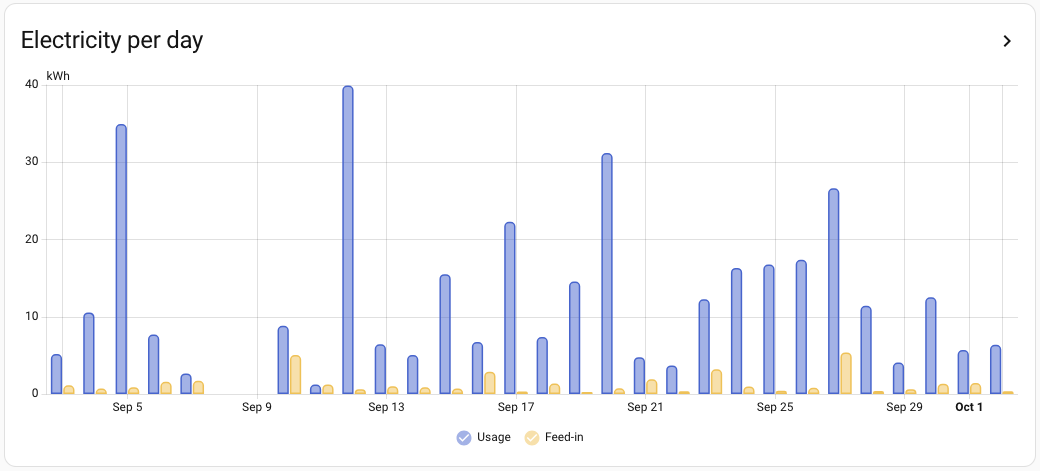
type: statistics-graph
title: Electricity per day
entities:
  - entity: frank_energie:electricity_usage_YOUR_SITE
    name: Usage
  - entity: frank_energie:feed_in_YOUR_SITE
    name: Feed-in
period: day
days_to_show: 30
chart_type: bar
stat_types:
  - change
Gas per day (a separate card, because the unit differs):
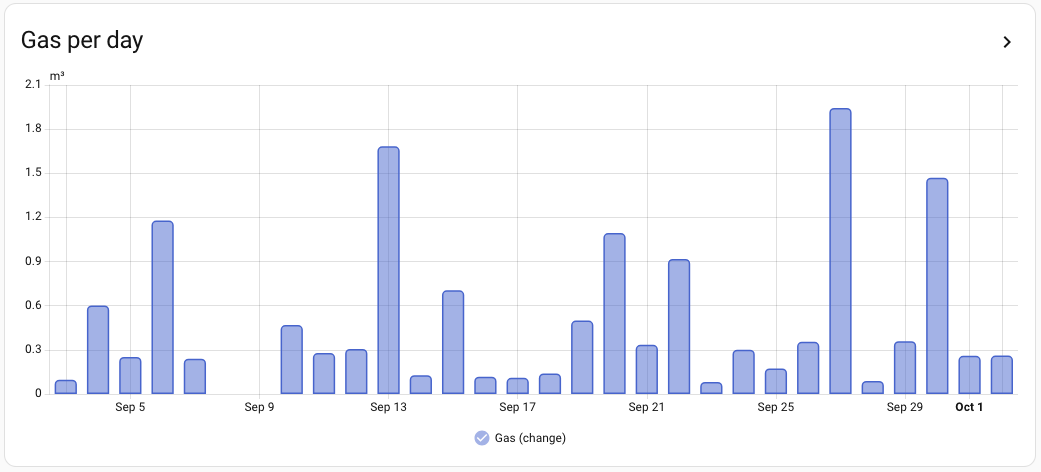
type: statistics-graph
title: Gas per day
entities:
  - entity: frank_energie:gas_usage_YOUR_SITE
    name: Gas
period: day
days_to_show: 30
chart_type: bar
stat_types:
- changeBuilt-in, statistics. The last 12 months. The history starts 30 days before you turned the statistics on and grows from there.
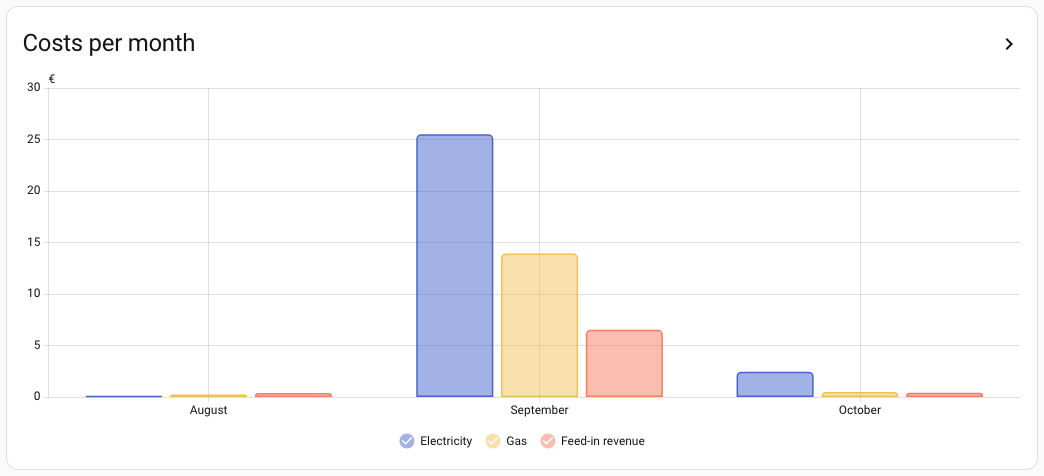
type: statistics-graph
title: Costs per month
entities:
  - entity: frank_energie:electricity_costs_YOUR_SITE
    name: Electricity
  - entity: frank_energie:gas_costs_YOUR_SITE
    name: Gas
  - entity: frank_energie:feed_in_revenue_YOUR_SITE
    name: Feed-in revenue
period: month
days_to_show: 365
chart_type: bar
stat_types:
- changeBuilt-in, statistics.
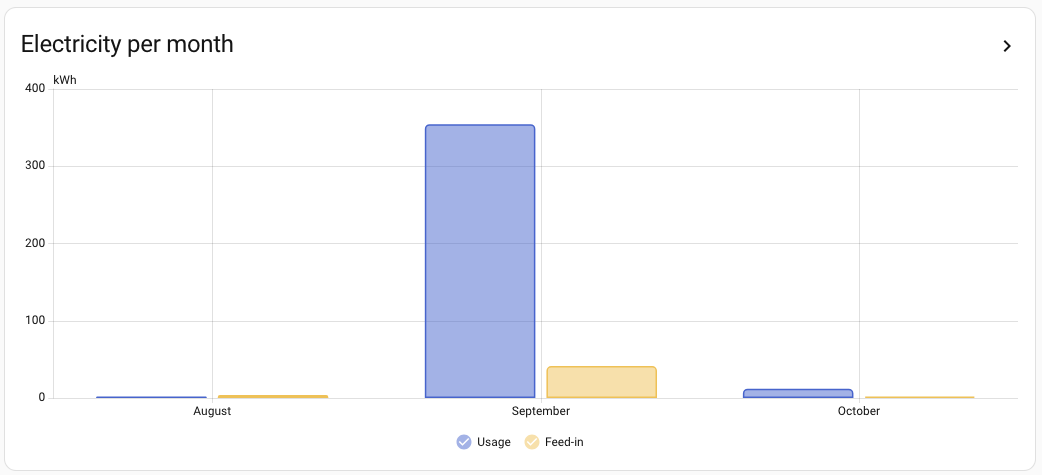
type: statistics-graph
title: Electricity per month
entities:
  - entity: frank_energie:electricity_usage_YOUR_SITE
    name: Usage
  - entity: frank_energie:feed_in_YOUR_SITE
    name: Feed-in
period: month
days_to_show: 365
chart_type: bar
stat_types:
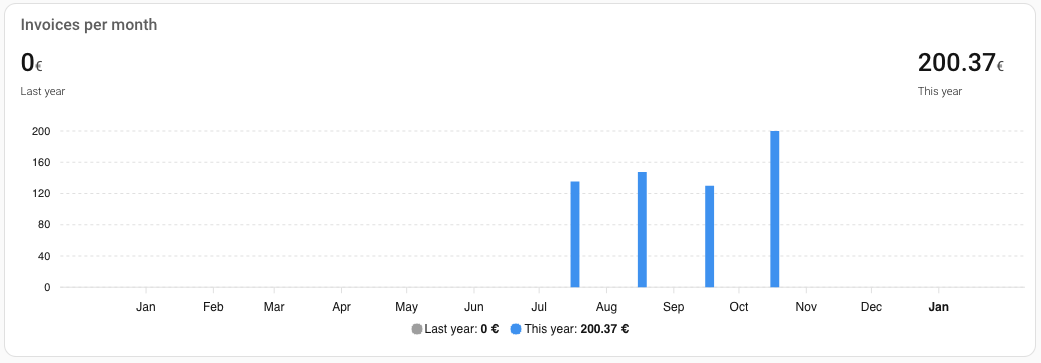
- changeApexCharts. Needs: Costs and invoices. Every invoice of this year next to the same month of last year, from the invoices attribute. This works right away, also for the months before you installed the integration.
Show YAML
type: custom:apexcharts-card
header:
  show: true
  title: Invoices per month
  show_states: true
graph_span: 1y
span:
  start: year
yaxis:
  - id: amount
    decimals: 0
    min: 0
series:
  - entity: sensor.frank_energie_costs_total_last_year
    name: Last year
    type: column
    yaxis_id: amount
    color: '#9E9E9E'
    float_precision: 2
    unit: €
    data_generator: >
      const invoices = entity.attributes.invoices;

      if (!invoices || invoices.length === 0) {
        return [[Date.now(), 0]];
      }

      return invoices.map((i) => {
        const d = new Date(i.start_date + 'T12:00:00');
        d.setFullYear(d.getFullYear() + 1);
        d.setDate(15);
        return [d.getTime(), i.total_amount];
      });
  - entity: sensor.frank_energie_costs_total_this_year
    name: This year
    type: column
    yaxis_id: amount
    color: '#2196F3'
    float_precision: 2
    unit: €
    data_generator: >
      const invoices = entity.attributes.invoices;

      if (!invoices || invoices.length === 0) {
        return [[Date.now(), 0]];
      }

      return invoices.map((i) => {
        const d = new Date(i.start_date + 'T12:00:00');
        d.setDate(15);
        return [d.getTime(), i.total_amount];
      });
apex_config:
  chart:
    height: 240
  xaxis:
    labels:
      datetimeUTC: false
      format: MMM
  tooltip:
    x:
      format: MMMM
The header shows the totals of both years. Last year's invoices are moved one year forward so the same months stand next to each other.
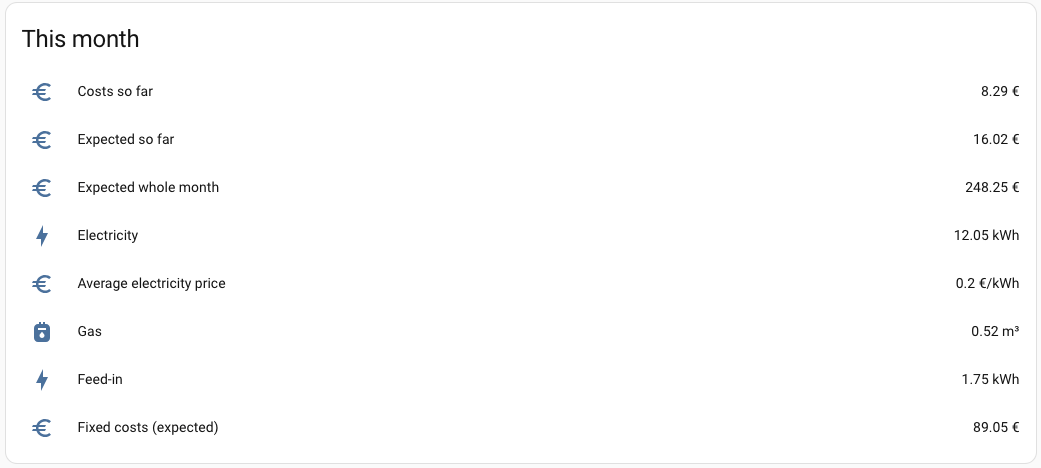
Built-in. Needs: Costs and invoices, and Monthly usage and costs for the usage rows.
type: entities
title: This month
entities:
  - entity: sensor.frank_energie_costs_actual_monthly_cost
    name: Costs so far
  - entity: sensor.frank_energie_costs_expected_monthly_cost_until_now
    name: Expected so far
  - entity: sensor.frank_energie_costs_expected_cost_this_month
    name: Expected whole month
  - entity: sensor.frank_energie_costs_electricity_usage_this_month
    name: Electricity
  - type: attribute
    entity: sensor.frank_energie_costs_electricity_costs_this_month
    attribute: average_price
    name: Average electricity price
    suffix: €/kWh
  - entity: sensor.frank_energie_costs_gas_usage_this_month
    name: Gas
  - entity: sensor.frank_energie_costs_feed_in_this_month
    name: Feed-in
  - entity: sensor.frank_energie_costs_fixed_costs_this_month_expected
    name: Fixed costs (expected)
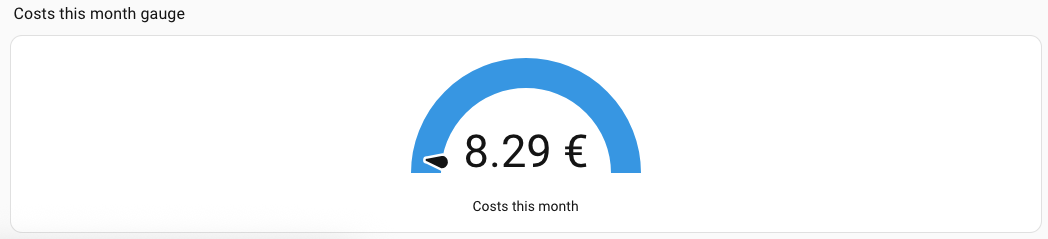
A gauge that shows whether you are above or below the expected costs:
type: gauge
entity: sensor.frank_energie_costs_actual_monthly_cost
name: Costs this month
min: 0
max: 200
needle: true
Set max to roughly your expected costs for a whole month.
Mushroom. Needs: Costs and invoices. Three tiles like the overview in the Frank Energie app: the expected costs up to the last meter reading, the real costs, and the difference, with percentages that show how far the real costs are from the expected costs.

type: grid
columns: 3
square: false
cards:
  - type: custom:mushroom-template-card
    primary: Expected
    secondary: '€ {{ "%.2f" | format(states("sensor.frank_energie_costs_expected_monthly_cost_until_now") | float(0)) | replace(".", ",") }}'
    icon: mdi:crystal-ball
    color: orange
    tap_action:
      action: none
  - type: custom:mushroom-template-card
    primary: Real costs
    secondary: |-
      {% set e = states("sensor.frank_energie_costs_expected_monthly_cost_until_now") | float(0) %}
      {% set a = states("sensor.frank_energie_costs_actual_monthly_cost") | float(0) %}
      € {{ "%.2f" | format(a) | replace(".", ",") }}{% if e > 0 %} ({{ (a / e * 100) | round(0) | int }}%){% endif %}
    multiline_secondary: true
    icon: mdi:cash
    color: red
    tap_action:
      action: none
  - type: custom:mushroom-template-card
    primary: Difference
    secondary: |-
      {% set e = states("sensor.frank_energie_costs_expected_monthly_cost_until_now") | float(0) %}
      {% set d = states("sensor.frank_energie_costs_monthly_cost_difference_until_now") | float(0) %}
      € {{ "%+.2f" | format(d) | replace(".", ",") }}{% if e > 0 %} ({{ "%+d" | format((d / e * 100) | round(0) | int) }}%){% endif %}
    multiline_secondary: true
    icon: mdi:swap-vertical
    color: blue
    tap_action:
      action: none
The percentages compare with the expected costs: Real costs shows the real costs as a share of the expected costs, Difference shows how far they are above (+) or below (-) them. Difference is the Monthly cost difference until now sensor (real minus expected, like Verschil in the app, version 1.8.3 or newer): a negative amount means you are below the expected costs. The percentages are left out while there are no expected costs yet. The amounts use a decimal comma; remove | replace(".", ",") for a decimal point.
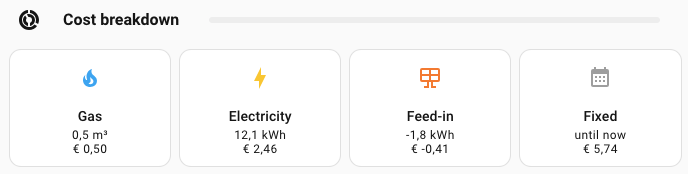
Mushroom. Needs: Monthly usage and costs. Usage and costs of gas, electricity and feed-in this month, plus the fixed costs so far.
Show YAML
type: grid
columns: 4
square: false
cards:
  - type: custom:mushroom-template-card
    primary: Gas
    secondary: |-
      {{ "%.1f" | format((states("sensor.frank_energie_costs_gas_usage_this_month") | float(0))) | replace(".", ",") }} m³
      € {{ "%.2f" | format((states("sensor.frank_energie_costs_gas_costs_this_month") | float(0))) | replace(".", ",") }}
    multiline_secondary: true
    icon: mdi:fire
    color: light-blue
    vertical: true
    tap_action:
      action: none
  - type: custom:mushroom-template-card
    primary: Electricity
    secondary: |-
      {{ "%.1f" | format((states("sensor.frank_energie_costs_electricity_usage_this_month") | float(0))) | replace(".", ",") }} kWh
      € {{ "%.2f" | format((states("sensor.frank_energie_costs_electricity_costs_this_month") | float(0))) | replace(".", ",") }}
    multiline_secondary: true
    icon: mdi:lightning-bolt
    color: amber
    vertical: true
    tap_action:
      action: none
  - type: custom:mushroom-template-card
    primary: Feed-in
    secondary: |-
      {{ "%.1f" | format(-(states("sensor.frank_energie_costs_feed_in_this_month") | float(0))) | replace(".", ",") }} kWh
      € {{ "%.2f" | format(-(states("sensor.frank_energie_costs_feed_in_revenue_this_month") | float(0))) | replace(".", ",") }}
    multiline_secondary: true
    icon: mdi:solar-panel
    color: deep-orange
    vertical: true
    tap_action:
      action: none
  - type: custom:mushroom-template-card
    primary: Fixed
    secondary: |-
      until now
      € {{ "%.2f" | format(states("sensor.frank_energie_costs_fixed_costs_this_month_until_now") | float(0)) | replace(".", ",") }}
    multiline_secondary: true
    icon: mdi:calendar-month
    color: grey
    vertical: true
    tap_action:
      action: none
The Fixed tile shows the Fixed costs this month until now sensor (version 1.8.3 or newer): the real costs minus gas and electricity, plus the feed-in revenue. No gas or no feed-in? Remove that tile and lower columns.
ApexCharts, Mushroom, statistics. Costs or usage per day as stacked columns, for the current month or an earlier one, like the Inzicht page of the Frank Energie app. Two rows of buttons choose the month and switch between costs, gas and electricity.
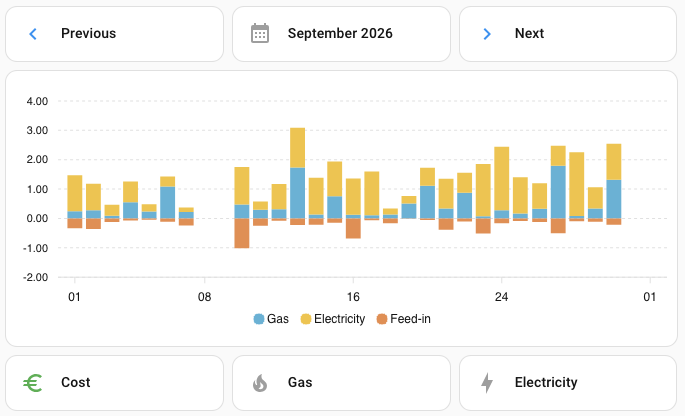
The buttons need two helpers. Create them under Settings → Devices & services → Helpers:
| Helper | Type | Settings |
|---|---|---|
input_number.frank_costs_month_offset |
Number | Minimum -24, maximum 0, step 1. Set its value to 0 after creating it |
input_select.frank_costs_chart |
Dropdown | Options Costs, Gas, Electricity
|
0 is the current month, -1 the previous one. Then add the cards below in this order. They are separate cards, so the charts can be shown and hidden.
1. Month buttons. The middle button shows the chosen month and jumps back to the current month.
Show YAML
type: grid
columns: 3
square: false
cards:
  - type: custom:mushroom-template-card
    primary: Previous
    icon: mdi:chevron-left
    color: blue
    tap_action:
      action: perform-action
      perform_action: input_number.decrement
      target:
        entity_id: input_number.frank_costs_month_offset
  - type: custom:mushroom-template-card
    primary: >-
      {% set off = states("input_number.frank_costs_month_offset") | int(0) %}{% set m = now().month - 1 + off %}{{ now().replace(day=1).replace(year=now().year + m // 12, month=m % 12 + 1).strftime("%B %Y") }}
    icon: mdi:calendar-month
    color: grey
    tap_action:
      action: perform-action
      perform_action: input_number.set_value
      target:
        entity_id: input_number.frank_costs_month_offset
      data:
        value: 0
  - type: custom:mushroom-template-card
    primary: Next
    icon: mdi:chevron-right
    color: >-
      {% if states("input_number.frank_costs_month_offset") | int(0) < 0 %}blue{% else %}grey{% endif %}
    tap_action:
      action: perform-action
      perform_action: input_number.increment
      target:
        entity_id: input_number.frank_costs_month_offset
2. The three charts. Only the chart that matches the chosen option is visible. Replace YOUR_SITE in every const id line.
Show YAML: costs
type: custom:apexcharts-card
header:
  show: false
graph_span: 31d
span:
  start: month
stacked: true
update_delay: 200ms
series:
  - entity: input_number.frank_costs_month_offset
    name: Gas
    type: column
    color: '#5BB4D6'
    unit: €
    float_precision: 2
    show:
      legend_value: false
    data_generator: |
      const id = "frank_energie:gas_costs_YOUR_SITE";
      const sign = 1;
      const off = parseInt(entity.state) || 0;
      const y = start.getFullYear();
      const m = start.getMonth();
      const from = new Date(y, m + off, 1);
      const to = new Date(y, m + off + 1, 1);
      const r = await hass.callWS({type: "recorder/statistics_during_period", start_time: from.toISOString(), end_time: to.toISOString(), statistic_ids: [id], period: "day", types: ["change"]});
      const byDay = {};
      (r[id] || []).forEach((s) => { byDay[new Date(s.start).getDate()] = sign * s.change; });
      const days = new Date(y, m + off + 1, 0).getDate();
      const out = [];
      for (let k = 1; k <= days; k++) { out.push([new Date(y, m, k).getTime(), byDay[k] || 0]); }
      return out;
  - entity: input_number.frank_costs_month_offset
    name: Electricity
    type: column
    color: '#F2C043'
    unit: €
    float_precision: 2
    show:
      legend_value: false
    data_generator: |
      const id = "frank_energie:electricity_costs_YOUR_SITE";
      const sign = 1;
      const off = parseInt(entity.state) || 0;
      const y = start.getFullYear();
      const m = start.getMonth();
      const from = new Date(y, m + off, 1);
      const to = new Date(y, m + off + 1, 1);
      const r = await hass.callWS({type: "recorder/statistics_during_period", start_time: from.toISOString(), end_time: to.toISOString(), statistic_ids: [id], period: "day", types: ["change"]});
      const byDay = {};
      (r[id] || []).forEach((s) => { byDay[new Date(s.start).getDate()] = sign * s.change; });
      const days = new Date(y, m + off + 1, 0).getDate();
      const out = [];
      for (let k = 1; k <= days; k++) { out.push([new Date(y, m, k).getTime(), byDay[k] || 0]); }
      return out;
  - entity: input_number.frank_costs_month_offset
    name: Feed-in
    type: column
    color: '#E8894F'
    unit: €
    float_precision: 2
    show:
      legend_value: false
    data_generator: |
      const id = "frank_energie:feed_in_revenue_YOUR_SITE";
      const sign = -1;
      const off = parseInt(entity.state) || 0;
      const y = start.getFullYear();
      const m = start.getMonth();
      const from = new Date(y, m + off, 1);
      const to = new Date(y, m + off + 1, 1);
      const r = await hass.callWS({type: "recorder/statistics_during_period", start_time: from.toISOString(), end_time: to.toISOString(), statistic_ids: [id], period: "day", types: ["change"]});
      const byDay = {};
      (r[id] || []).forEach((s) => { byDay[new Date(s.start).getDate()] = sign * s.change; });
      const days = new Date(y, m + off + 1, 0).getDate();
      const out = [];
      for (let k = 1; k <= days; k++) { out.push([new Date(y, m, k).getTime(), byDay[k] || 0]); }
      return out;
apex_config:
  chart:
    height: 260
    stacked: true
  xaxis:
    labels:
      datetimeUTC: false
      format: dd
  yaxis:
    decimalsInFloat: 2
  plotOptions:
    bar:
      columnWidth: 80%
  tooltip:
    x:
      formatter: |
        EVAL:function(val) { return "Day " + new Date(val).getDate(); }
visibility:
  - condition: state
    entity: input_select.frank_costs_chart
    state: Costs
Show YAML: gas
type: custom:apexcharts-card
header:
  show: false
graph_span: 31d
span:
  start: month
stacked: true
update_delay: 200ms
series:
  - entity: input_number.frank_costs_month_offset
    name: Gas
    type: column
    color: '#5BB4D6'
    unit: m³
    float_precision: 2
    show:
      legend_value: false
    data_generator: |
      const id = "frank_energie:gas_usage_YOUR_SITE";
      const sign = 1;
      const off = parseInt(entity.state) || 0;
      const y = start.getFullYear();
      const m = start.getMonth();
      const from = new Date(y, m + off, 1);
      const to = new Date(y, m + off + 1, 1);
      const r = await hass.callWS({type: "recorder/statistics_during_period", start_time: from.toISOString(), end_time: to.toISOString(), statistic_ids: [id], period: "day", types: ["change"]});
      const byDay = {};
      (r[id] || []).forEach((s) => { byDay[new Date(s.start).getDate()] = sign * s.change; });
      const days = new Date(y, m + off + 1, 0).getDate();
      const out = [];
      for (let k = 1; k <= days; k++) { out.push([new Date(y, m, k).getTime(), byDay[k] || 0]); }
      return out;
apex_config:
  chart:
    height: 260
    stacked: true
  xaxis:
    labels:
      datetimeUTC: false
      format: dd
  yaxis:
    decimalsInFloat: 2
  plotOptions:
    bar:
      columnWidth: 80%
  tooltip:
    x:
      formatter: |
        EVAL:function(val) { return "Day " + new Date(val).getDate(); }
visibility:
  - condition: state
    entity: input_select.frank_costs_chart
    state: Gas
Show YAML: electricity and feed-in
type: custom:apexcharts-card
header:
  show: false
graph_span: 31d
span:
  start: month
stacked: true
update_delay: 200ms
series:
  - entity: input_number.frank_costs_month_offset
    name: Electricity
    type: column
    color: '#F2C043'
    unit: kWh
    float_precision: 2
    show:
      legend_value: false
    data_generator: |
      const id = "frank_energie:electricity_usage_YOUR_SITE";
      const sign = 1;
      const off = parseInt(entity.state) || 0;
      const y = start.getFullYear();
      const m = start.getMonth();
      const from = new Date(y, m + off, 1);
      const to = new Date(y, m + off + 1, 1);
      const r = await hass.callWS({type: "recorder/statistics_during_period", start_time: from.toISOString(), end_time: to.toISOString(), statistic_ids: [id], period: "day", types: ["change"]});
      const byDay = {};
      (r[id] || []).forEach((s) => { byDay[new Date(s.start).getDate()] = sign * s.change; });
      const days = new Date(y, m + off + 1, 0).getDate();
      const out = [];
      for (let k = 1; k <= days; k++) { out.push([new Date(y, m, k).getTime(), byDay[k] || 0]); }
      return out;
  - entity: input_number.frank_costs_month_offset
    name: Feed-in
    type: column
    color: '#E8894F'
    unit: kWh
    float_precision: 2
    show:
      legend_value: false
    data_generator: |
      const id = "frank_energie:feed_in_YOUR_SITE";
      const sign = -1;
      const off = parseInt(entity.state) || 0;
      const y = start.getFullYear();
      const m = start.getMonth();
      const from = new Date(y, m + off, 1);
      const to = new Date(y, m + off + 1, 1);
      const r = await hass.callWS({type: "recorder/statistics_during_period", start_time: from.toISOString(), end_time: to.toISOString(), statistic_ids: [id], period: "day", types: ["change"]});
      const byDay = {};
      (r[id] || []).forEach((s) => { byDay[new Date(s.start).getDate()] = sign * s.change; });
      const days = new Date(y, m + off + 1, 0).getDate();
      const out = [];
      for (let k = 1; k <= days; k++) { out.push([new Date(y, m, k).getTime(), byDay[k] || 0]); }
      return out;
apex_config:
  chart:
    height: 260
    stacked: true
  xaxis:
    labels:
      datetimeUTC: false
      format: dd
  yaxis:
    decimalsInFloat: 2
  plotOptions:
    bar:
      columnWidth: 80%
  tooltip:
    x:
      formatter: |
        EVAL:function(val) { return "Day " + new Date(val).getDate(); }
visibility:
  - condition: state
    entity: input_select.frank_costs_chart
    state: Electricity
3. Chart buttons. The active one is green.
Show YAML
type: grid
columns: 3
square: false
cards:
  - type: custom:mushroom-template-card
    primary: Costs
    icon: mdi:currency-eur
    color: >-
      {% if is_state("input_select.frank_costs_chart", "Costs") %}green{% else %}grey{% endif %}
    tap_action:
      action: perform-action
      perform_action: input_select.select_option
      target:
        entity_id: input_select.frank_costs_chart
      data:
        option: Costs
  - type: custom:mushroom-template-card
    primary: Gas
    icon: mdi:fire
    color: >-
      {% if is_state("input_select.frank_costs_chart", "Gas") %}green{% else %}grey{% endif %}
    tap_action:
      action: perform-action
      perform_action: input_select.select_option
      target:
        entity_id: input_select.frank_costs_chart
      data:
        option: Gas
  - type: custom:mushroom-template-card
    primary: Electricity
    icon: mdi:lightning-bolt
    color: >-
      {% if is_state("input_select.frank_costs_chart", "Electricity") %}green{% else %}grey{% endif %}
    tap_action:
      action: perform-action
      perform_action: input_select.select_option
      target:
        entity_id: input_select.frank_costs_chart
      data:
        option: Electricity
Good to know:
- The x-axis shows day numbers. An earlier month is drawn on the days of the current month, so when the current month is shorter, the last days of the earlier month are not shown.
- The history starts 30 days before you turned the statistics on; earlier months stay empty.
- The option names appear in the dropdown helper, in the
visibilityof each chart and in the buttons. Keep them the same when you rename them. - The charts load their data when the page opens and when you press a button. Reload the page to see new days.
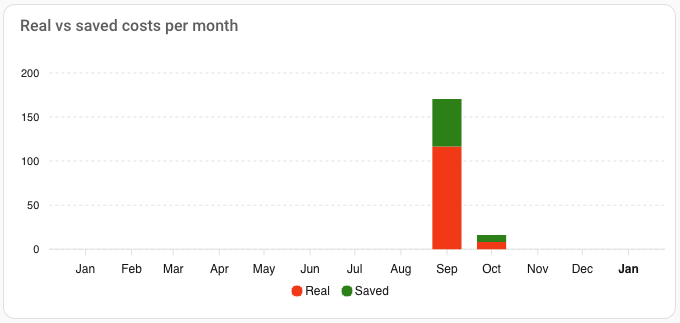
ApexCharts. Needs: Costs and invoices. One stacked column per month of this year: the real costs, and on top what you saved compared to the expected costs. The whole column is the expected amount; when a month costs more than expected, the saved part goes below zero.
Show YAML
type: custom:apexcharts-card
header:
  show: true
  title: Real vs saved costs per month
graph_span: 1y
span:
  start: year
stacked: true
update_interval: 1h
series:
  - entity: sensor.frank_energie_costs_actual_monthly_cost
    name: Real
    type: column
    color: red
    unit: €
    float_precision: 2
    show:
      legend_value: false
    data_generator: |
      const a = "sensor.frank_energie_costs_actual_monthly_cost";
      const e = "sensor.frank_energie_costs_expected_monthly_cost_until_now";
      const y = start.getFullYear();
      const r = await hass.callWS({type: "recorder/statistics_during_period", start_time: new Date(y, 0, 1).toISOString(), end_time: new Date(y + 1, 0, 1).toISOString(), statistic_ids: [a, e], period: "month", types: ["state"]});
      const act = {};
      const exp = {};
      (r[a] || []).forEach((s) => { act[new Date(s.start).getMonth()] = s.state; });
      (r[e] || []).forEach((s) => { exp[new Date(s.start).getMonth()] = s.state; });
      const out = [];
      for (let m = 0; m < 12; m++) { const real = act[m] || 0; const saved = (exp[m] || 0) - real; out.push([new Date(y, m, 1).getTime(), real]); }
      return out;
  - entity: sensor.frank_energie_costs_actual_monthly_cost
    name: Saved
    type: column
    color: green
    unit: €
    float_precision: 2
    show:
      legend_value: false
    data_generator: |
      const a = "sensor.frank_energie_costs_actual_monthly_cost";
      const e = "sensor.frank_energie_costs_expected_monthly_cost_until_now";
      const y = start.getFullYear();
      const r = await hass.callWS({type: "recorder/statistics_during_period", start_time: new Date(y, 0, 1).toISOString(), end_time: new Date(y + 1, 0, 1).toISOString(), statistic_ids: [a, e], period: "month", types: ["state"]});
      const act = {};
      const exp = {};
      (r[a] || []).forEach((s) => { act[new Date(s.start).getMonth()] = s.state; });
      (r[e] || []).forEach((s) => { exp[new Date(s.start).getMonth()] = s.state; });
      const out = [];
      for (let m = 0; m < 12; m++) { const real = act[m] || 0; const saved = (exp[m] || 0) - real; out.push([new Date(y, m, 1).getTime(), saved]); }
      return out;
apex_config:
  chart:
    height: 260
    stacked: true
  xaxis:
    labels:
      datetimeUTC: false
      format: MMM
  yaxis:
    decimalsInFloat: 0
  plotOptions:
    bar:
      columnWidth: 70%
  tooltip:
    x:
      formatter: |
        EVAL:function(val) { return new Date(val).toLocaleString("en-GB", { month: "long", year: "numeric" }); }
The chart reads the history that Home Assistant keeps of the two monthly sensors, so it starts in the month you installed the integration and grows from there. A finished month shows the last value of that month, which can miss its final day because Frank Energie's data arrives a day later. These are total costs including the fixed costs.
The last 12 months instead of this year. The chart above starts empty every January. This variant always shows the current month and the 11 months before it.
Show YAML
type: custom:apexcharts-card
header:
  show: true
  title: Real vs saved costs, last 12 months
graph_span: 1y
span:
  end: month
stacked: true
update_interval: 1h
series:
  - entity: sensor.frank_energie_costs_actual_monthly_cost
    name: Real
    type: column
    color: red
    unit: €
    float_precision: 2
    show:
      legend_value: false
    data_generator: |
      const a = "sensor.frank_energie_costs_actual_monthly_cost";
      const e = "sensor.frank_energie_costs_expected_monthly_cost_until_now";
      const last = new Date(end.getTime() - 1);
      const y = last.getFullYear();
      const m0 = last.getMonth() - 11;
      const r = await hass.callWS({type: "recorder/statistics_during_period", start_time: new Date(y, m0, 1).toISOString(), end_time: new Date(y, m0 + 12, 1).toISOString(), statistic_ids: [a, e], period: "month", types: ["state"]});
      const key = (d) => d.getFullYear() + "-" + d.getMonth();
      const act = {};
      const exp = {};
      (r[a] || []).forEach((s) => { act[key(new Date(s.start))] = s.state; });
      (r[e] || []).forEach((s) => { exp[key(new Date(s.start))] = s.state; });
      const out = [];
      for (let k = 0; k < 12; k++) { const d = new Date(y, m0 + k, 15); const real = act[key(d)] || 0; const saved = (exp[key(d)] || 0) - real; out.push([d.getTime(), real]); }
      return out;
  - entity: sensor.frank_energie_costs_actual_monthly_cost
    name: Saved
    type: column
    color: green
    unit: €
    float_precision: 2
    show:
      legend_value: false
    data_generator: |
      const a = "sensor.frank_energie_costs_actual_monthly_cost";
      const e = "sensor.frank_energie_costs_expected_monthly_cost_until_now";
      const last = new Date(end.getTime() - 1);
      const y = last.getFullYear();
      const m0 = last.getMonth() - 11;
      const r = await hass.callWS({type: "recorder/statistics_during_period", start_time: new Date(y, m0, 1).toISOString(), end_time: new Date(y, m0 + 12, 1).toISOString(), statistic_ids: [a, e], period: "month", types: ["state"]});
      const key = (d) => d.getFullYear() + "-" + d.getMonth();
      const act = {};
      const exp = {};
      (r[a] || []).forEach((s) => { act[key(new Date(s.start))] = s.state; });
      (r[e] || []).forEach((s) => { exp[key(new Date(s.start))] = s.state; });
      const out = [];
      for (let k = 0; k < 12; k++) { const d = new Date(y, m0 + k, 15); const real = act[key(d)] || 0; const saved = (exp[key(d)] || 0) - real; out.push([d.getTime(), saved]); }
      return out;
apex_config:
  chart:
    height: 260
    stacked: true
  xaxis:
    labels:
      datetimeUTC: false
      format: MMM
  yaxis:
    decimalsInFloat: 0
  plotOptions:
    bar:
      columnWidth: 70%
  tooltip:
    x:
      formatter: |
EVAL:function(val) { return new Date(val).toLocaleString("en-GB", { month: "long", year: "numeric" }); }Made a nice chart with this integration? Share it in a GitHub issue and it can be added here.