Management Console
Attention: We have migrated our documentation to our new platform, Ant Media Resources. Please follow this link for the latest and up-to-date documentation.
NOTE: We have updated our documentation. This page is outdated. You can access updated version from the sidebar menu.
Todo
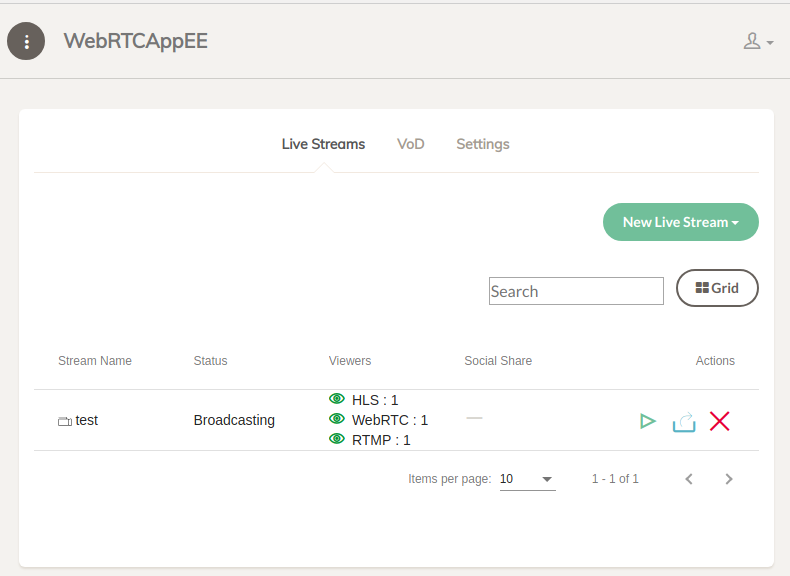
In this column of the Live Stream Table number of subscribers of the stream are presented. This presentation is made separately for each protocol ie. WebRTC, HLS and RTMP as shown in the image below.
Remarks For Cluster Mode:
- In cluster mode if a viewer tries to play the stream from an edge server, edge server connects to the origin server. Then HLS viewer count is also incremented because of the edge server connections.
- The same situation goes for RTMP but not for WebRTC.
WebRTC Client Statistics Window opens when you click the eye icon near the WebRTC Viewer count. Here is an example window for a stream with 10 connected clients.
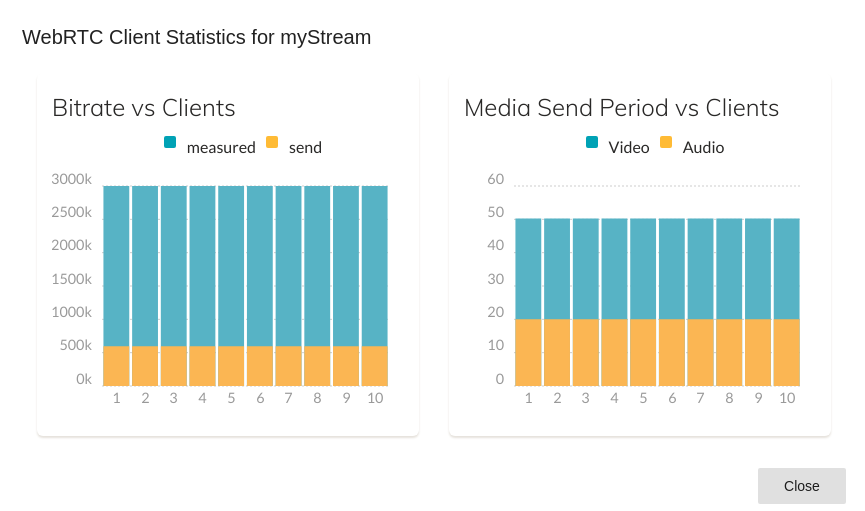 There are two graphics in WebRTC Client Statistics Window.
Bitrate vs Clients:
This graphic shows the measured bitrate and sending bitrate of a stream for each client.
There are two graphics in WebRTC Client Statistics Window.
Bitrate vs Clients:
This graphic shows the measured bitrate and sending bitrate of a stream for each client.
Media Send Period vs Clients: This graphic shows send period of video and audio for each client in ms. The period is expected as 1/fps for video and 10ms for audio.
Cluster page can be opened from the sidebar of the management console. In cluster page, there is a cluster table in which cluster nodes are listed as rows.
In cluster mode, each node registers itself to MongoDB as a cluster node. All registered nodes are listed in the cluster table even if it is off at the moment.
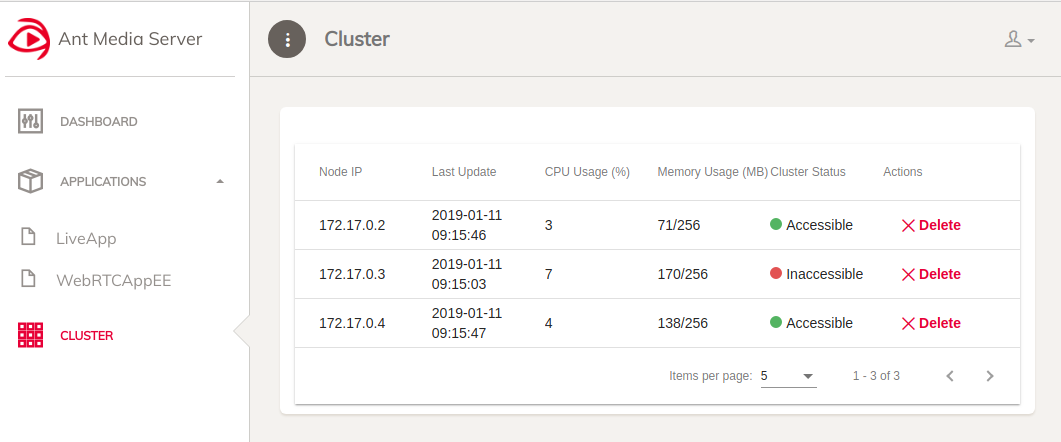
In the image above there are 3 nodes in MongoDB but the node with IP 172.17.0.3 is not in the cluster at the moment. If you don't want to see it in the cluster table anymore, you can delete it by clicking the Delete icon under the Actions column.
Node IP: It shows the IP address of the node.
Last Update: Each node updates its status in MongoDB with a period. This column shows the last update time.
CPU Usage: It shows the CPU usage percentage of the node.
Memory Usage: It shows the heap memory usage/total heap of the node.
Cluster Status: It shows whether the node is in the cluster or not as Accessible or Inaccessible.
Actions: It contains a Delete button to remove the node from MongoDB. It is meaningful for the Inaccessible nodes.