example_statistics - almarklein/visvis GitHub Wiki
#!/usr/bin/env python
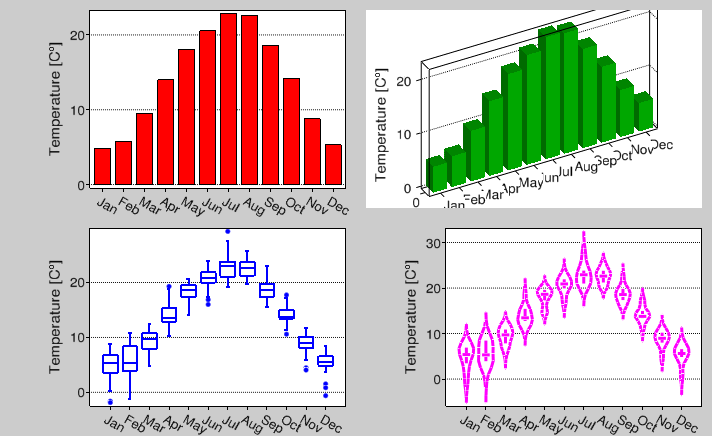
""" This example a coupe of ways to visualize statistic data.
As an example I took the monthly temperature in the region where I live
(Twente, The Netherlands) over the period 1983-2010.
This data was extracted from publicly available data obtained from the
Royal Netherlands Meteorological Institute (KNMI).
"""
import visvis as vv
temp_data = """
1983: 8.00 2.73 9.00 13.02 14.63 21.10 25.03 23.73 17.72 13.34 9.31 5.35
1984: 4.78 4.06 7.38 12.24 14.14 16.86 19.19 22.24 15.99 14.15 10.44 5.81
1985: -1.87 2.28 6.50 12.06 17.67 17.36 21.03 19.73 17.49 13.55 4.06 6.92
1986: 3.55 -1.30 8.03 10.64 18.54 20.93 20.98 20.06 15.50 15.02 10.55 6.59
1987: -1.62 4.52 4.78 15.06 14.49 17.57 20.66 19.66 18.74 14.17 7.96 5.66
1988: 8.05 6.71 7.18 13.00 19.37 18.68 19.80 21.29 17.60 13.82 8.05 7.34
1989: 6.14 7.77 11.48 10.21 19.58 21.05 23.14 22.44 19.95 15.92 8.97 7.34
1990: 6.83 10.82 11.90 13.47 19.58 19.13 21.06 23.80 16.24 16.02 8.08 5.35
1991: 5.21 2.29 12.43 13.33 14.11 15.99 23.49 22.87 19.74 13.52 7.78 5.55
1992: 4.51 7.43 9.67 12.23 20.38 22.42 23.49 22.80 18.91 10.58 10.04 5.55
1993: 7.36 3.32 9.72 15.79 19.33 20.09 20.57 20.01 16.89 12.36 4.46 6.51
1994: 6.84 4.08 10.51 13.15 17.34 20.39 27.51 23.17 17.45 13.45 11.60 7.52
1995: 5.52 9.00 8.98 13.40 18.29 19.56 25.85 25.53 18.28 17.12 8.99 0.83
1996: 1.00 2.14 6.78 15.10 15.34 20.58 21.24 22.86 16.43 14.54 7.61 1.52
1997: 1.17 8.71 11.46 12.30 17.79 21.28 22.90 25.80 19.04 13.29 8.25 6.25
1998: 6.73 9.04 10.72 12.91 19.81 20.46 20.56 21.63 18.72 11.91 5.95 6.01
1999: 7.07 5.34 10.54 14.59 18.72 20.39 24.65 22.39 22.83 14.03 8.96 6.36
2000: 5.74 8.43 9.52 15.49 20.22 21.51 19.71 22.83 19.35 14.59 10.13 6.67
2001: 5.02 7.23 7.25 12.46 19.85 20.12 23.71 23.79 16.70 17.72 9.14 4.59
2002: 6.23 9.74 11.19 14.14 18.40 21.86 22.44 23.75 19.25 12.91 10.19 3.69
2003: 4.35 5.25 12.38 15.38 18.71 23.96 24.06 25.77 20.04 11.27 10.53 6.45
2004: 4.99 7.15 10.00 15.85 17.26 20.93 21.72 24.33 19.94 14.91 8.67 4.96
2005: 6.95 4.32 9.85 15.66 18.07 21.97 22.92 21.07 21.04 17.72 8.86 5.37
2006: 3.31 4.14 7.05 13.51 19.30 22.37 29.29 20.75 23.03 17.04 11.67 8.46
2007: 8.73 8.41 12.24 19.28 18.81 22.45 21.69 22.05 17.97 13.48 8.96 5.48
2008: 8.07 8.98 9.21 13.43 20.70 22.55 23.44 22.24 18.40 13.50 8.62 4.18
2009: 2.98 5.27 9.47 18.89 19.56 20.85 23.36 24.04 20.04 13.60 11.57 3.95
2010: 0.20 3.60 10.17 15.41 15.21 22.88 27.06 21.16 17.20 13.73 7.35 -0.62
"""
# Collect data per month (just put all years on a heap)
# Not the most readable code, but this example is about what we do with
# the data next.
temps_per_month = [[] for i in range(12)]
for line in temp_data.splitlines():
if ":" not in line:
continue
temps = [float(t) for t in line.split(': ')[1].split(' ')]
for i in range(12):
temps_per_month[i].append(temps[i])
# Calculate means
mean = lambda x: sum(x)/len(x)
mean_temps_per_month = [mean(tt) for tt in temps_per_month]
# Prepare figure
vv.figure(1); vv.clf()
# Show means in a normal bar chart
a1 = vv.subplot(221)
b2 = vv.bar(mean_temps_per_month)
b2.color = 'r'
# Show means in a 3D bar chart
a2 = vv.subplot(222)
b3 = vv.bar3(mean_temps_per_month)
b3.color = 'g'
a2.daspect = 1,1,0.3
# Show box plot
a3 = vv.subplot(223)
bp = vv.boxplot(temps_per_month)
bp.lc = 'b'
bp.lw = 2
# Show violin plot
a4 = vv.subplot(224)
vp = vv.boxplot(temps_per_month, whiskers='violin')
vp.lc = 'm'
vp.lw = 3
# Set legends and ticks for each axes
for a in [a1, a2, a3, a4]:
a.axis.xTicks = 'Jan Feb Mar Apr May Jun Jul Aug Sep Oct Nov Dec'.split()
if a is a2:
a.axis.zLabel = 'Temperature [C^o]'
a.axis.showGridZ = True
else:
a.axis.yLabel = 'Temperature [C^o]'
a.axis.showGridY = True
a.axis.xTicksAngle = -30
app = vv.use()
app.Run()