Satellite data - alabarga/geospatial-python GitHub Wiki
There are many sources of satellite data you can use depending on your needs. Some platforms will let you view the data in your browser, some offer download options so you can process it and extract meaningful insights. Some focus on open (free) satellite imagery, some focus on the highest resolution satellite imagery available for purchase. If you are wondering which providers has the most up-to-date satellite imagery, the highest resolution, or the largest library for open data, this is a good summary.
| Type of imagery | Provider | Resolution (m) | Temporal coverage (frequency) | Temporal span | Cost | Mostly suitable for |
|---|---|---|---|---|---|---|
| MODIS | NASA | 500 | 1-2 days | 1999- present | Free | Vegetation monitoring, atmospheric conditions |
| Landsat 1-8 | NASA | 30 (varies) | 16 days | 1972- present | Free | Urban extant, land use change, vegetation monitoring, atmospheric conditions |
| ASTER (infrared bands) | NASA, METI, ERSDAC | 30 | 16 days | 1999- present | Free in the US | Urban extant, land use change, vegetation monitoring, atmospheric conditions |
| CBERS 1-2 | China, Brazil | 20 | 26 days | 1999- present | Free | Urban extant, land use change, vegetation monitoring, atmospheric conditions |
| ICESAT/GLAS (LIDAR; elevation data only) | NSDIC | 60 | 91 days | 2003-2009 | Free | Ice, cloud, and land elevation |
| Skybox | Skybox Imaging, Google | 0.9 | N/A | 2014- present | Case-by-case | High-detail agricultural monitoring, urban-area land use, refugee movements, commodity storage, natural disasters, houses, roads, automobiles, large groups of people |
| Planet Labs | Planet Labs | 4 | N/A | 2014- present | Case-by-case | High-detail agricultural monitoring, urban-area land use, refugee movements, commodity storage, natural disasters, houses, roads |
| GeoEye-1 | DigitalGlobe | 1.65 | 8.3 days | 2008- present | Varies; Around $25 per km2; Grants available | High-detail agricultural monitoring, urban-area land use, refugee movements, commodity storage, natural disasters houses, roads, automobiles, large groups of people |
| IKONOS | DigitalGlobe | 3.2 | 3 days | 1999- present | Varies; Around $25 per km2; Grants available | High-detail agricultural monitoring, urban-area land use, refugee movements, commodity storage, natural disasters houses |
| Worldview 1-3 | DigitalGlobe | 1.24 | 1.7 days | 2007- present | Varies; Around $25 per km2; Grants available | High-detail agricultural monitoring, urban-area land use, refugee movements, commodity storage, natural disasters houses, roads, automobiles, large groups of people |
| Quickbird | DigitalGlobe | 2.62 | 2.5-5.6 days | 2001- present | Varies; Around $25 per km2; Grants available | High-detail agricultural monitoring, urban-area land use, refugee movements, commodity storage, natural disasters houses, roads, automobiles, large groups of people |
| RapidEye | Blackbridge | 6.5 | 5.5 days | 2009- present | Area dependent | High-detail agricultural monitoring, urban-area land use, refugee movements, commodity storage, natural disasters, houses |
| SPOT 1-6 | Airbus | 1.5 (varies) | daily | 1986- present | Varies; Around $5,000 per scene (60km x 60km) | High-detail agricultural monitoring, urban-area land use, refugee movements, commodity storage, natural disasters, houses, roads, automobiles, large groups of people |
| Pleiades 1A-1B | Airbus | 2 | 26 days (taskable to daily) | 2011- present | Varies; Around $20 per km2 | High-detail agricultural monitoring, urban-area land use, refugee movements, commodity storage, natural disasters, houses, roads, automobiles, large groups of people |
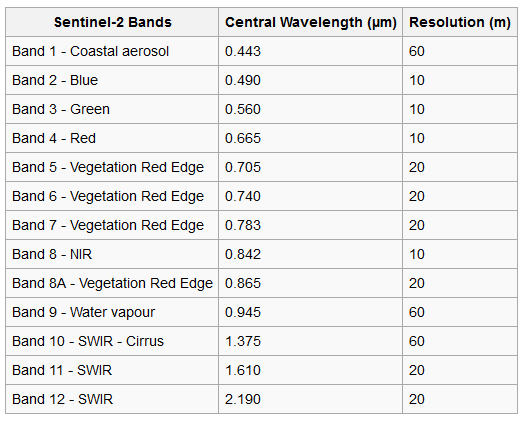
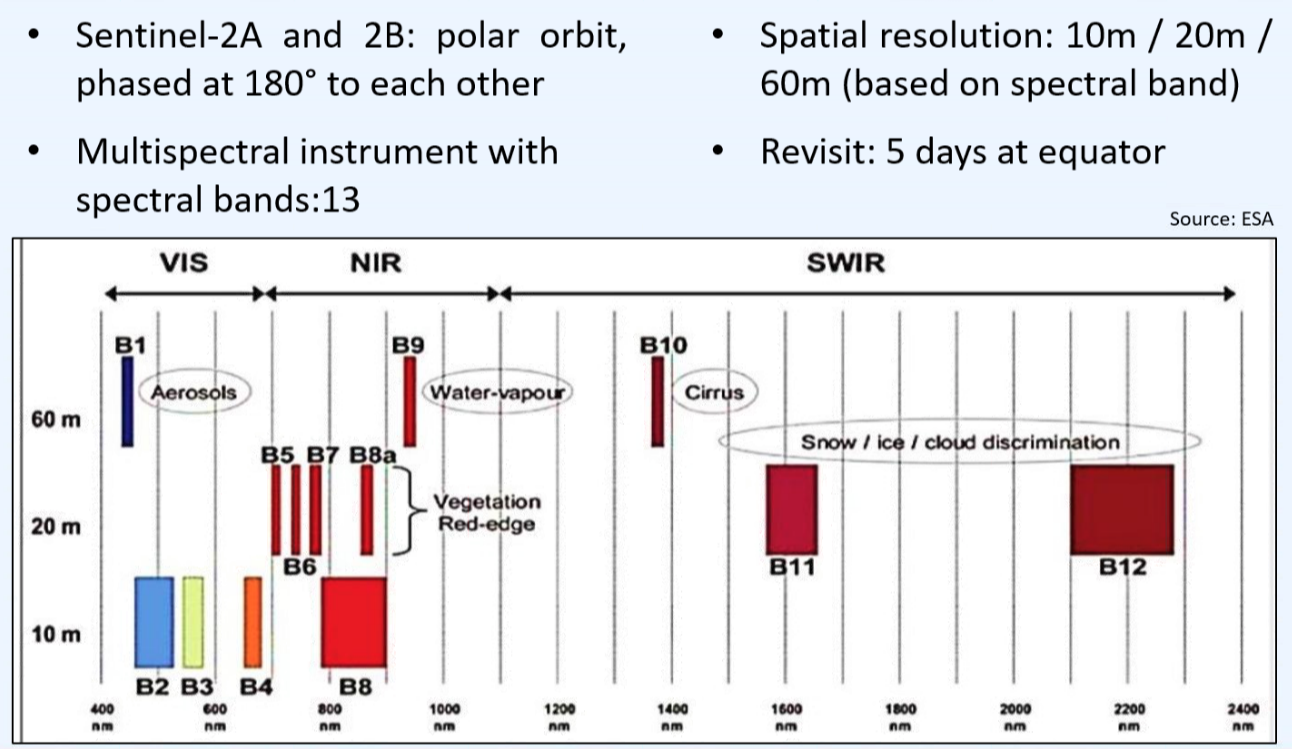
Sentinel-2
Sentinel-2 data is multispectral with 13 bands in the visible, near infrared and shortwave infrared spectrum. These bands come in a different spatial resolution ranging from 10 m to 60 m, thus images can be categorized as high-medium resolution. While there are other higher resolution satellites available(1m to 0.5 cm), Sentinel-2 data is free and has a high revisit time (5 days) which makes it an excellent option to study environmental challenges. Here is a useful table for sentinel 2 bands colours.
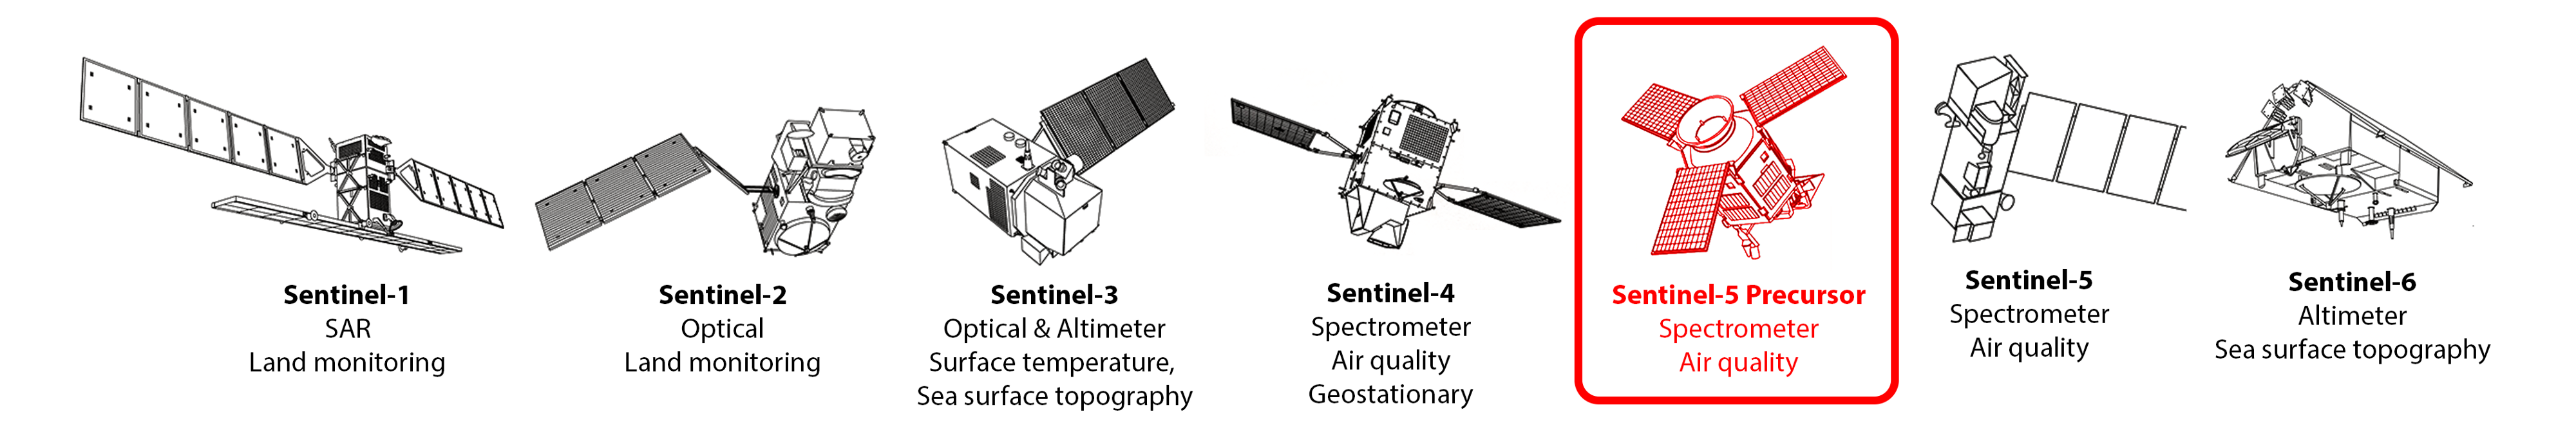
Sentinel-5P data and characteristics
 Sentinel-5 Precursor, or Sentinel-5P is the first mission dedicated to monitoring our atmosphere. Operating in a sun-synchronous orbit, the satellite maps a multitude of air pollutants around the globe. After launching in 2017 and subsequent calibration periods, Sentinel-5P reached its routine operations phase in early 2019.
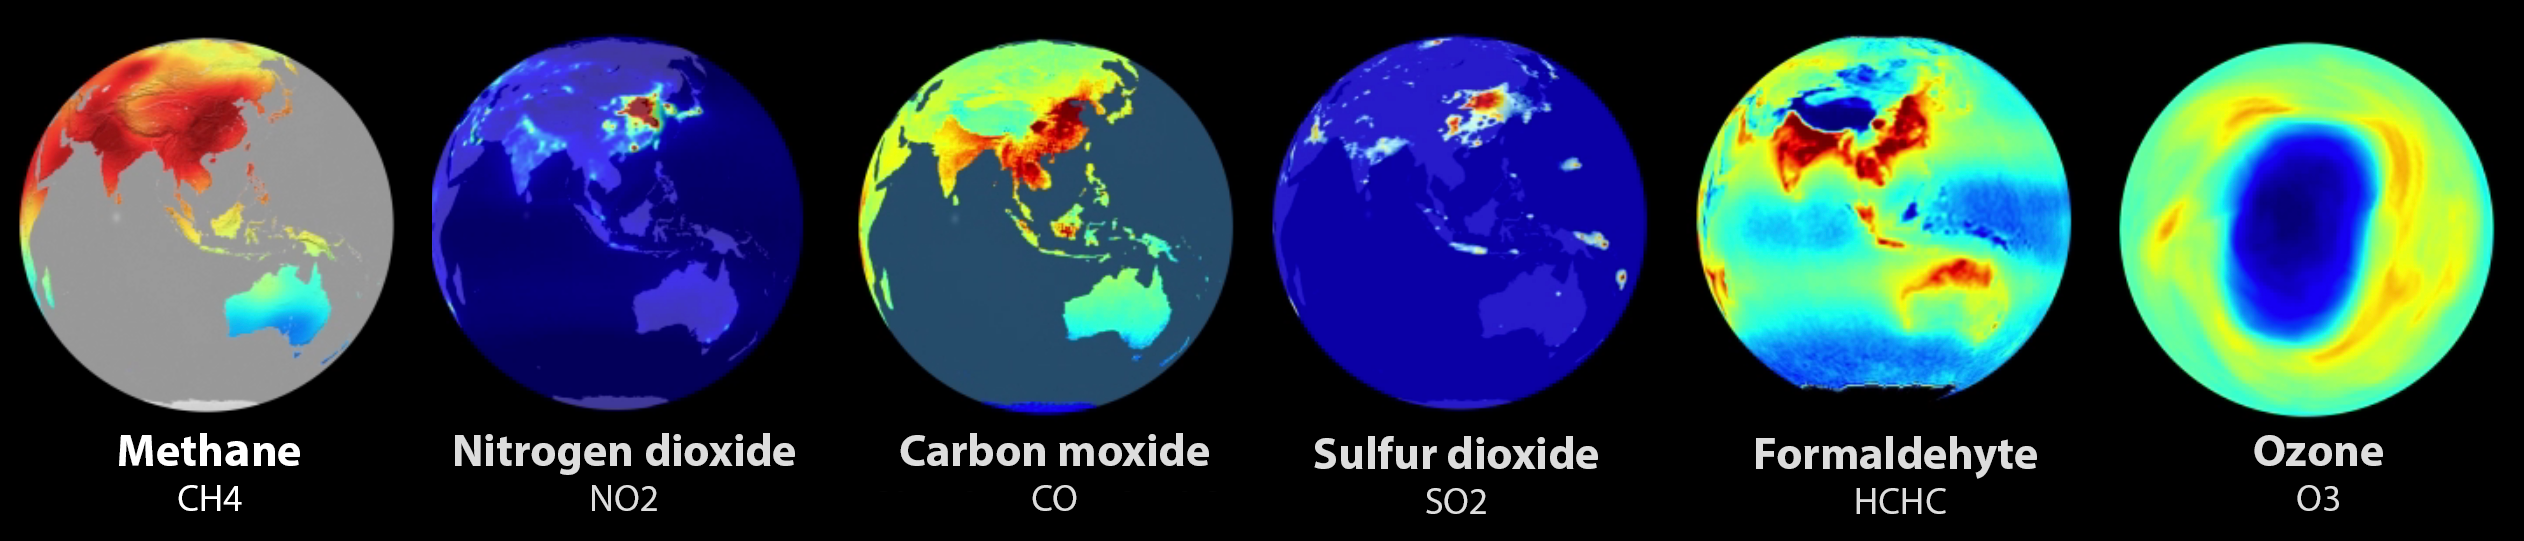
Since then, the European Space Agency (ESA) has made the final array of Level-2 data products of atmospheric gases available (see image above), offering daily coverage of the entire globe at 7x7 km resolution.
These products are not measured directly. Instead, the satellite’s 8-band spectrometer instrument, called TROPOMI (TROPOspheric Monitoring Instrument), takes measurements in the ultraviolet, visible, near and short-wavelength infrared light spectrum. In combination with auxiliary input data (e.g. air pressure, snow/ice masks), the concentration of each atmospheric gas is then modeled based on their absorption characteristics at specific wavelengths of the light.
While orbiting the globe at an altitude of ~800 km, Sentinel-5P continuously takes measurements of a 2600 km wide area. Each day, it orbits the Earth 14 times, with each orbit’s coverage slightly overlapping—less at the equator, more so near the poles.
This enables Sentinel-5P to take one full picture of the entire Earth’s surface per day.
However, the orbit pattern has some variation. Each day, the satellite orbit shifts a bit further eastward, so two images of the same location for consecutive days also have slightly different ground coverage. After 16 days, the satellite passes over the exact same geographical point on the ground again, restarting the orbit sequence.
Sentinel-5P data products are delivered by ESA in netcdf data format, as one long image strip per earth orbit—14 per day. Depending on the data product, they vary in file size between 0.1 to 2 GB, as each product contains a variety of quality bands, ancillary data, and sensor parameters.