Open (geo) data - alabarga/geospatial-python GitHub Wiki
Governments are making more data available and making it more accessible. Data journalists can find and tell many stories with local government data, at the state/region level, or with federal data. Further, there are crowdsourced data repositories that hold many stories on their own.
From campaign finance to health code violations to police reports, there are many types of open data waiting for your visualizations. If your data is in a spreadsheet, BatchGeo helps you map open data with a simple copy and paste.
Climate change
Climate models predict massive shifts in temperature and precipitation over the next 100+ years and it is a challenge to visualize climate change over space and time. These changes will not be the same everywhere; they will appear in complex patterns across the earth’s landscapes.
WorldClim is a database of high spatial resolution global weather and climate data. These data can be used for mapping and spatial modeling. The data are provided for use in research and related activities; and some specialized skill and knowledge is needed to use them (here is some help). More easily available data for the general public will soon be available here.
You can download gridded weather and climate data for historical (near current) and future conditions.
https://www.worldclim.org/data/worldclim21.html
OpenStreetMap is a terrific tool for mapping and editing maps. It is a user-created map of the world, made by thousands of participants over the years. The structure is much like Wikipedia – anyone can edit the map, and users correct each others’ errors so that the results you see are highly accurate.
Often, you’ll want to take part of the map you see on the OSM site and use it somewhere else, like on your website or blog as an illustration. This tutorial focuses on taking a map image off of the main OSM site so you can use it someplace else.
Starting a new Map
First, go to www.openstreetmap.org.
There is a search box on the lefthand side of the homepage. You can type in there the name of the place you want to find on the map. A list of options will come up and if your area is mapped, it will appear there. Click on it to get to the part of the world you want to capture.
Or, you can zoom in and out of the map using the righthand side + and – buttons, and click and drag the map around using your mouse to find your part of the world.
Once you’ve found the place you want, your screen should look something like this:

You don’t even have to log in to take this data right from the website to your computer desktop. First, drag the map around and zoom in and out to show the exact area that you are going to want. Click where it says Export.
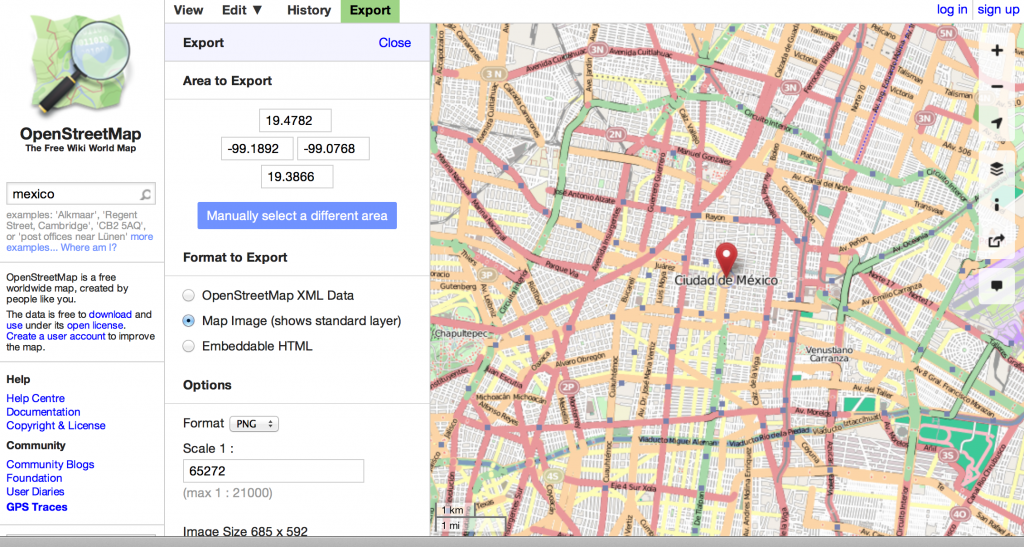
The latitude and longitude coordinates shown will correspond to the edges of the actual map image you see, so you can leave them alone since you already adjusted that.
Formatting your map
Where it says Format to Export, at this point we just want an image file so you can leave it on Map Image. Below, choose your preferred format to export.
Where it says Scale, you might need to experiment with the size. The Maximum is given, and if you type in that exact number (in my example, it’s 21000) you’ll get every tiny bit of data in that box and a fairly large file size. The number given in my example is 65272 (actually less than 21,000 because it’s a ratio 1:x) will give you a fairly small file size and image, so if you zoom in it becomes pixelated. Choose the size that best works for your particular needs, and hit Export. That’s all – now you have a nice image to put on your blog post or website – or a printed document of any kind.
If you want to get a little more advanced, and use the HTML code, you can also place a marker onto the map and then put the code into your website directly.
Click where it says Embeddable HTML.
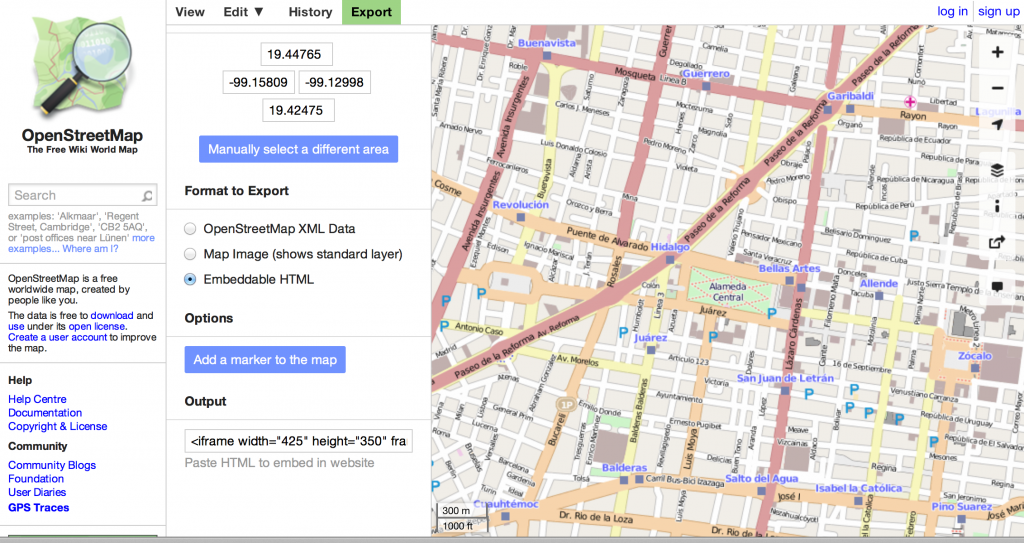
If you want, click where it says Add a marker to the map and click on the map to add a little pointer.
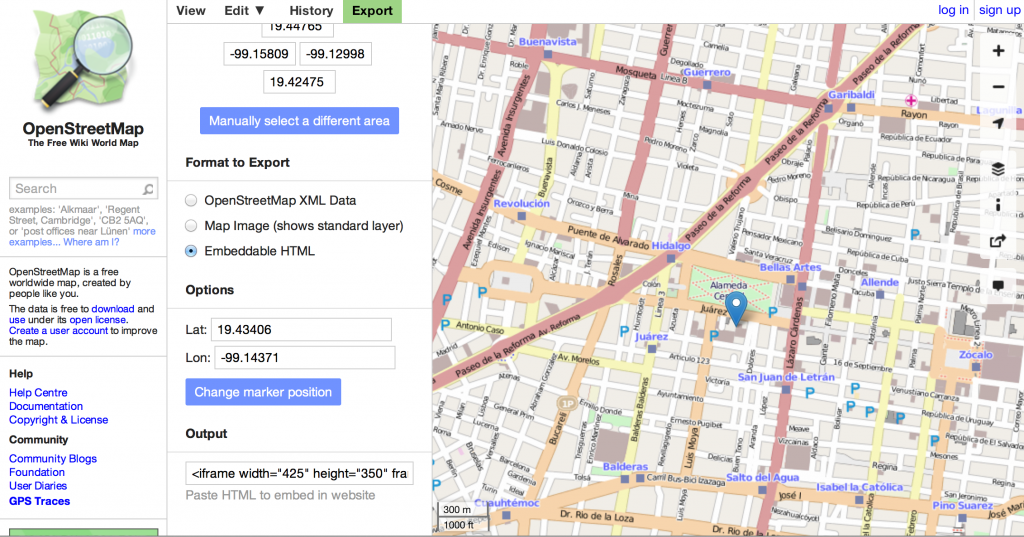 Then copy-paste the HTML displayed in the box into your website.
see Learn OSM to get into more depth with mapping.
What if your area isn’t mapped? Or you want to add a feature, like a waterway or lake? You can easily edit the OpenStreetMap base map that you find at www.openstreetmap.org. And while doing it you will become part of the community of thousands of mappers worldwide who are creating the map together. You’ll also support open, free use of map data by using OSM instead of a commercial product (like Google).
Go to www.openstreetmap.org. First, click Login in the righthand upper corner and either register yourself or log in if you’re registered already. You have to have an account in order to edit the map.
Then, center the map image on the place you wish to edit. You can use the Search box on the left hand side to find your area, or use the zoom button to zoom out then slide the map to your desired location, and zoom back in.
Then click the small arrow to the right of the word Edit above the map. There will be a drop down menu. Select “edit with iD”.
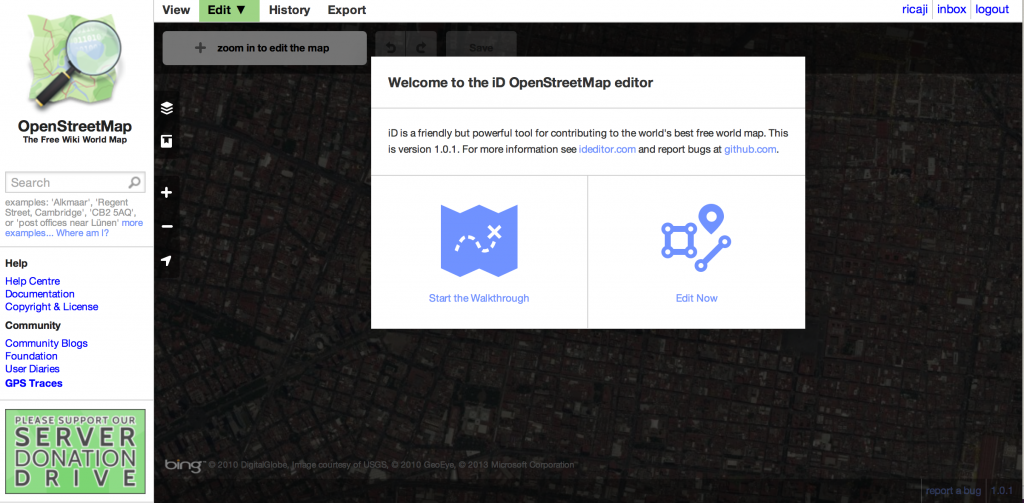
You can always do the Walkthrough in order to see how to use this editing software. Or, click “Edit Now” and follow this tutorial!
Editing your map
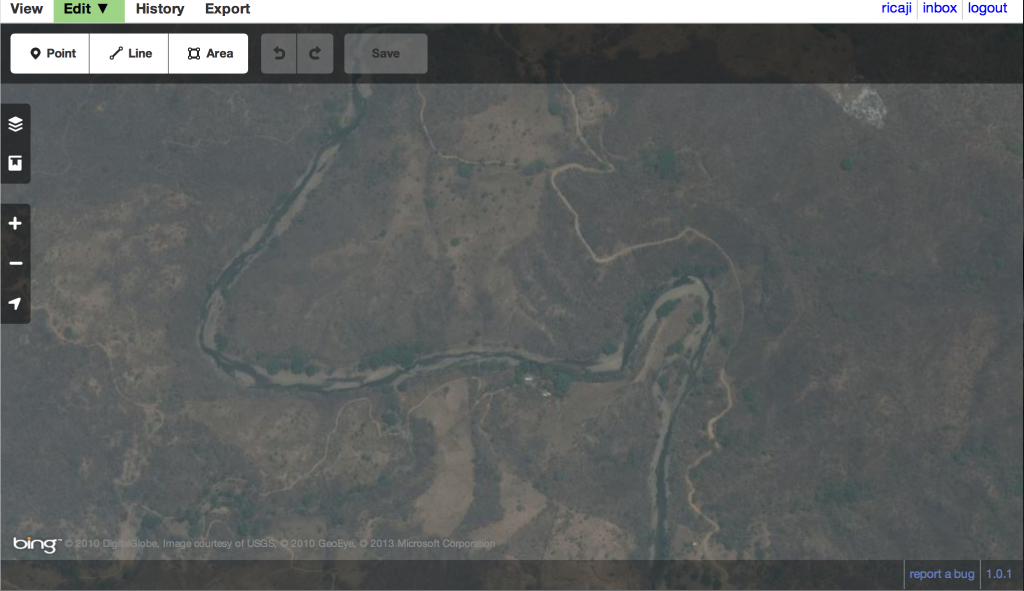
You may be told to “Zoom in to Edit the Map” if you’re not sufficiently zoomed in – just click there. Once the software displays all the mapped features on top of a nice satellite image provided by Bing, you can see a hand replace the arrow of the mouse pointer. Then you can grab and slide the map around to make sure it’s in the right place.
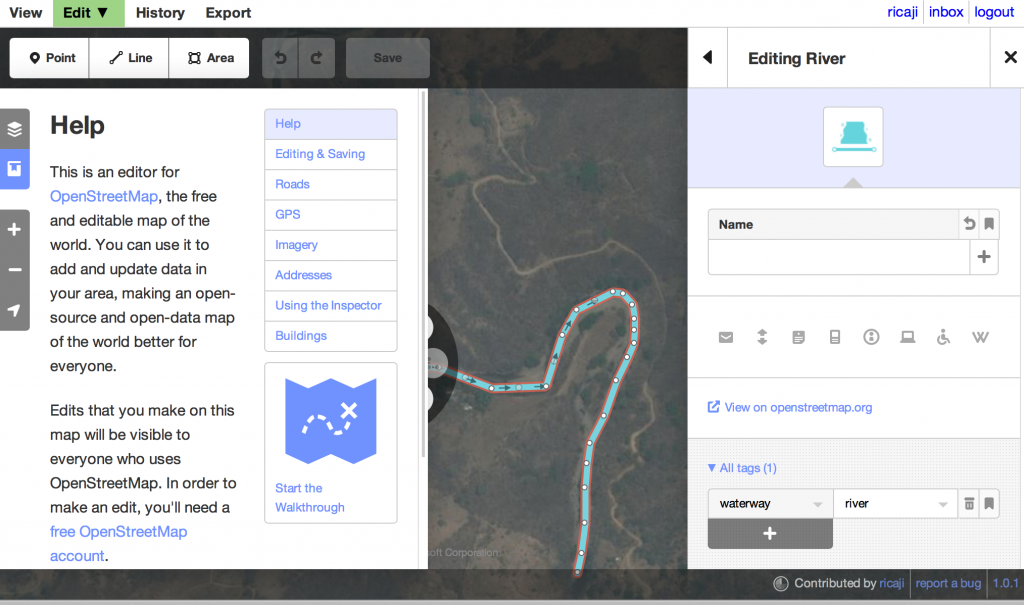
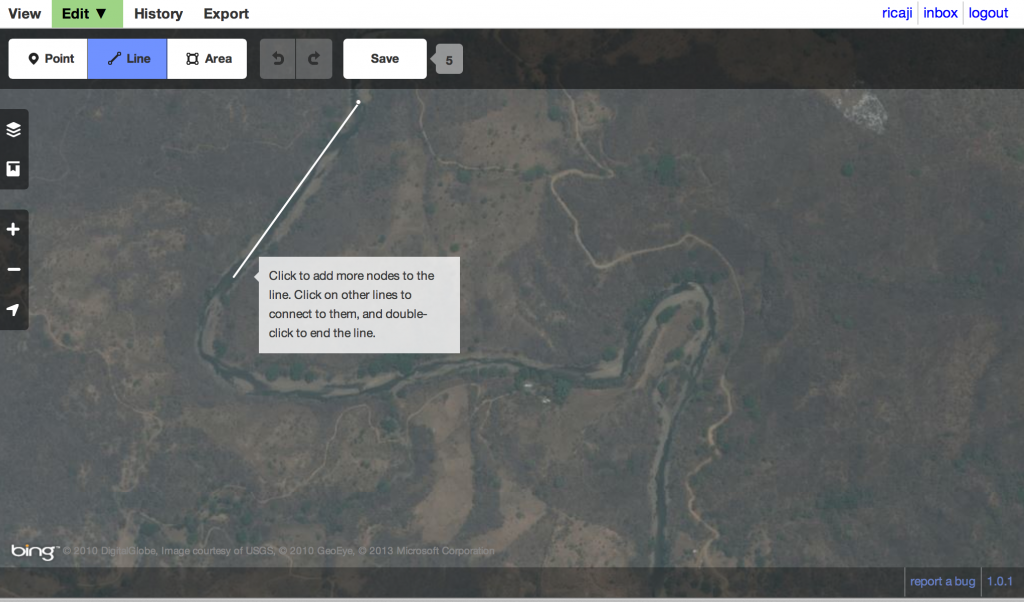
Next, we will be adding a water feature – a river – to the map. Click on where it says “Line”.
Then click at the beginning of the river in your screen. You can then click again along the path of the river, creating an approximation of the river. Pop up windows with text will help you along the way. At the end of the line, double click and your river map is complete.
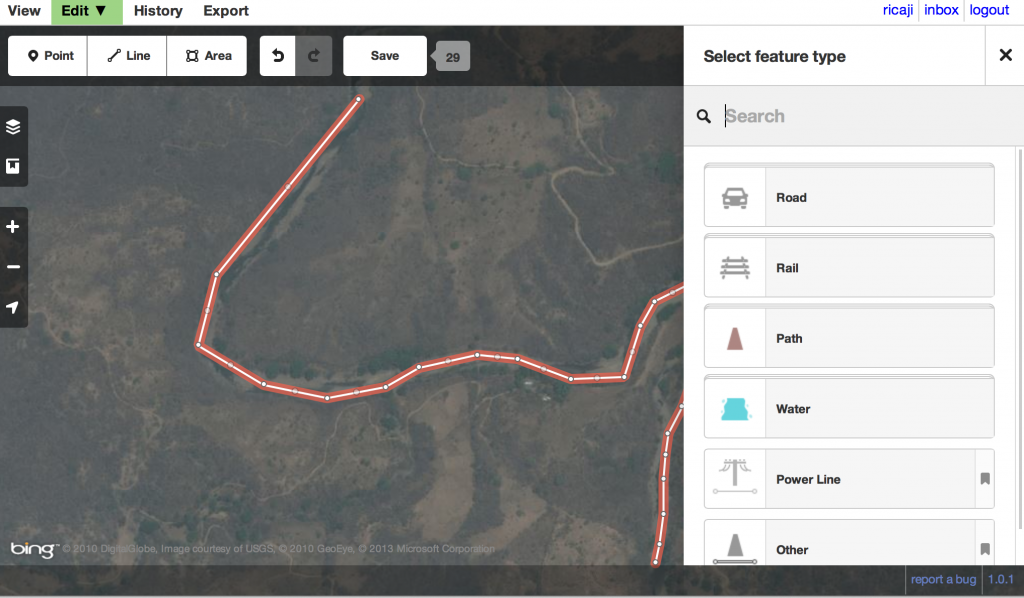
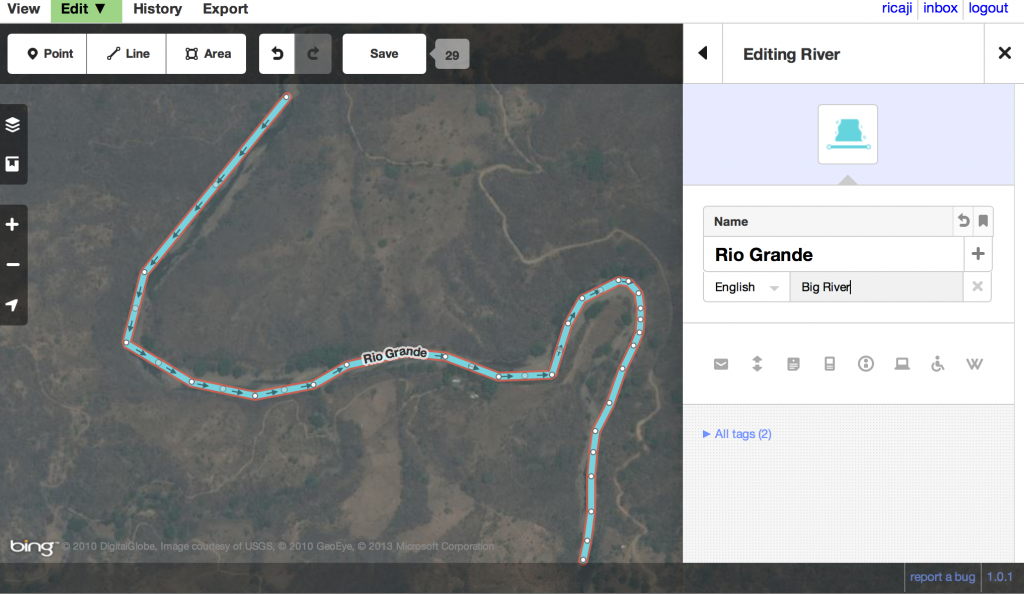
After you double-click, this side bar will pop up asking you what type of feature you’re mapping. Select in this case, Water, then River.
Then you’ll be asked to add a name for the river. You can add it in the original, local language. You’ll see a down arrow to the right of the name box; click there and another box will open. There on the lefthand side you can select a secondary language like English and write the name in that one too. This is a good idea when you want to make sure all the languages of map users will be represented.
If you click where it says “All tags”, you’ll see how the name and feature are being recorded in the OpenStreetMap database. This is useful to know in case later on you end up using a different editor. This is the standard tagging structure for OSM.
If you click on the upper right hand button shaped like a square above the name, you’ll see how the tag was determined and get a link to the OSM wiki. This is because many times (though not for a river which is fairly simple) people will discuss how to categorize things and try to come to collective decisions on the tagging. If you end up mapping something unusual and can’t find a tag category for it, try looking there.
Now go ahead and click Save.
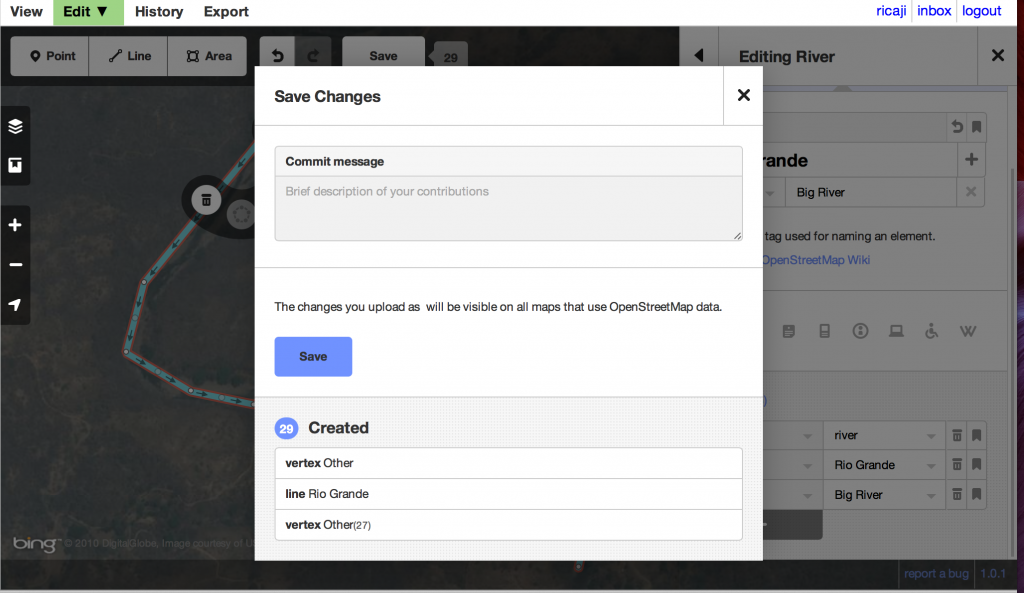
You’ll see a list of your changes to the map. You should add a quick message about what you’re adding, in case someone wants to follow up and verify it or contact you later about it. Once you hit the final save button, your addition is live on OSM!
What if I made a mistake on the line?
There are several ways to make changes to your line. In the example, there is a spot where I want to add more points so the line is better following the curve of the river path. As you can see below if you click once on the line where there is no point, a grey dot appears. If you click again there and hold, you can add a point there and move it around.
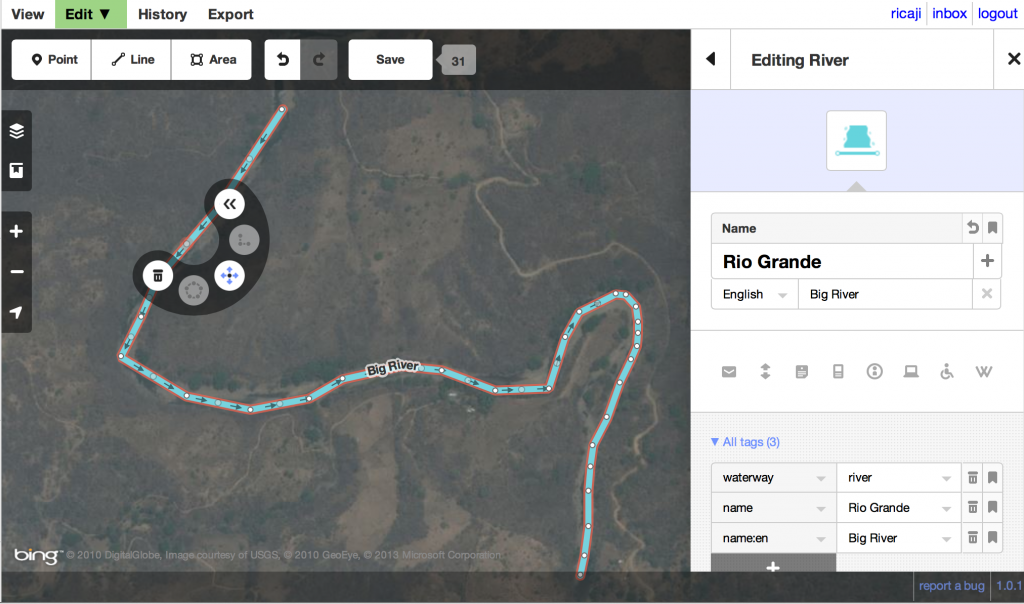
The semicircle that pops up around the grey dot also gives you some options, like discard that part of the line or in the case of a river, change the direction of the river flow. You’ll see some arrows on your river, which are meant to indicate which direction it flows. Make sure you have that correct, too. Don’t worry if you’ve already saved, everything in OSM can be edited at any time!
Share your map
After you’ve saved, you should let everyone know by sharing on Facebook or Twitter! Or just go see your edit in the live map.
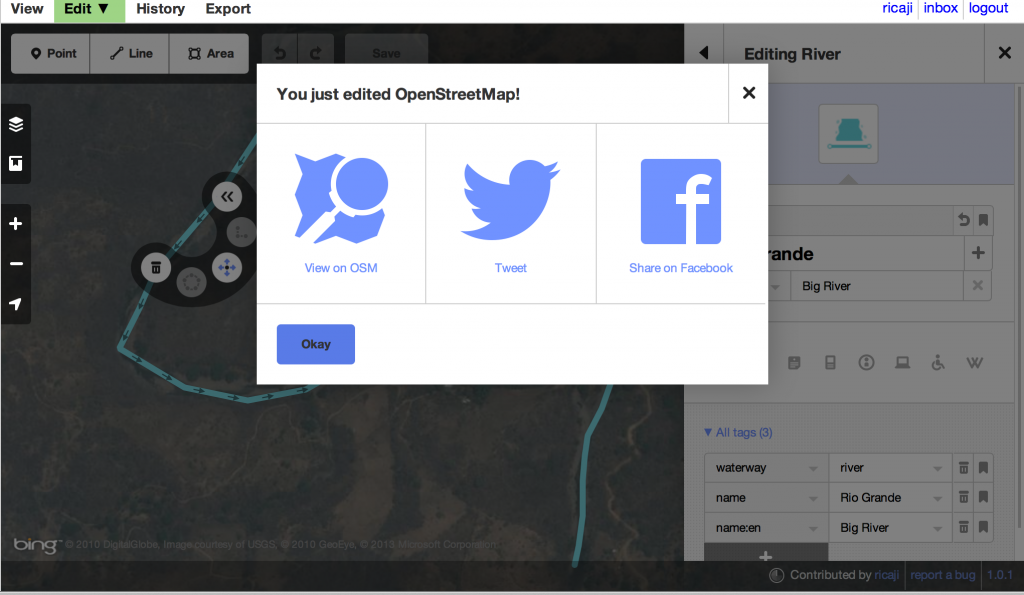
Here is your changeset or any changes you’ve made:
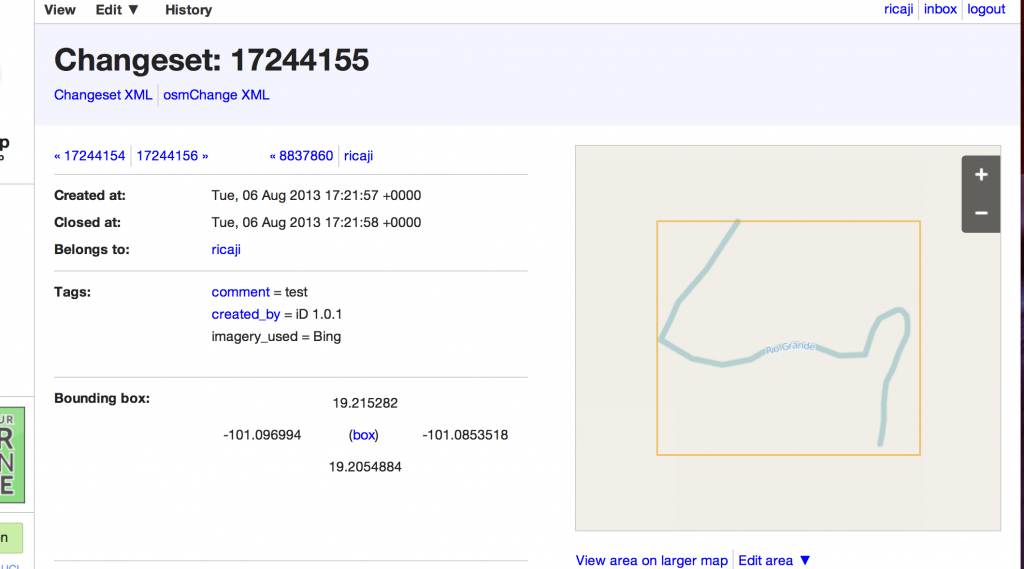
What if you made a mistake? I’ve actually named this river myself so the name is incorrect. Well, someone might come along and delete my edit. Eventually that will in fact happen. But I can also remove the name myself.
I just go back to the window where I was editing the map (it should still be open) and click the river again to open the editing window. I click where it says All tags to open the tag list. Next to the names, I click the small trash can and the names disappear. Don’t forget to Save!
Conclusion
That’s all! For much more information on mapping in iD please see the Help section. Look for the small box on the upper left hand side of the map and click: