Home - alabarga/geospatial-python GitHub Wiki
Geospatial information analysis and visualization
Maps and spatial information within the Exposing the invisible Kit
- Using Maps to See Beyond the Obvious
- Maps for advocacy Booklet
- Seeing the world through Google's eyes
- Starting satellite investigations
Topics
-
Introduction to geospatial data. Main sources of information, data formats, examples. How to combine geospatial information with other sources of information. Refer to existing content in the Kit
-
How to get the data.
-
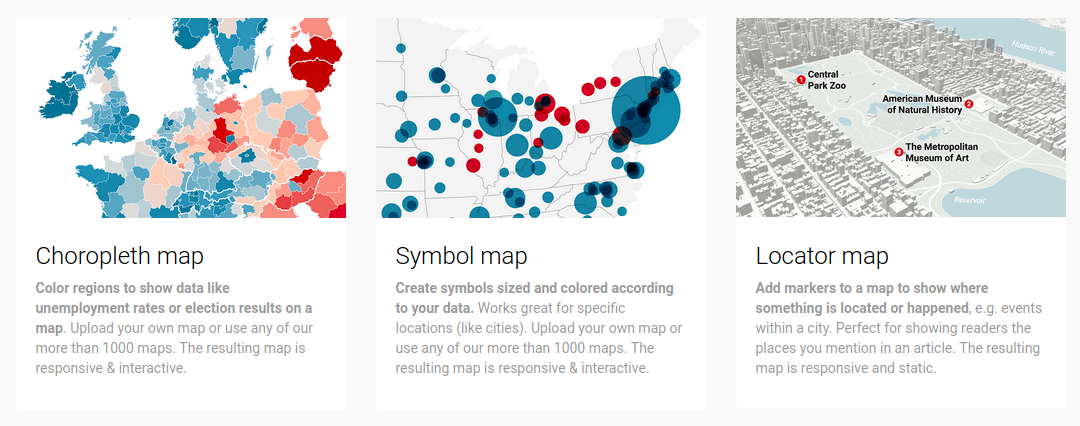
How to visualize information using maps with Datawrapper. Discuss point, bubble and choropleth map types, their uses, etc
-
Basic intro to Python for non-developers
-
Introduction to geospatial data analysis in Python, with a focus on tabular vector data. It first focuses on introducing the participants to the different libraries to work with geospatial data and will cover munging geo-data and exploring relations over space. This includes importing data in different formats (e.g. shapefile, GeoJSON), visualizing, combining and tidying them up for analysis, and will use libraries such as pandas, geopandas, shapely, PySAL, or rasterio.
-
Creating interactive maps with Python
-
Analyzing satellite data
-
Copernicus es el programa civil de observación de la Tierra coordinado y gestionado por la Comisión Europea y la Agencia Europea del Medio Ambiente con el objetivo de proporcionar información precisa y actualizada en seis áreas temáticas:
- cambio climático
- seguridad
- gestión de emergencias
- atmósfera
- ámbito terrestre
-
El satélite Sentinel-5p de la Agencia Espacial Europea lleva a bordo el sensor TROPOMI. Este sensor permite monitorizar concentraciones de gases como el ozono, el metano, el monóxido de carbono, el dióxido de nitrógeno o el óxido de azufre. Con una resolución espacial de unos 7kmx7km, Sentinel-5p cubre diariamente toda la superfície terrestre. De este modo puede hacerse un seguimiento exhaustivo de la evolución de estos gases, y analizar episodios muy concretos.
-
Acceso a Planet como empresa proveedora de imágenes de satélite y se enseñará paso a paso como usar Python notebooks en combinación con librerías de Planet y otras de tratamiento de imágenes para obtener un índice de vegetación (NDVI).
-
References
- Python for Journalists
- Coding for journalists
- Copernicus, el programa de observación de la Tierra
- Mapping for Advocacy
- Micro-satellite Data: Measuring Impact from Space
- Teledetección y Python para analizar los efectos de la COVID-19
- Introduction to Geospatial Data Analysis with Python (video) Code
- Análisis de imágenes de satélite con Python notebooks Video Code
- Geographic Data Science
- GEOG 585: Open Web Mapping
- SchoolofdataIntroduction to mapping
- Interactive maps with Python