Debug Panel Overview - akumina/AkuminaTraining GitHub Wiki
Overview
The Debug Panel is a UI feature within the Akumina Framework that provides a window for users to view information about the Site as well as an Interface to refresh Caches on the site. The Debug Panel is accessible by holding down the CTRL + UP keys or clicking on the refresh icon from the Akumina Flywheel.
![]()
As of 4.0.0.0, the Debug Panel is divided into different sections. They are detailed below.
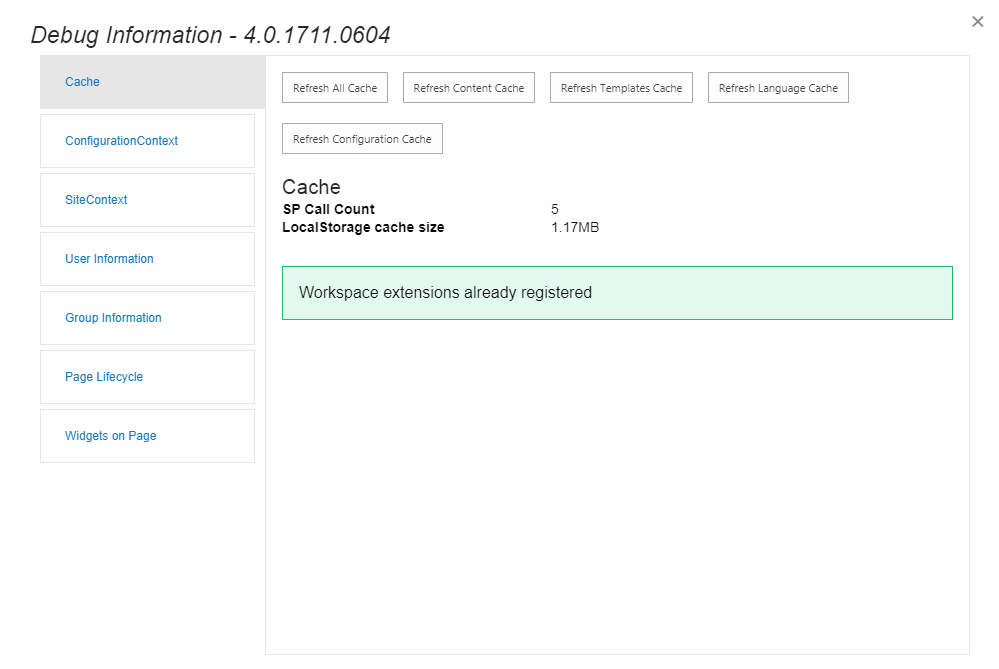
Cache
The Cache window provides an interface to refresh the various caches within the Akumina Framework
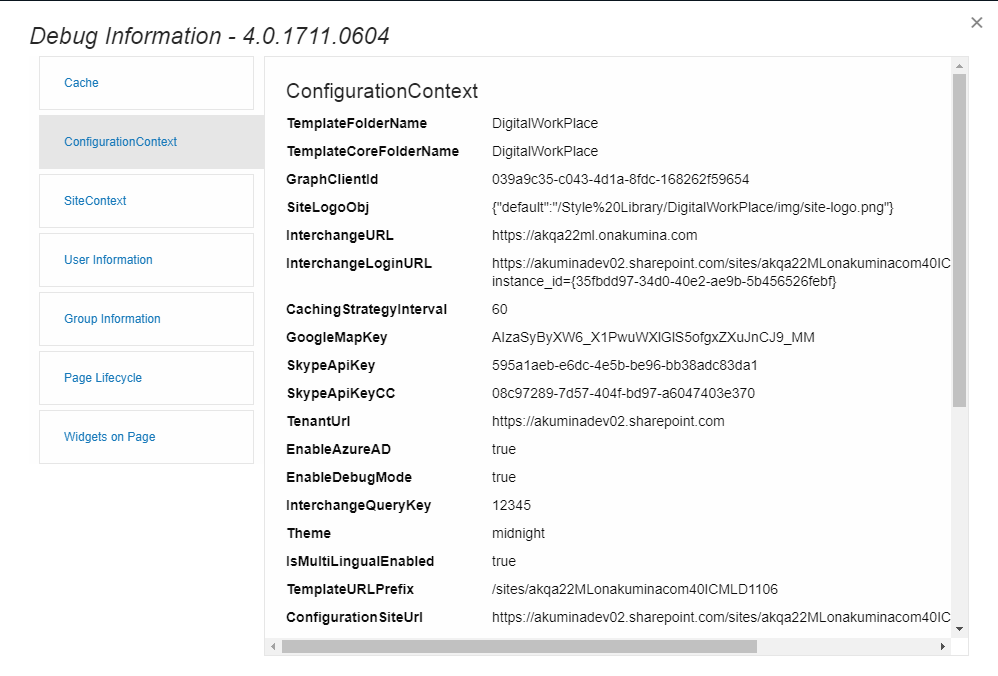
ConfigurationContext
The ConfigurationContext window shows the values of the Out of the Box ConfigurationContext properties
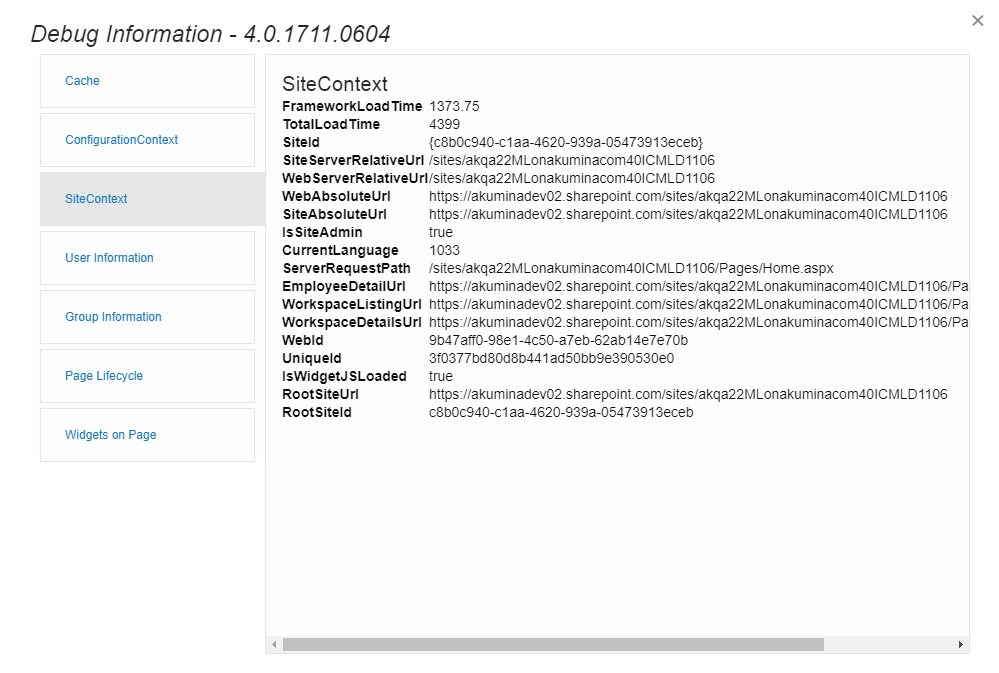
SiteContext
The SiteContext window shows information about the site, including performance information.
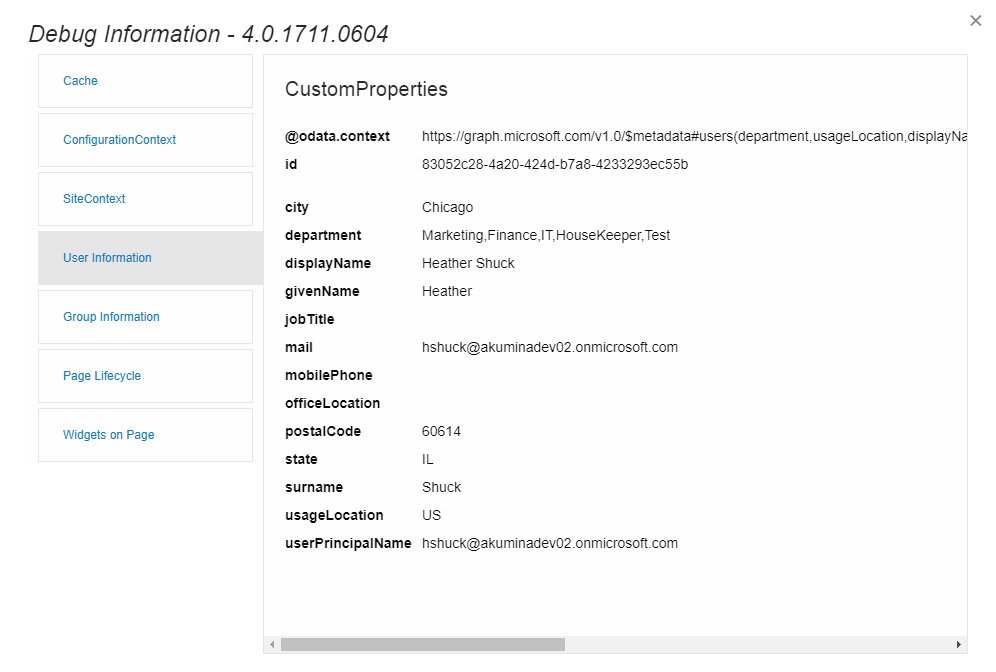
User Information
The User Information window shows values fetched by the Graph API about the user currently logged in.
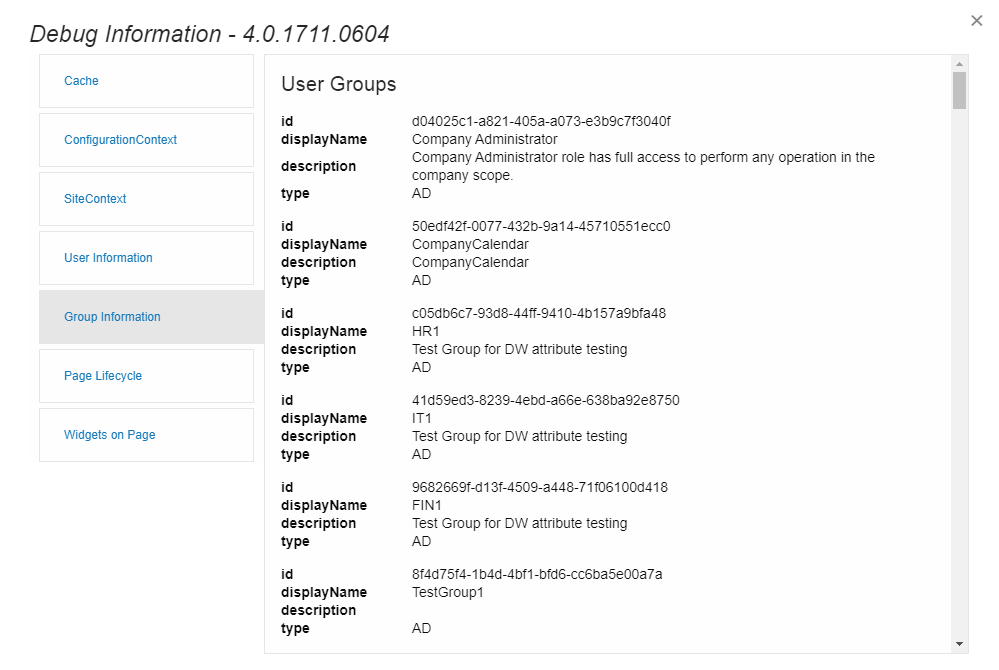
Group Information
The Group Information window shows the Groups that exist on the Office 365 tenant
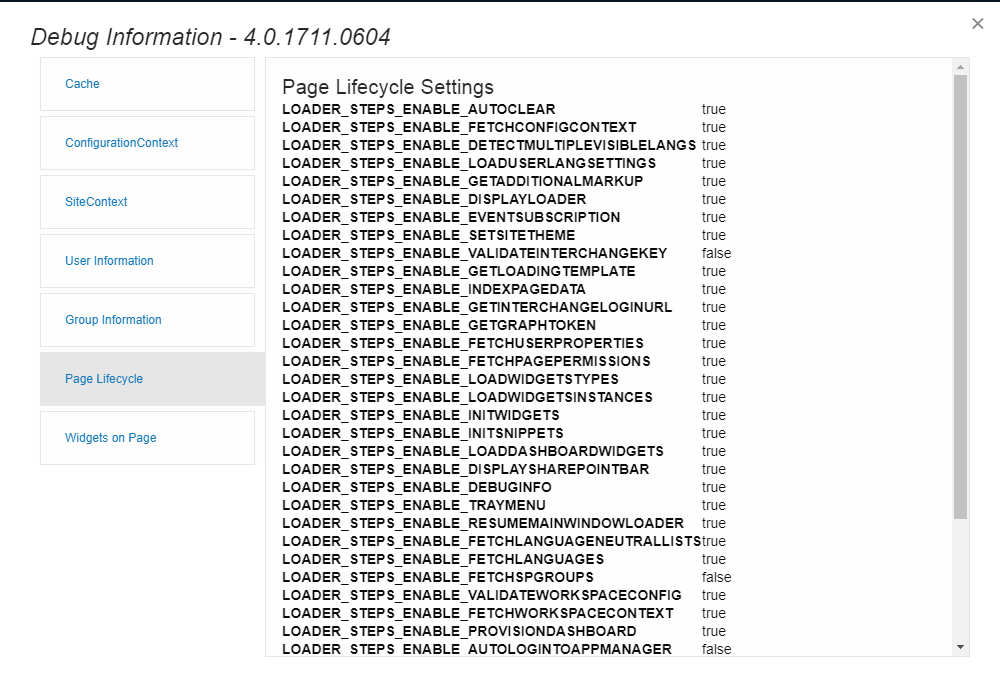
Page Lifecycle
The Page Lifecycle window shows Out of the Box steps and whether or not they are activated
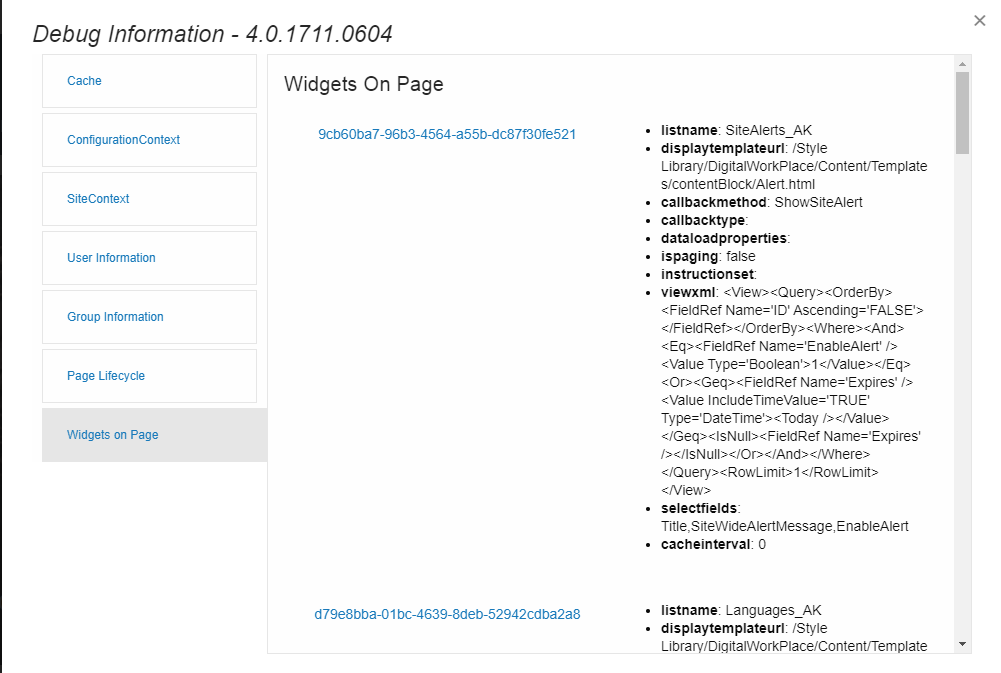
Widgets on Page
The Widgets on Page window shows information about each widget instance that is living on the current page.