Milestone 4 - airavata-courses/Swishh GitHub Wiki
Jmeter Load Testing results
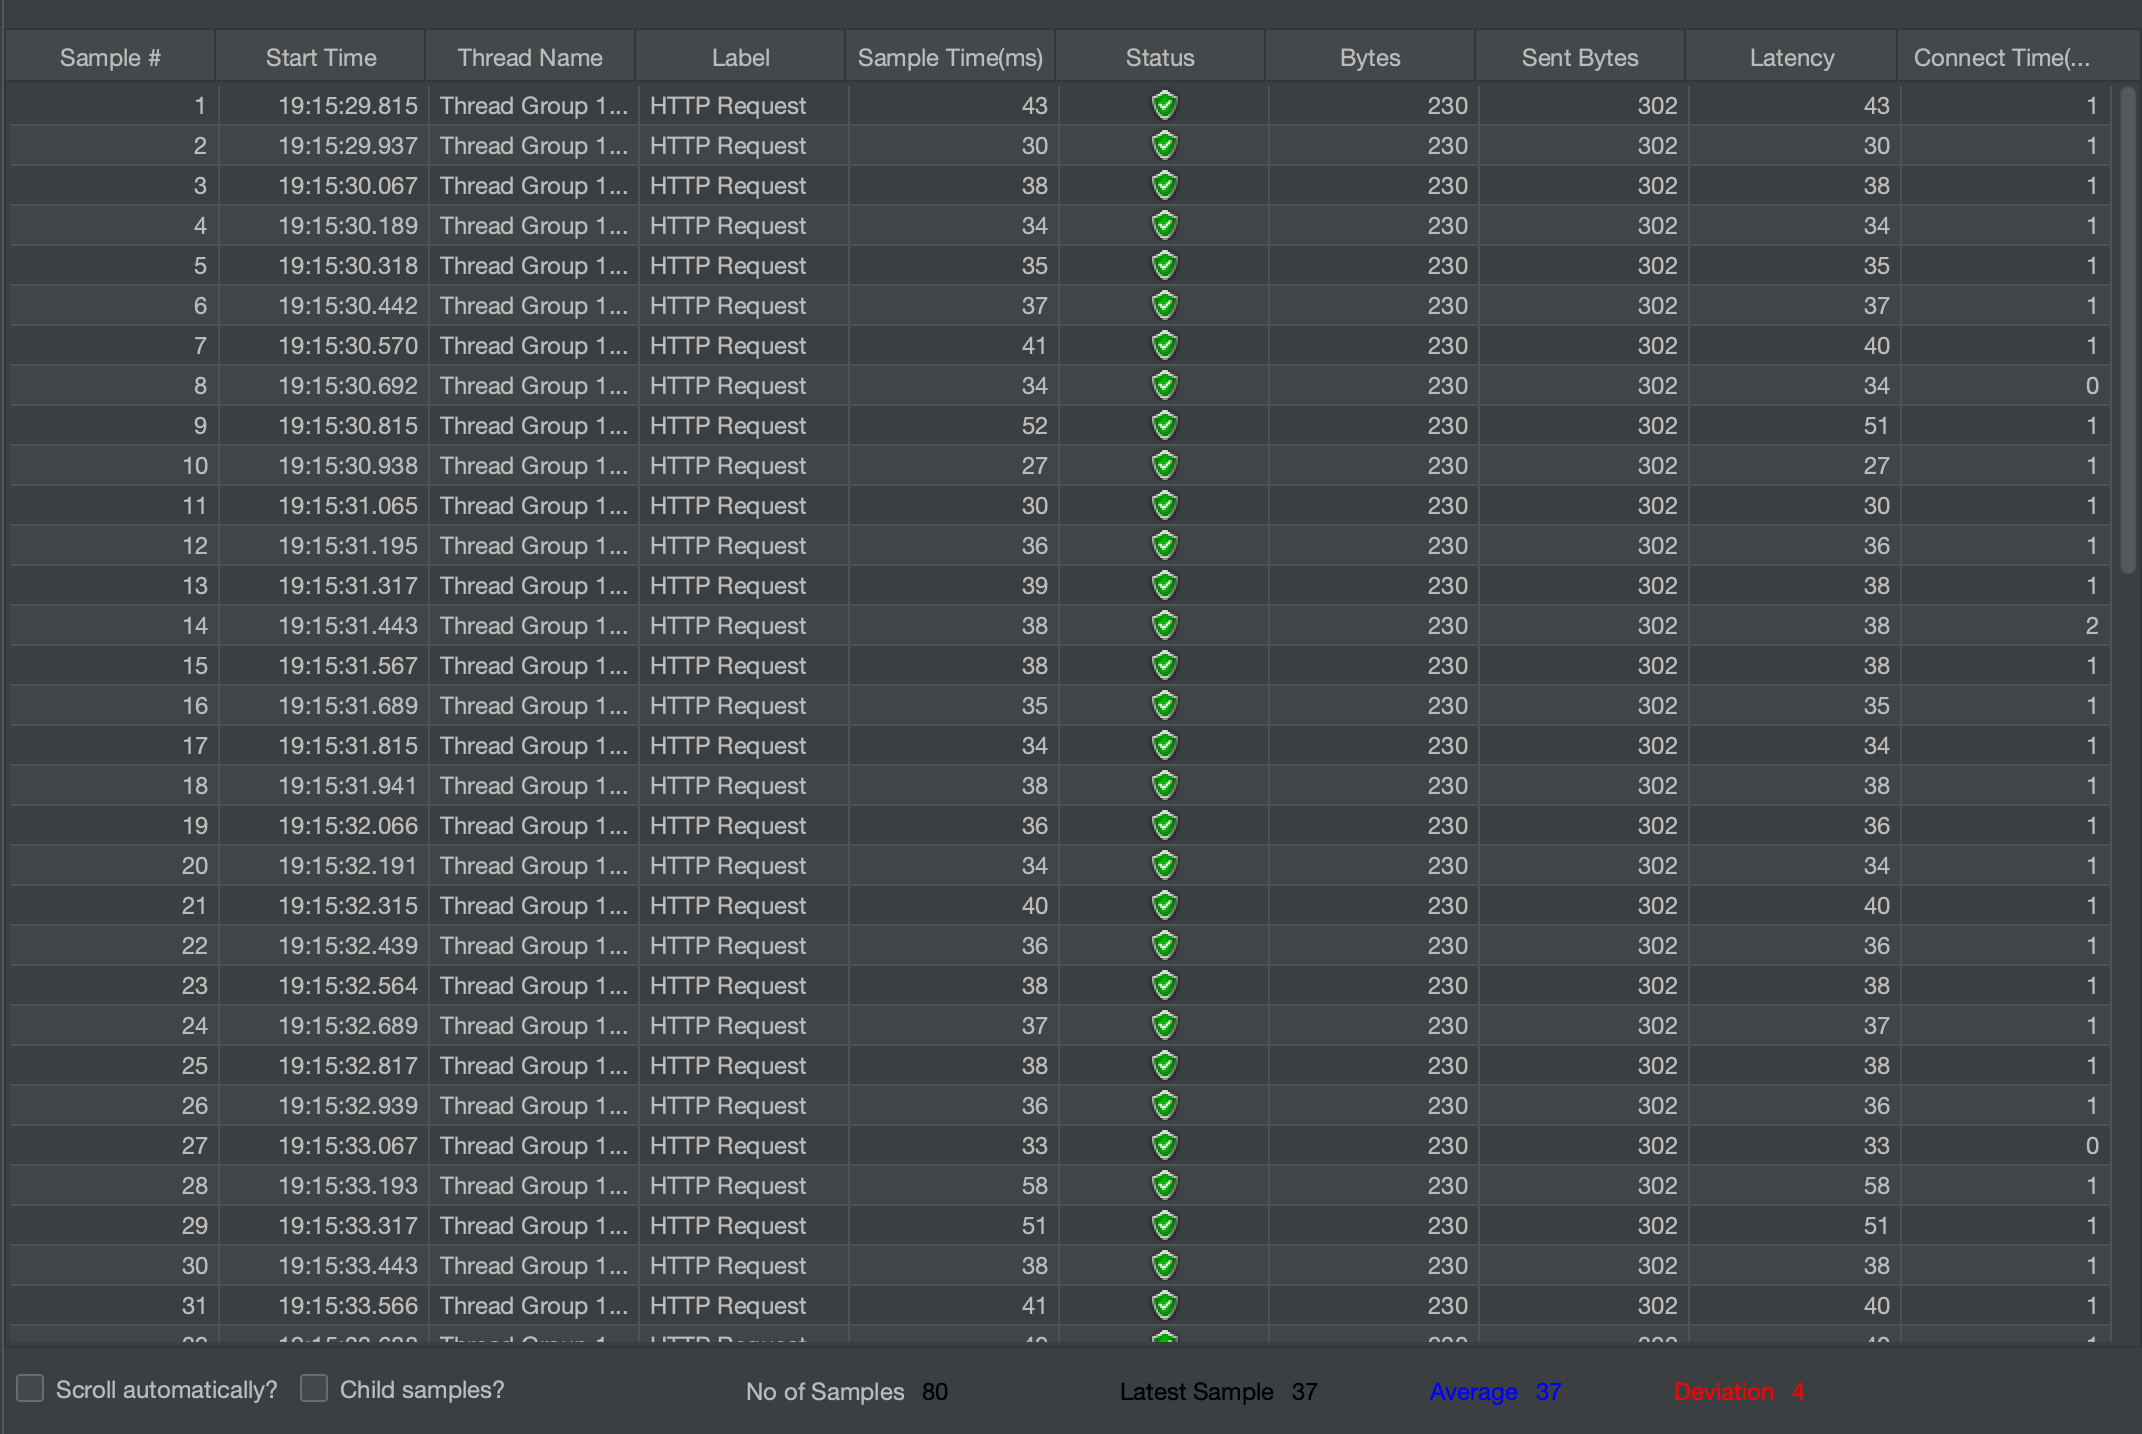
When the number of threads to ramp us seconds is 80 to 10, that is when there are 80 threads for every 10 seconds, the results have been captured.
Results in Table
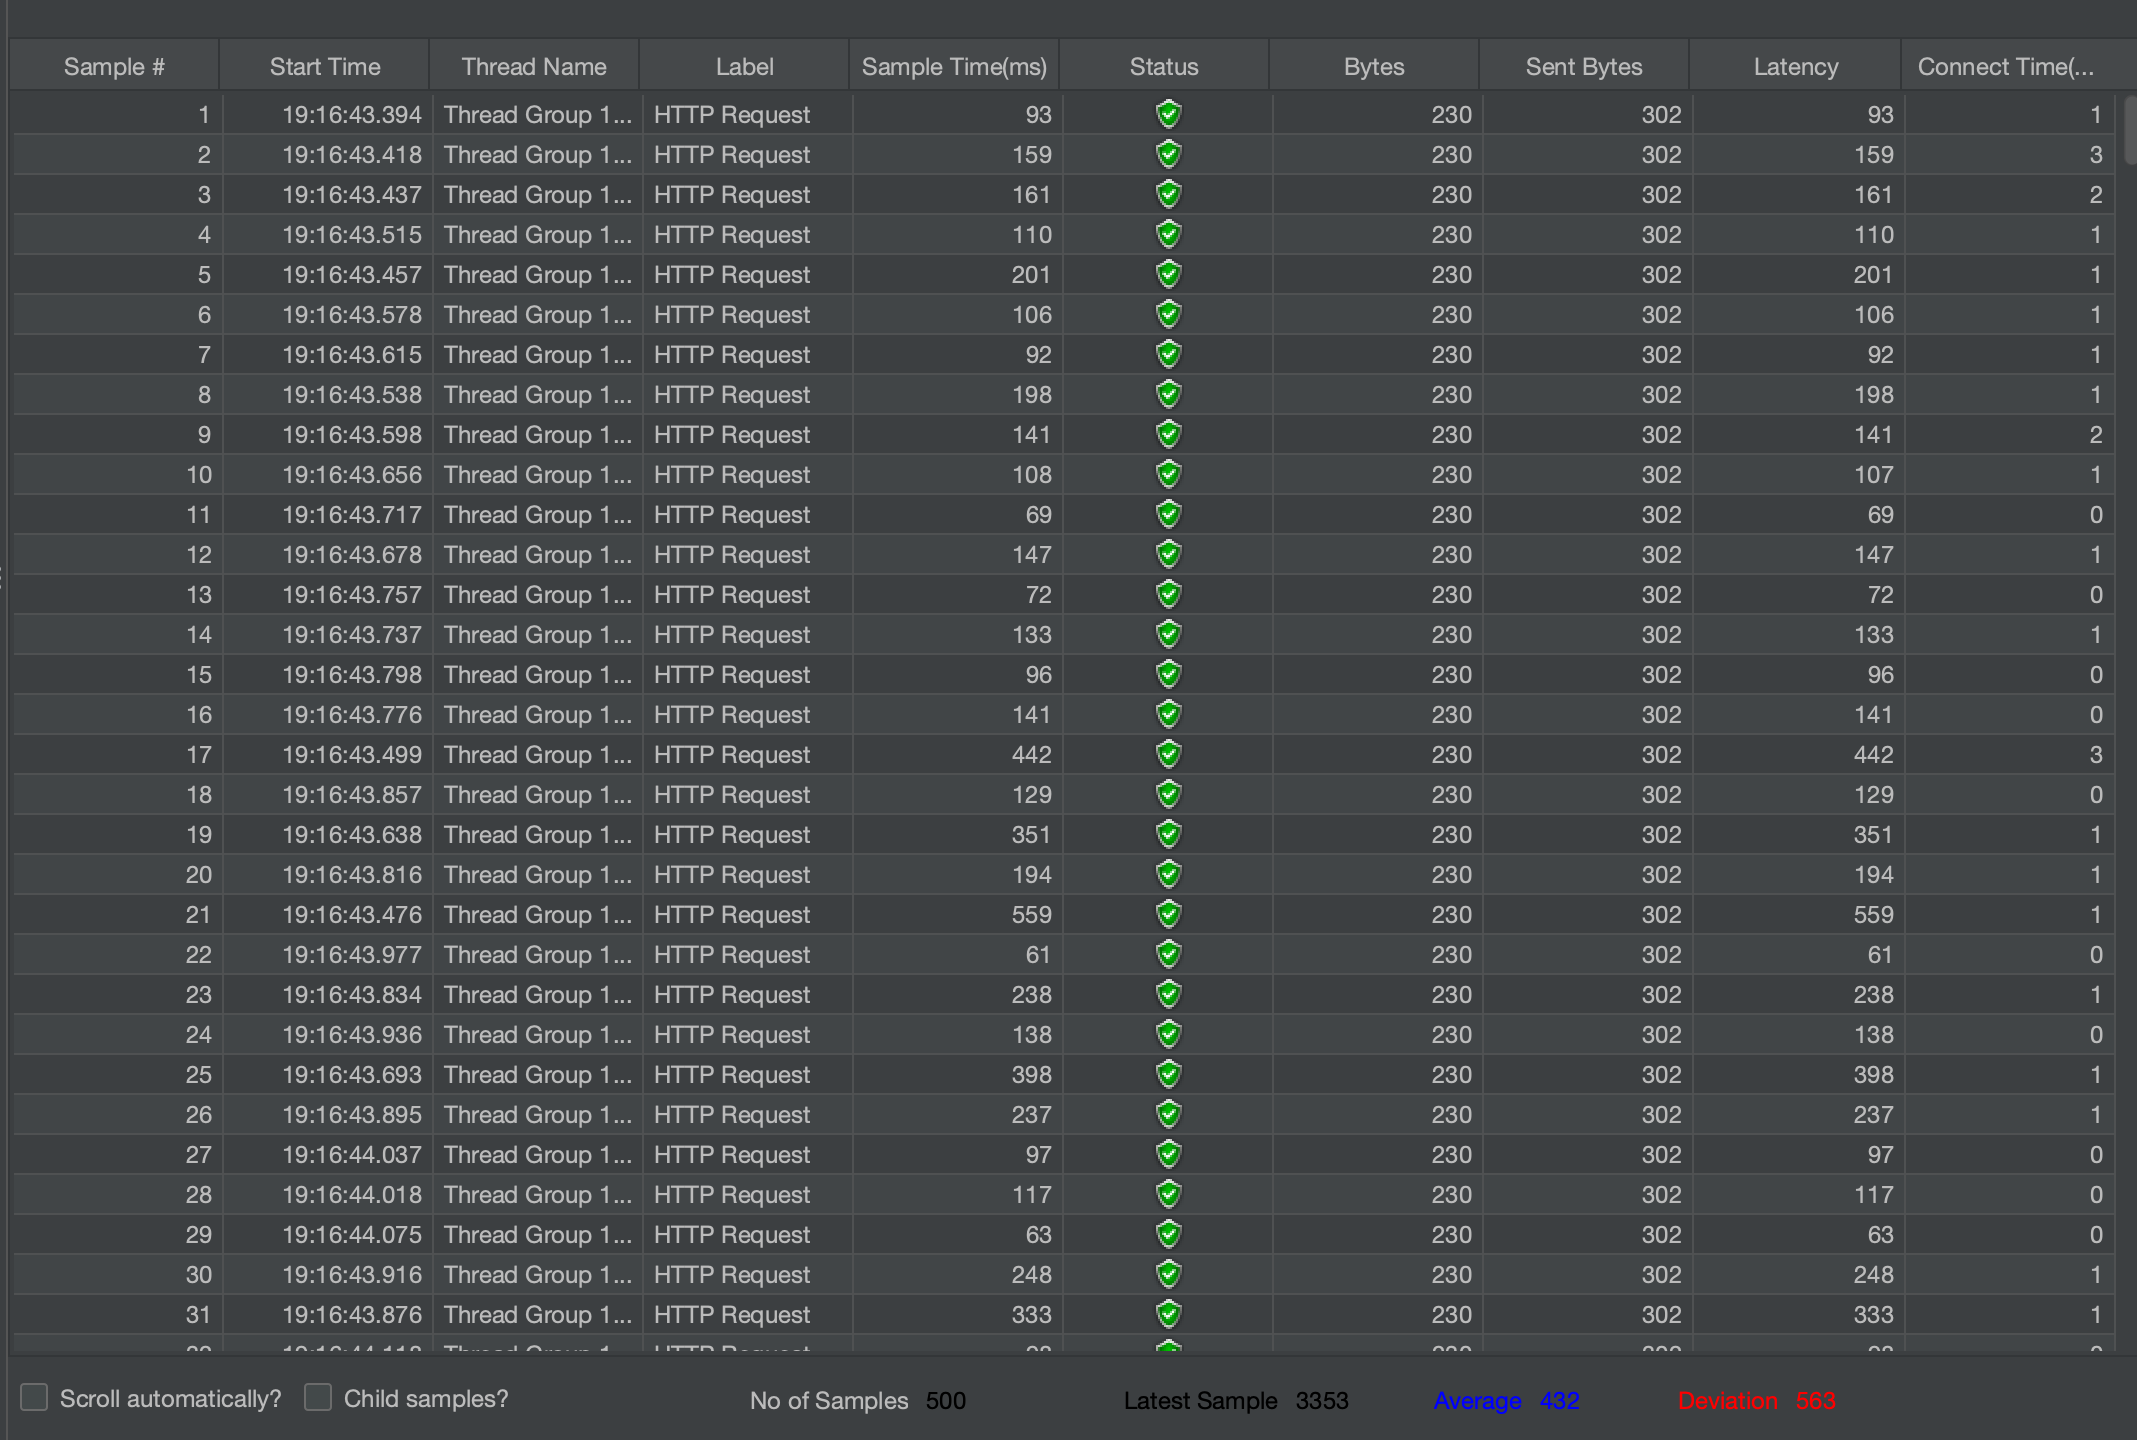
To increase the load,the results have also been captured for a test suit with 500 threads for every 10 seconds.
Results in Table
Jmeter Stress Testing results
We have tested Swishh with various number of threads (users) in order to understand its behavior under diverse loads, in curiosity to determine if the application is capable of handling huge number of end users, all at once. This ensures that if there are any bugs or any bottlenecks, they can resolved before actually delivering the application in production. Thus generated results, i.e., the response time for every request, have then been drawn into graphs.
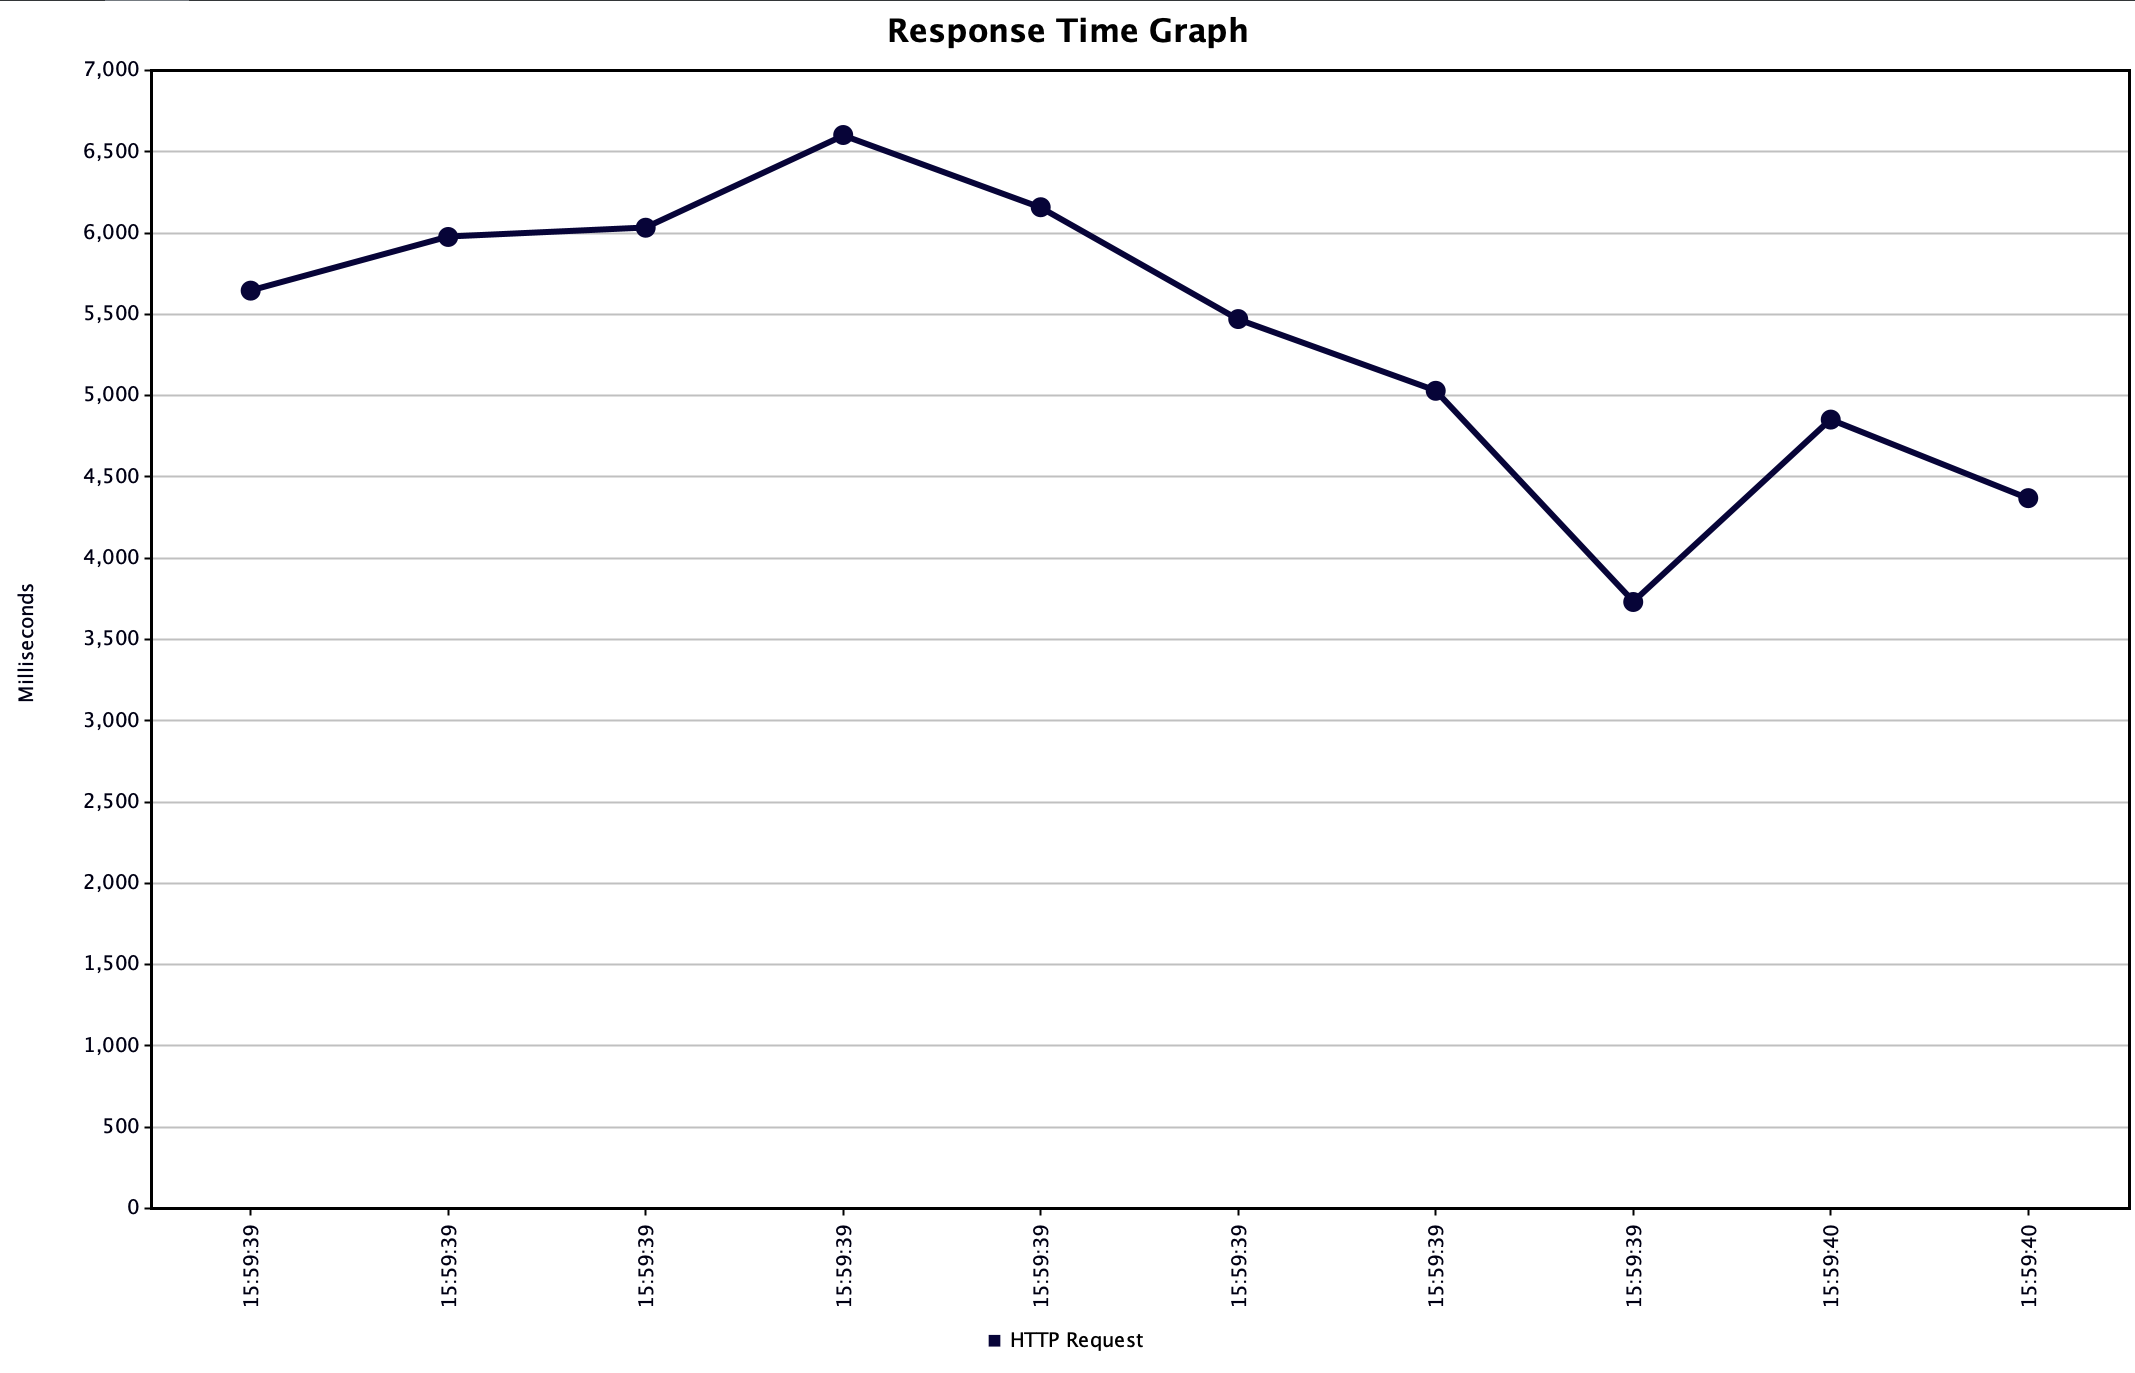
Number of users = 1000
Number of users = 10000
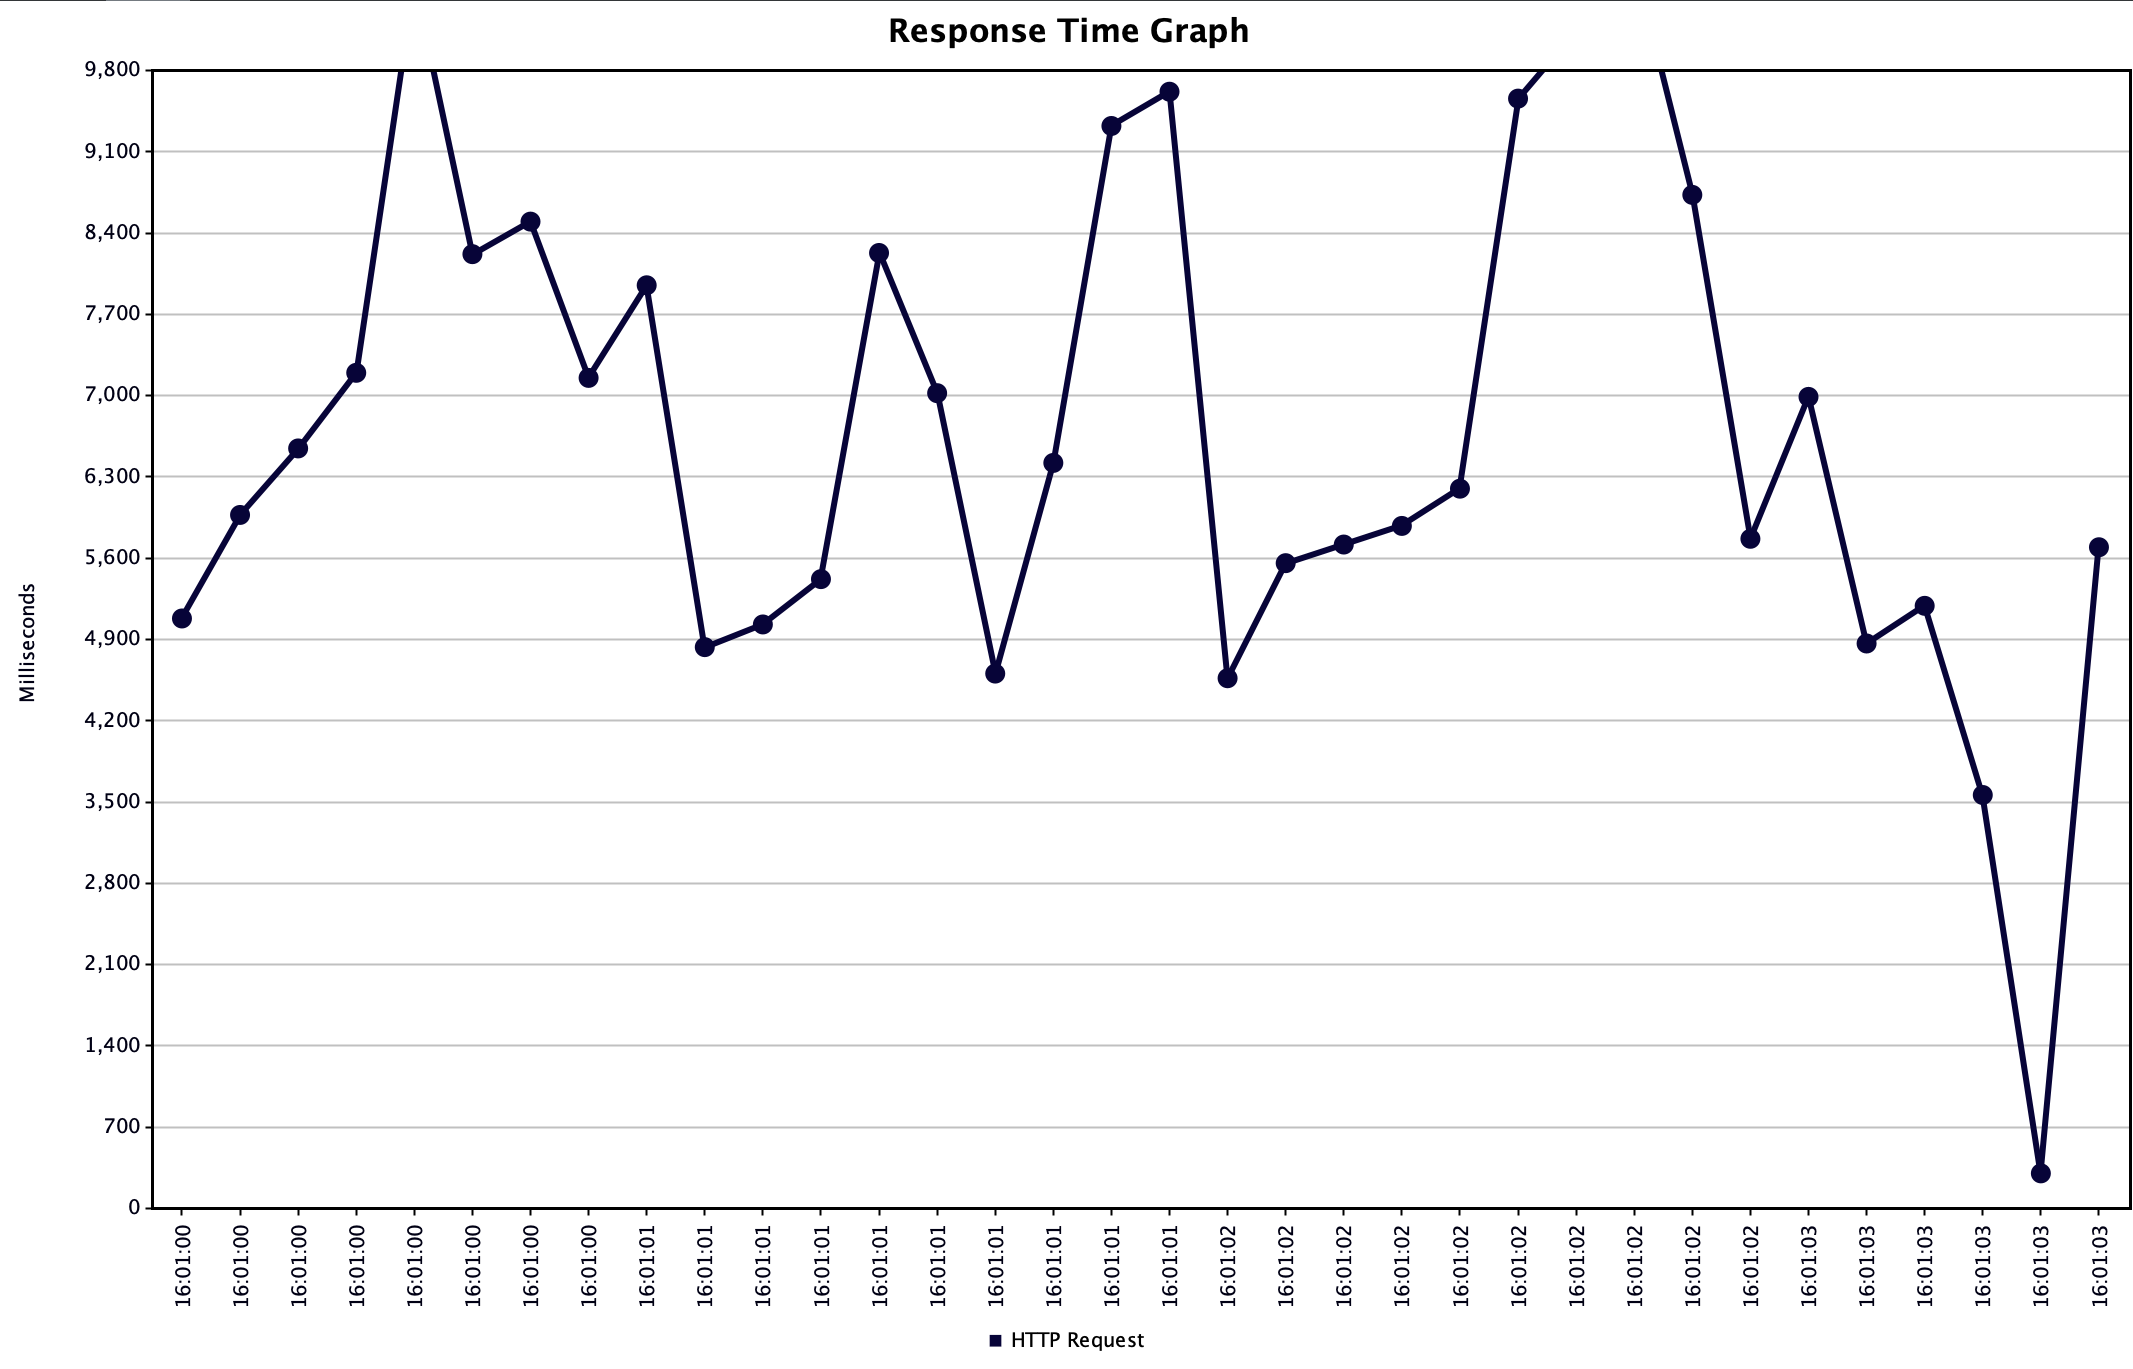
Observations:
- When the response time of the HTTP request calls is collected over a hundred users, it can be noticed that apart from a couple, there is almost a uniform response time for the HTTP Request. On the other hand, when the number of users is 10000, the response time is not consistent, it increases and suddenly drops. This can also imply that when the number of users is incredibly high, there could be very few requests that might possess delayed response.
- When the number of samples reach in the range 2700-2800 and the number of threads per second is 2500, the tests are ceasing to run. This can be understood as the maximum capacity of the distributed systems.(GUI Mode)
This is a capture of the successful results for 2500 threads per second. When this number is increased, the systems fails to run.
- In order to improve the spike testing results, one can choose to perform tests in a non GUI mode from the command line or also minimize the number of listeners to optimize the testing suite.