Overfitting and Underfitting - agastya2002/IECSE-ML-Winter-2020 GitHub Wiki
Overfitting and Underfitting
To better understand the concepts of Underfitting and Overfitting, we will take the help of the following graphs-
Description of the Graphs:
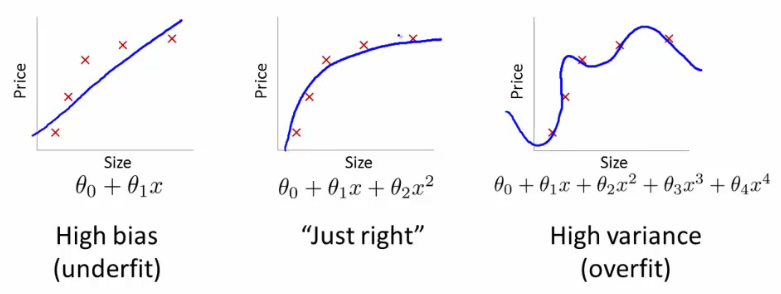
In each graph, the training examples are plotted using the red crosses and the regression line, that we get by training on the training set, is sketched in blue.
Underfitting
The first graph represents the problem of Underfitting. This condition is also described as the Machine Learning(ML)model suffering from High Bias. As we can see from the graph, the target values(y) rise and eventually plateau out as x increases. However, our model predicts a symmetric rise even for higher values of x. Therefore, the model is unable to perform well on the training set, and so we conclude, that it won't be able to perform well on unseen data. The problem of Underfitting arises as a result of our ML model being too simple in comparison to the data on which it is trained. In simple words, the model is not able to adequately learn the non-linearity of the data, due to it having features of lower powers than required to properly scale or learn the data. Like in our first example, we are using a linear model to learn data which can be represented as a horizontal asymptote, hence it is not able to learn the non- linearity in the data and so, performs poorly.
Overfitting
The third graph represents the problem of Overfitting. This condition is also described as the ML model suffering from High Variance. From the graph, we can see that the regression line accounts for all the training examples and performs excellently on the training set. This gives us the first impression that our model is well trained on the given data and will perform well on any unseen data. However, on testing such a model on unseen data, we see that it's performance is pretty bad. Such a condition arises when our model is very complex in comparison to the data we are training it on and we don't have enough data to train it on. The intuition is that since we are fitting such a high order polynomial on the data, along with an absence of the adequate amount of data, the hypothesis can fit any function and as a result, the hypothesis becomes too variable, which arises due to a lack of data to constrain the hypothesis and adequately restrict the hypothesis to the function that somewhat(not completely like in overfitting) represents the data.
Just Right
The second graph represents the model being just right, neither suffering from high bias nor high variance.
Methods to prevent Underfitting
- Make the model more complex by adding polynomial features.
- Make the model more complex by adding more features.
Methods to prevent Overfitting
- Try using a smaller set of features.
- Use Regularization(You will study mode about this in the coming weeks)
- Try acquiring more Data.
Examples
Underfitting
https://github.com/agastya2002/IECSE-ML-Winter-2020/blob/main/Week%202/Under_f.ipynb
Overfitting
https://github.com/agastya2002/IECSE-ML-Winter-2020/blob/main/Week%202/Over_f.ipynb