tree2dot - adrasteian/tools GitHub Wiki
Over the years I have repeatedly needed to create docs and presentation material with representations of folder hierarchies. However I never found any tool that met my needs so I always ended up manually drawing the result, or screen-shotting a file navigator and manually marking up the result.
tree2dot is a small piece of python that you can point at a folder tree to generate a DOT-format file representing the folder structure. It has an extensive set of options to help automate common tasks (e.g. highlighting certain files, skipping folders, grouping folders etc.).
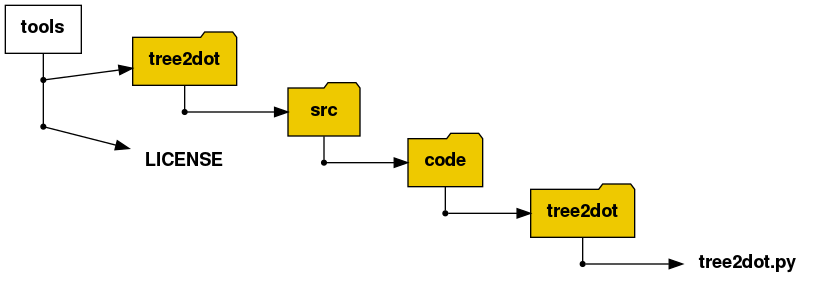
For example the following command pointed at this repo generates a DOT file ("tools.dot") of the entire folder structure:
tree2dot.py -t tools -o tools -f gold2
Next tools.dot can be converted to a .png file using this command:
dot -Tpng tools.dot -o tools.png
Here's the resultant graph:
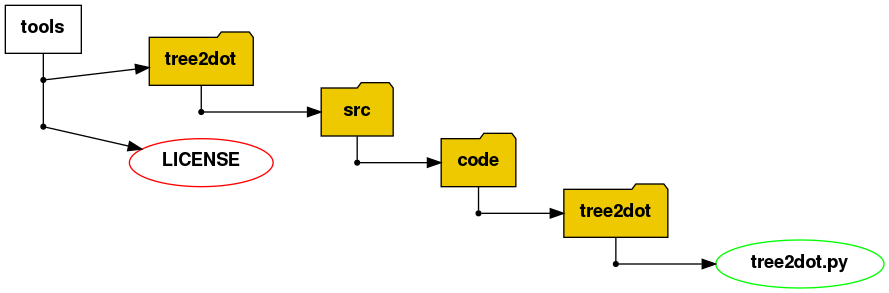
tree2dot has lots of fairly intuitive command line options so a good way to get the result you want is to improvise at the command line. For instance you can list files that you would like to highlight with a green ellipse like this:
tree2dot.py -t tools -o tools -f gold2 --greenfiles tree2dot.py,LICENSE
This command leads to the following graph:
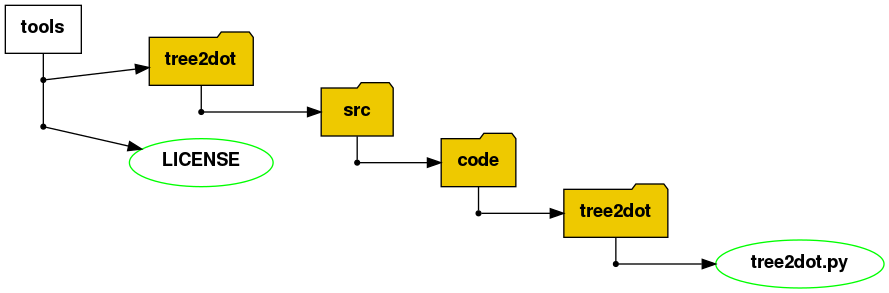
Or maybe you would like to highlight a problem with a file - use this:
tree2dot.py -t tools -o tools -f gold2 --greenfiles tree2dot.py --redfiles LICENSE
The "subgraphs" group of options let you specify lists of folders (along with their contents) to be highlighted in a common color:
tree2dot.py -t tools -o tools -f gold2 --greenfiles tree2dot.py --redfiles LICENSE --graysubgraphs tree2dot/src/code/tree2dot
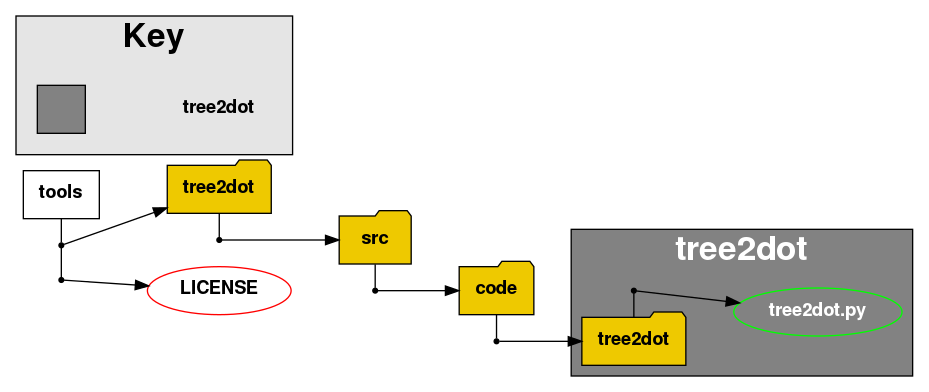
Notice that tree2dot also added a key box to the subgraph color - generally you will want to highlight more than one group of folders, the key provides a useful summary (ToDo: Option to provide label in key for corresponding color. Workaround is to manually edit the generated DOT, not difficult).
By default the fill color for the subgraph is a random shade of gray, and dark fill colors lead to an automatic switch in font color from black to white so that the text remains legible.
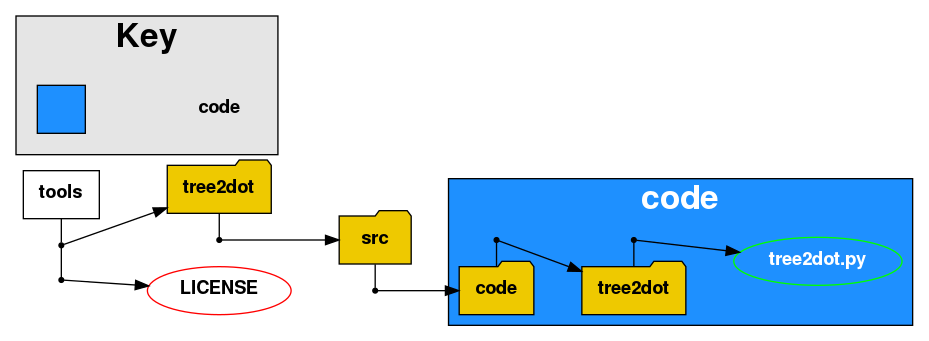
The filled subgraph box encloses everything in the folder that is specified. If you want to include more files/folder in your subgraph just specify a higher-level folder (we'll use blue this time):
tree2dot.py -t tools -o tools_04 -f gold2 --greenfiles tree2dot.py --redfiles LICENSE --bluesubgraphs tree2dot/src/code
The DOT sources for the earlier pictures have just been added to the tools repo so now the graph looks like this ("code" subgraph was changed to green with --greensubgraphs):
tree2dot.py -t tools -o tools -f gold2 --greenfiles tree2dot.py --redfiles LICENSE --greensubgraphs tree2dot/src/code
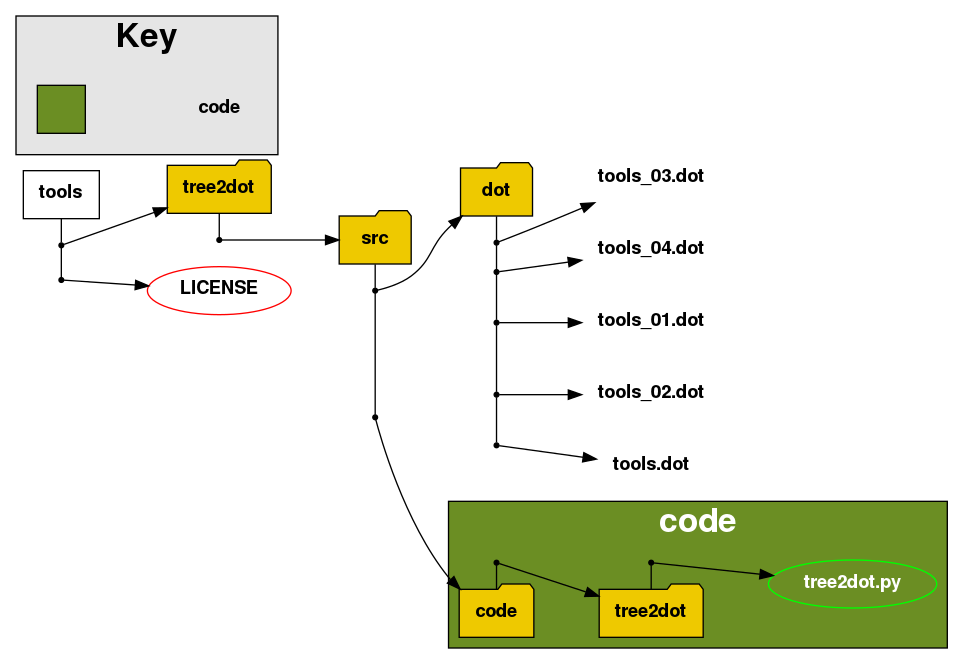
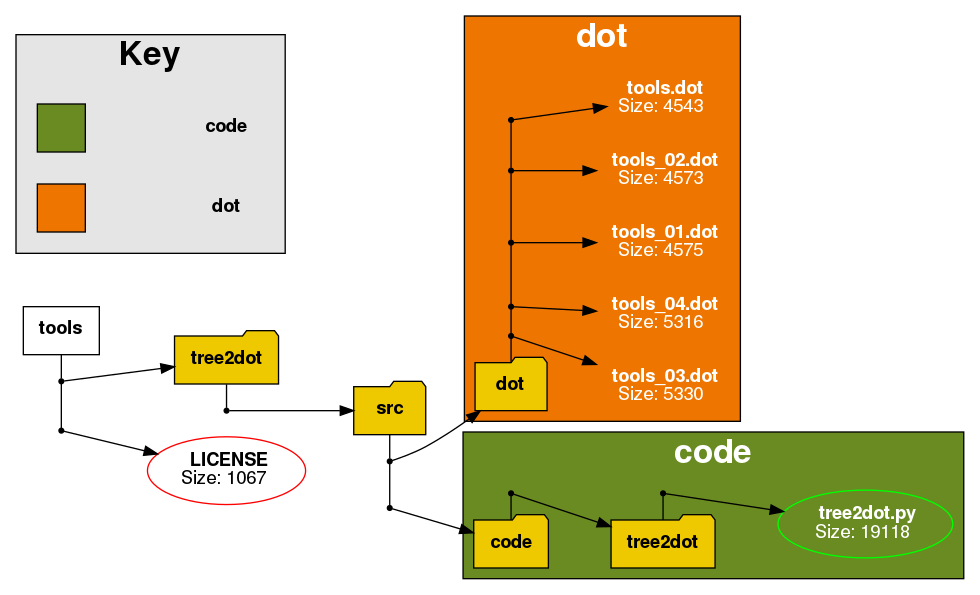
It's often useful to show the file size along with its name. The --size (or -s for short) option does this:
tree2dot.py -t tools -o tools -s -f gold2 --greenfiles tree2dot.py --redfiles LICENSE --greensubgraphs tree2dot/src/code --orangesubgraphs tree2dot/src/dot