Admin View Dashboard (Index page) - aditya1962/BuyGrand GitHub Wiki
Table of Contents
Basic Overview
The dashboard page is used as the homepage for the admin view. The page consists of two sections:
- Dashboard section-
Dashboard section is used to display stats required for the admin to forecasts the performance of the company.
Stats displayed as of v1.0.0 include:
- Number of users
- Number of sellers
- Number of items
- Number of categories
- Number of subcategories
- Number of orders
- Graphs section - Graphs section is used to display a ASP.NET Chart (line chart) for sales of the company for the last six months. As of v1.0.0 the number of months to which the sales is displayed is not filterable.
Data Processing Overview
The data processing workflow for this page is shown in the image below:
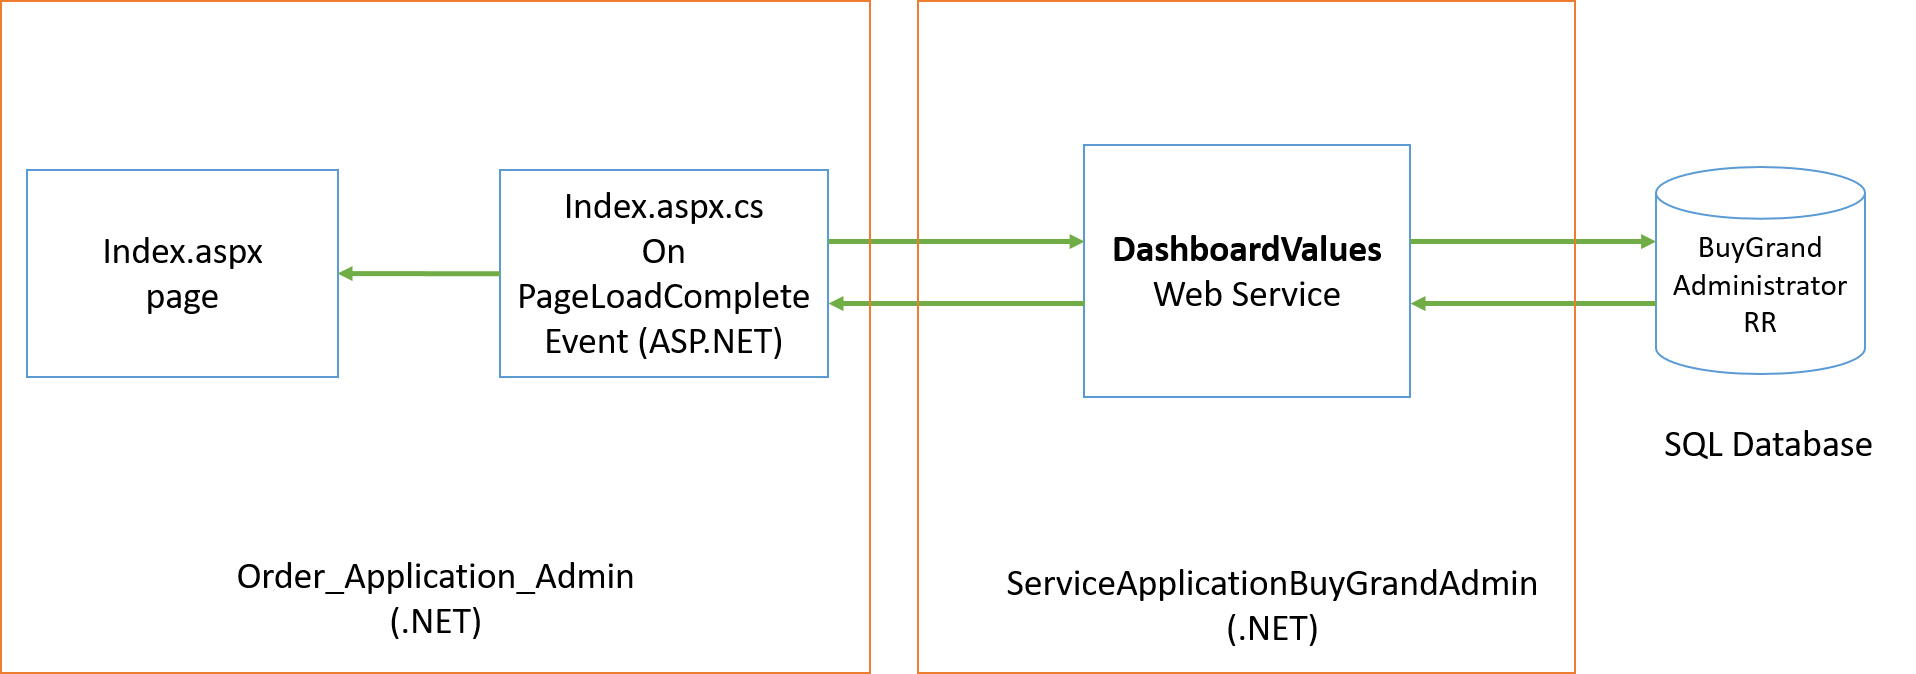
As shown on page load complete in the index.aspx page in the Admin view the page requests a web service in the ServiceApplication to send data required for the dashboard and the chart. It in turn requests the Read Replica database to send data using stored procedures. The Read Replica database is used since only values are read from the database.
Features
- View dashboard
- View sales in chart