Execution Screenshots - adarrivi/hidden-data GitHub Wiki
Let me show you the project execution step by step:
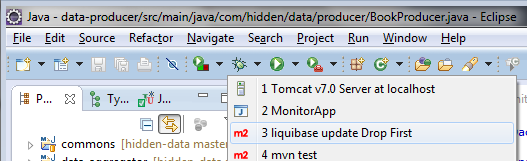
- Database creation using Liquibase and maven:
- Start the Data Monitor to have access to all the processes and start them. We will click on:
- Load Library: to load all the books
- Start Producer: to create the packages to be filtered. These packages will be stored in a queue
- Start Consumer: to start consuming the packages from the queue and filter the ones who match the pattern.
- Aggregate Data: to aggregate some data to the filtered packages.
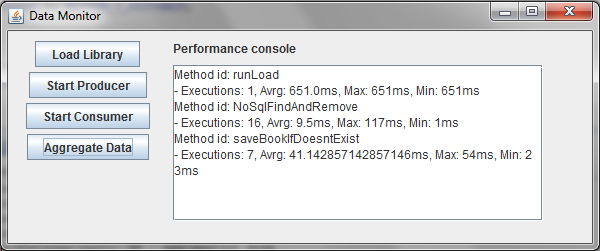
You can see in the Performance Console then number of executions, min, max and avg execution times for several methods. This panel is updated every second.
-
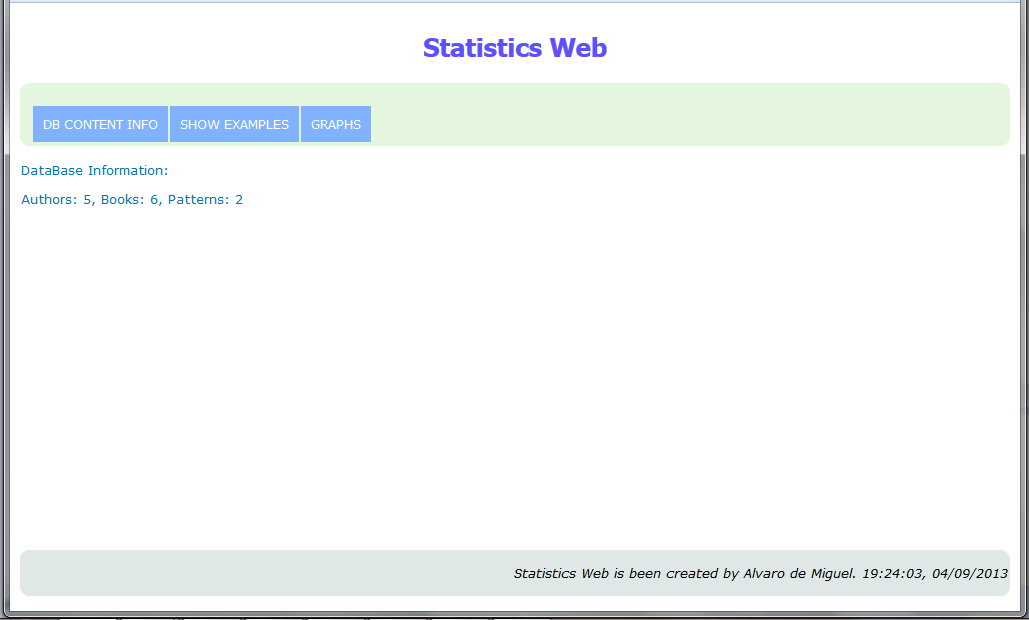
Access to the web page, where you can see:
-
Information about the data stored in the database
-
Chart showing the number of patterns found per book:
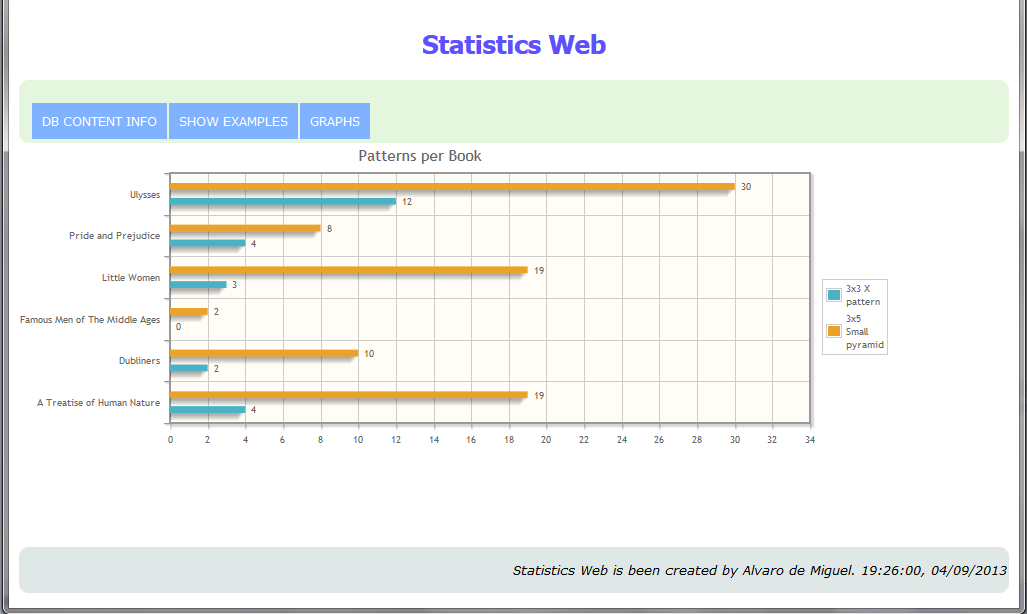
-
Chart showing the pattern distribution per pook:
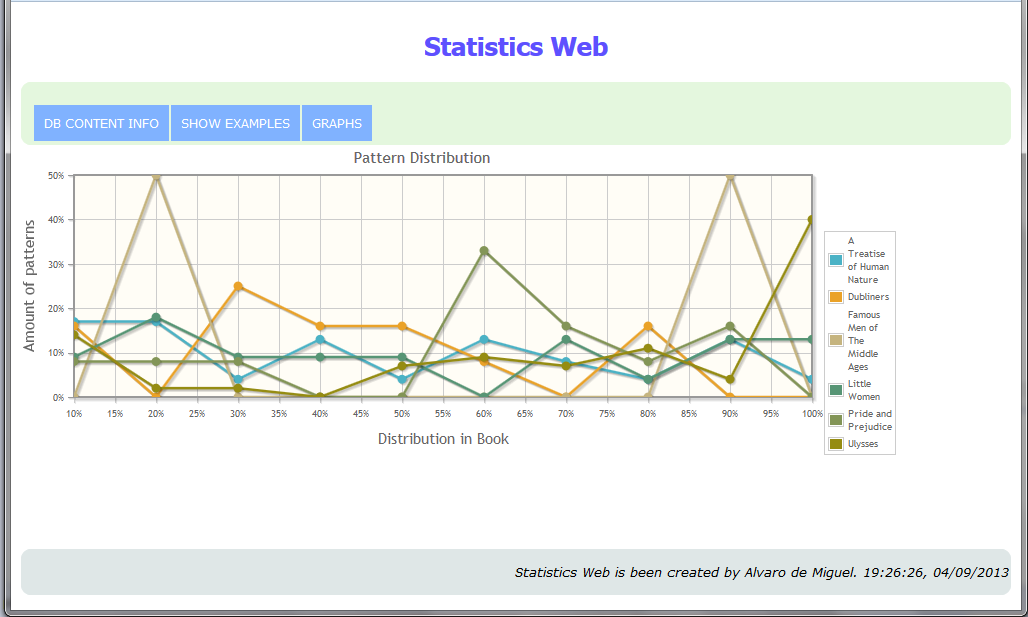
-
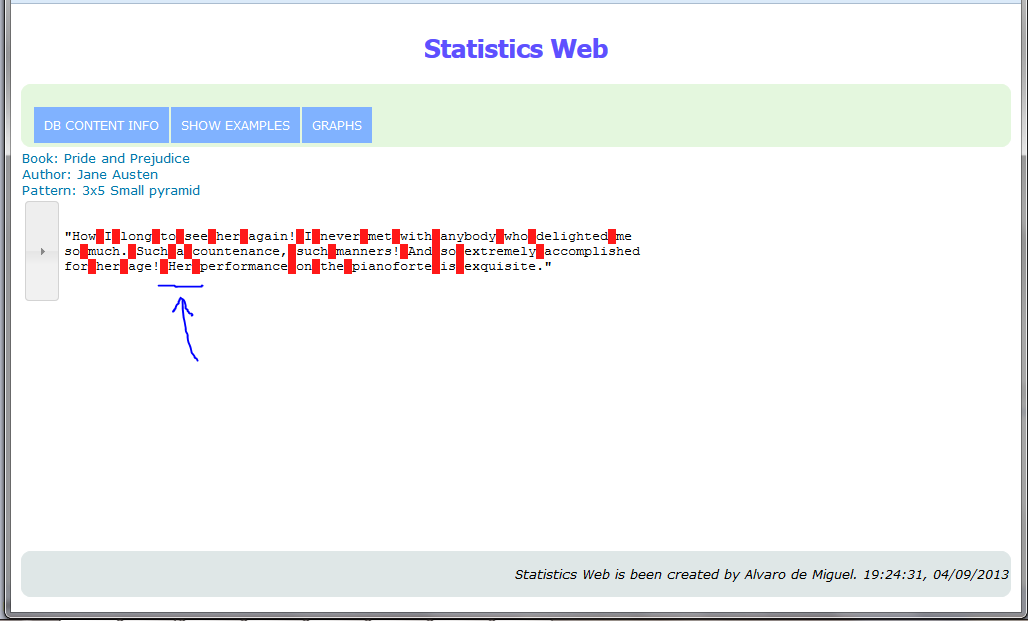
Highlighted samples of random patterns found: