Debugging Tips - adamfoneil/Dapper.QX GitHub Wiki
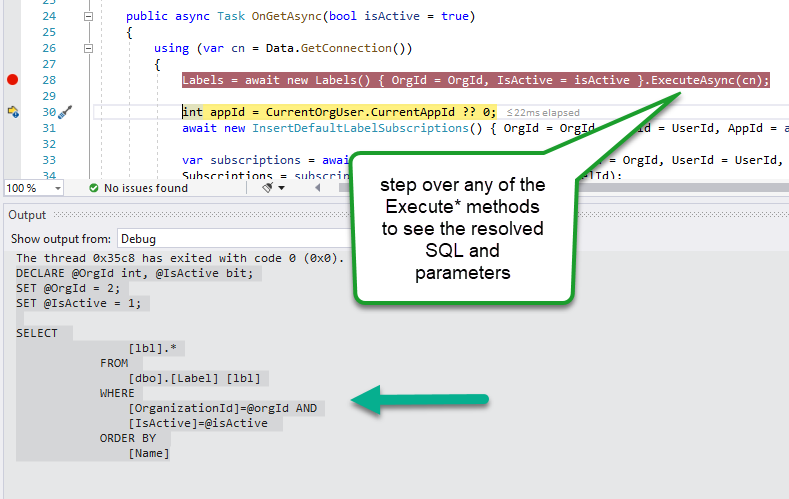
There are four ways to get the SQL resolved from a query. The simplest is to set a breakpoint on any of the Execute* methods, then step over it in break mode. Look in the Output window, and you'll see the resolved SQL and its related parameters. (Note on IN-style array parameters: As of version 1.0.9 int[] parameters supported, but not other types.)
There are several other ways that I did initially that are all a bit more complicated.
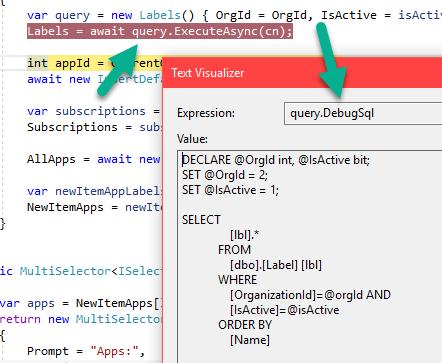
In this approach, you declare and execute a query on two separate lines, setting a breakpoint on any of the Execute* methods. Right after the method executes, inspect the ResolvedSql or DebugSql properties. The DebugSql property is meant to be copied and pasted into SSMS and run as it contains parameter declarations to make it immediately executable. The ResolvedSql property is the same thing minus the parameter declarations. Let's say you're starting with this line to execute a query called Labels. This is the simplest and most typical use, btw:
Labels = await new Labels() { OrgId = OrgId, IsActive = isActive }.ExecuteAsync(cn);Change this line to this:
var query = new Labels() { OrgId = OrgId, IsActive = isActive };
Labels = await query.ExecuteAsync(cn); // set breakpoint here
Now debug your application. When you hit your query breakpoint, inspect the query.DebugSql property. It will have the query and any parameters it uses. Copy and paste this into SSMS to see how it behaves.
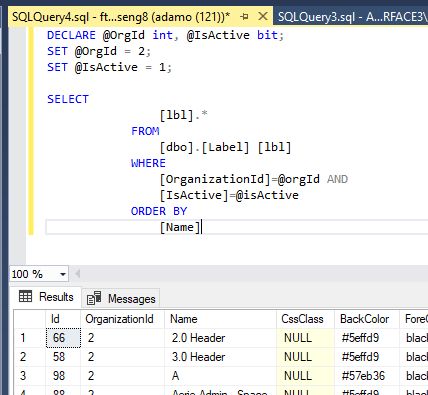
Copy and paste the contents of DebugSql into SSMS and run from there. Note that the whitespace/indents may be messed up because of how the text of your SQL is saved in your C# source file. Also note that some parameter types don't currently translate to this generated SQL. For example array parameters are not currently supported in DebugSql.
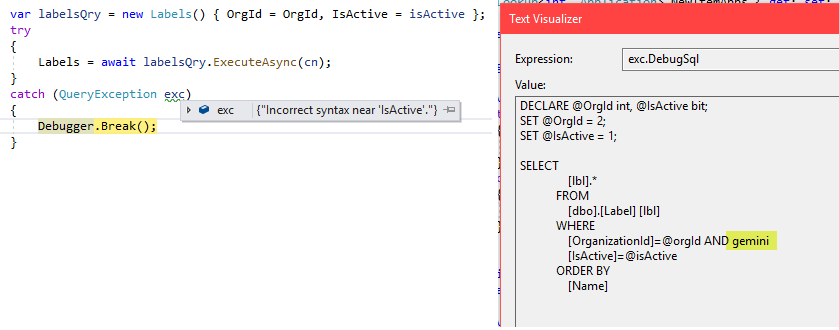
Note If incorrect SQL is causing an exception, write a try block to catch QueryException. It has a DebugSql property that you can inspect or paste into SSMS to see better what the problem is. In this example below, you can see I've entered some garbage text to cause this query to fail.
The Execute* methods all accept an optional List<QueryTrace> argument you can use to capture info about queries you're running. See QueryTrace to see what's captured. In addition to the DebugSql described above, the query duration and parameters are also captured. You can log or present trace data in your application to make troubleshooting easier. Here's what it looks like to capture traces:
var traces = new List<QueryTrace>();
Labels = await new Labels() { OrgId = OrgId, IsActive = isActive }.ExecuteAsync(cn, traces: traces);
In a real app, I suggest having a List<QueryTrace> instance property on your controller or page to log all queries together. Then, decide whether to present in your UI based on a developer account flag, for example.
If a Dapper method throws an exception, it's wrapped and thrown as a QueryException, which is mostly the same info as a QueryTrace minus the elapsed time.
If you want to implement a global logging approach to all your queries in an application, subclass Query<T> and override OnQueryExecuted and/or OnQueryExecutedAsync. Then use your subclass for all queries in place of Query<T>.