Manual - accarniel/FIFUS GitHub Wiki
The first screen of the application is shown in the following figure.
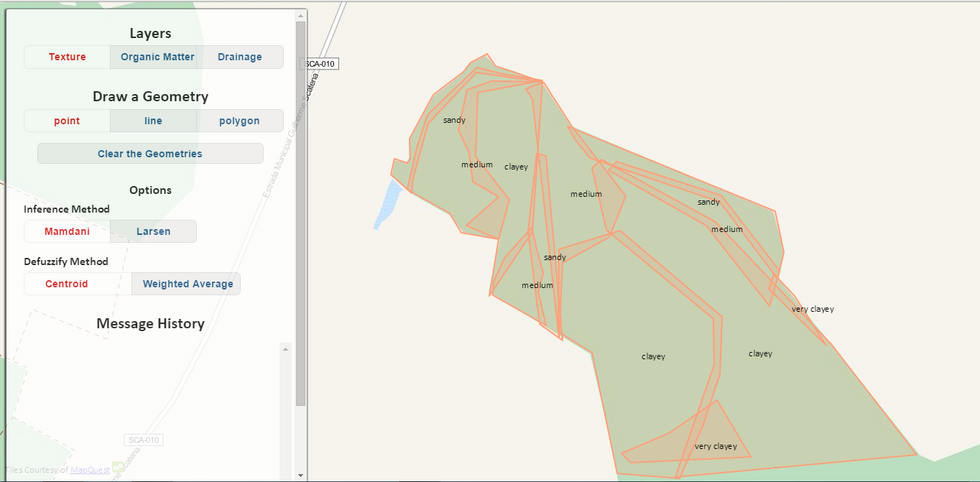
It has 2 main components: (i) a frame with several options (left side) and (ii) a map (right side). In the frame, the user is able to select the layer to be visualized in the screen, draw an input geometry object to be inferred by FIFUS, and set the fuzzy inference method option as well as the defuzzification method to be used in the inference process.
Note that the layers are the Fuzzy Spatial Antecedents (FSAs) and thus, are composed by fuzzy spatial objects. Further, they are overlapped, which represents transition zones. However, the user can select which layer he/she wants to see (in the previous figure the Texture was selected).
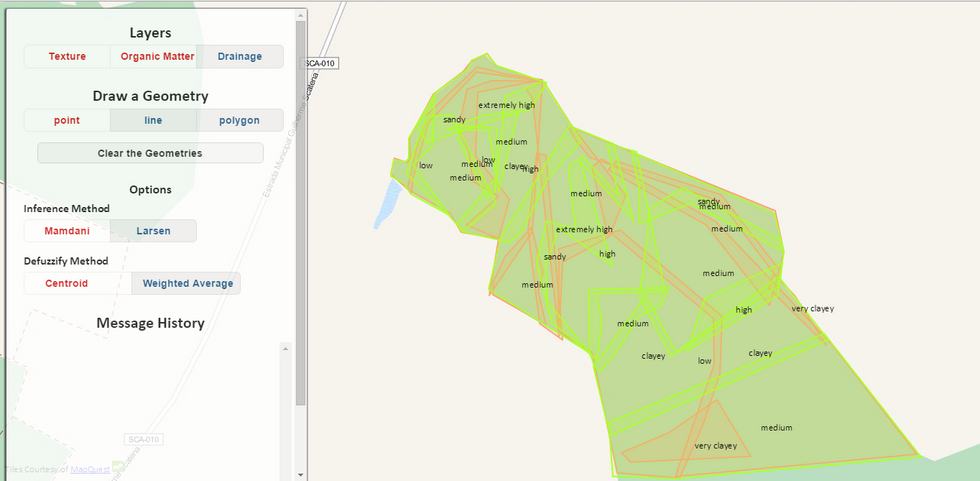
In the next figure, we click on the Organic Matter button in order to also visualize the fuzzy regions of the Organic Matter layer (in green). Note that they overlay with the fuzzy regions of the Texture layer (in red) since we are visualizing both of them.
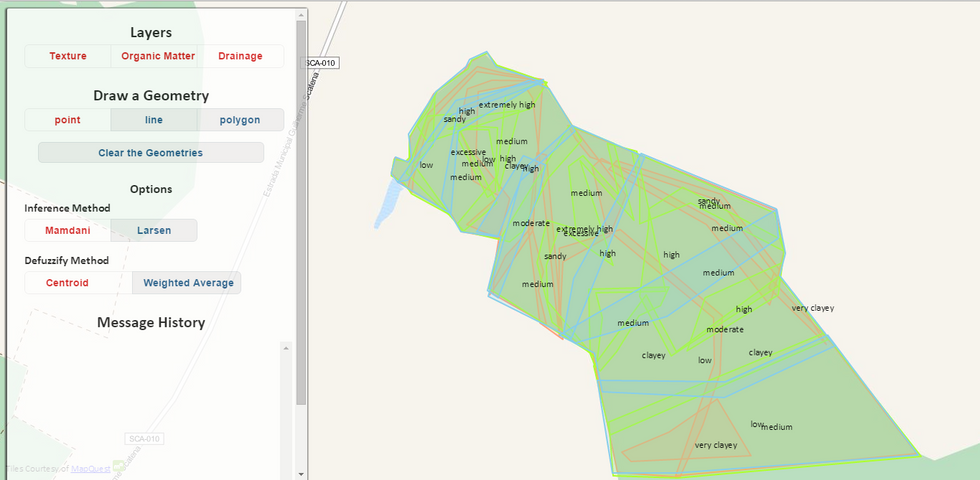
In the next figure, we click on the Drainage button with the objective to show the fuzzy regions of the Drainage layer (in blue). As a final result, we are visualizing all the layers (i.e., FSAs) of our application. However, the visualization can be a little bit confuse. Therefore, we are able to hide the visualization of any layer by simply clicking on them. In the next figures of this manual, we will hide the visualization of the Texture layer and the Organic Matter layer in the next figures.
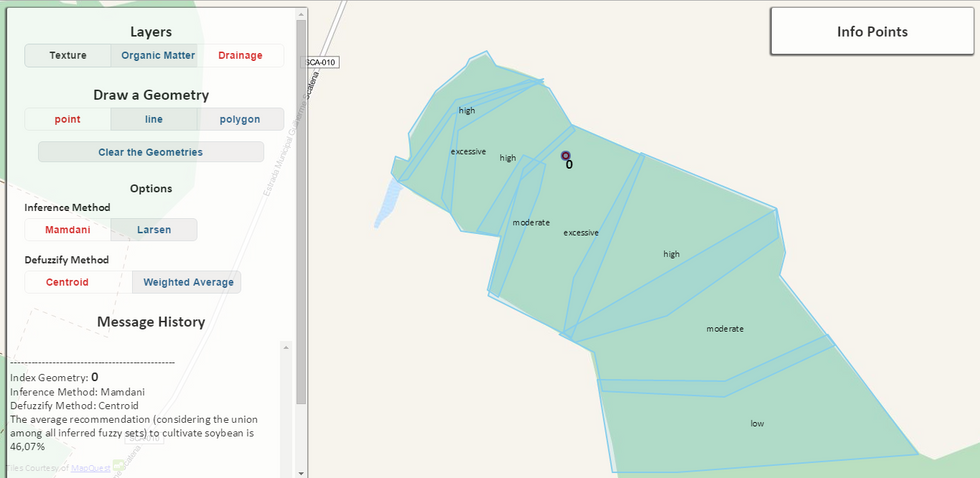
Until now, we know how to visualize all the layers of our application. Now, let's perform our first inference process by drawing a simple point. We can do this by clicking on the Point button in the Draw a Geometry area. The next step, is to click on any location inside of the fuzzy regions showed in the screen.
As a result, we will have a point in the map with an labeled inferred value that indicates the recommendation level to cultivate soybean at this point. This inferred value was obtained by using the FIFUS algorithm, that employed the Mamdani's inference and the centroid defuzzification method. Note that the Message History area (left side) is now updated with the information about this inferred point, which has 46.07% of the recommendation.
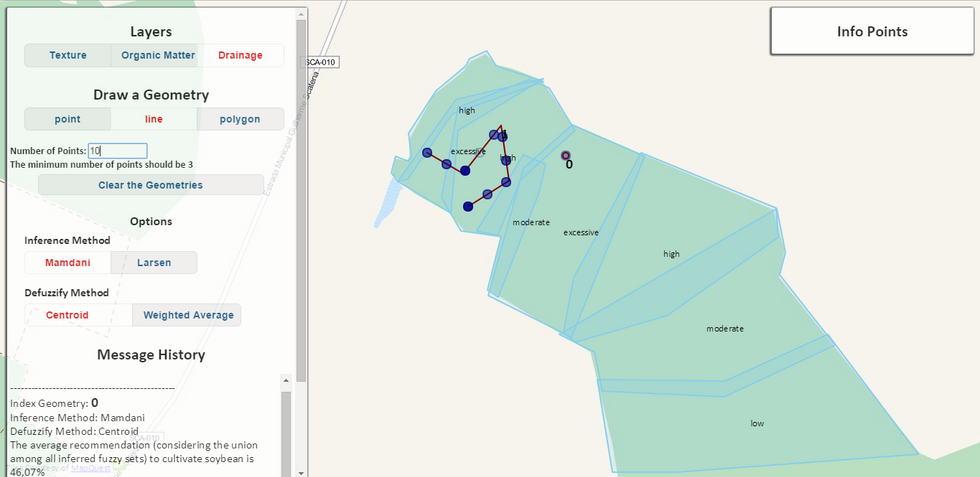
We are also able to draw lines in out application. We do this in the next figure by using the following stepd. First, we click on the Line button located in the Draw a Geometry area. Second, we click several times inside of the fuzzy regions in order to draw a line. Note that the sequential clicks will draw a line in the screen.
Since FIFUS discretize a line in a finite point, the user must inform the number of points that will be inferred from this line. This is done by informing the number of points in the corresponding box (left side). In the figure, the number of points was set to be 10.
The next step is done by the FIFUS, which will infer 10 points extracted from the drawn line. As a result, we will have 10 inferred values associated to these 10 points. We use a color scale to visualize the recommendation level of each point. This means that darker points means higher recommendation levels than lighter points.
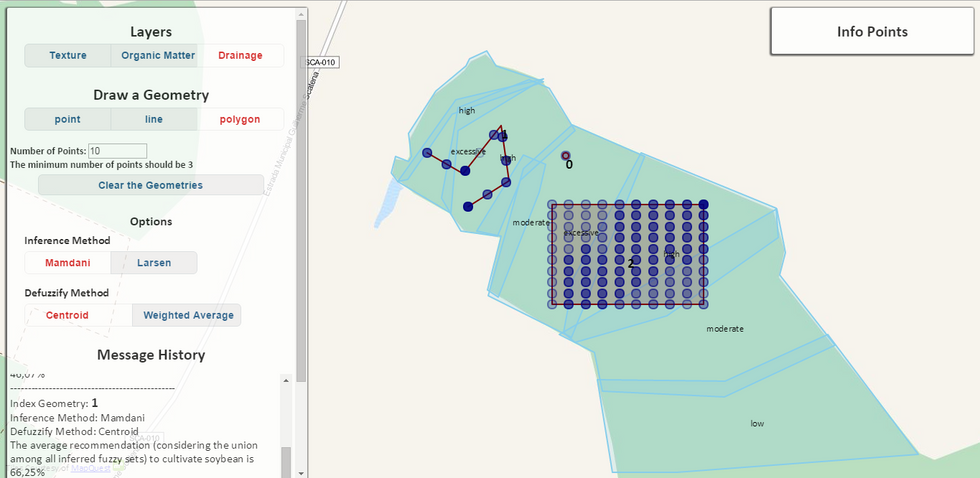
Now, in next figure, we draw a region (rectangle) to be inferred. This is done very similarly to the previous example. We first click on the Region button, and then inform the number of points to be considered. Finally, we draw a rectangle in the map by clicking, moving, and dropping the mouse click.
In the next figure, we draw a rectangle and we inform the number of points to be equal to 10. As a result, we will have 100 inferred values associated to these 100 points according to our discretization process. We also use a scale to visualize the recommendation level of each point.
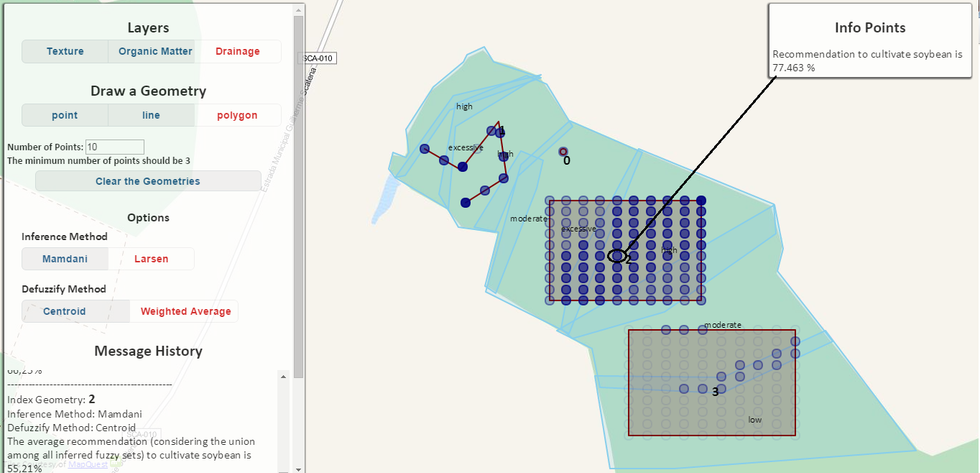
We are also able to draw other rectangles, lines, and points to be inferred by using the aforementioned steps. In the next figure, we draw another rectangle.
In addition, we are able to visualize the recommendation level of a specific point. This is done by moving the mouse pointer in a specific point and see its recommendation level at the righter top of the screen, in the "Info Points" frame. This process is shown in next figure.
Another option is to clear all the inferred points and geometries from the screen. This is done by clicking on the Clear the Geometries button.
Please, feel free to send us any question, suggestion, or request our source code of our work by the following email: accarniel at gmail.com.