OSQuery Project Documentation - Zacham17/my-tech-journal GitHub Wiki
Overview
OSQuery is an operating system instrumentation framework that uses tools to essentially expose an operating system as a database that can be navigated using SQL commands. SQL tables are used to represent different aspects of the operating system, such as running processes, users on the system, hardware events, system information, and much more. Osquery has different methods of implementation such as an interactive query console and a host-monitoring daemon.
Interactive Query Console:
The interactive query console for OSQuery can be accessed using the osqueryi command. The interactive query console provides an SQL interface where queries can be executed. From here, tables can be viewed and information can be queried from each table. The osqeuryi console can be useful for testing out queries, exploring the operating system, performing incident response, diagnosing a systems operations problem, troubleshooting a performance issue, etc.
Host-monitoring Daemon:
The host-monitoring daemon for OSQuery is called osqueryd. The osqueryd service can be run as a service on a system and can be used to log events and operating system information regularly. Osqueryd is a high level feature of OSQuery that allows for the scheduling of queries to be executed. The results of said queries are aggregated over time to generate logs that note changes in infrastructure and information on the system. The osqueryd service can also be integrated into other services and systems such as Wazuh to streamline the logging process for a more user-friendly experience.
OSQuery Installation on Web01:
I used the following steps to install OSQuery on my web01 host(Rocky Linux):
- Open Web01 to the Internet with a firewall rule. This allows the osquery package to be downloaded to web01 from the internet.:
Commands used:
set firewall name DMZ-to-WAN rule 999 action accept
set firewall name DMZ-to-WAN rule 999 source address 172.16.50.3
commit
save
-
Update yum utilities in order to be able to use the commands for the osquery install using
sudo yum install yum-utils -
Install osquery on web01 using curl and yum:
Commands used:
sudo curl -L https://pkg.osquery.io/rpm/GPG | sudo tee /etc/pki/rpm-gpg/RPM-GPG-KEY-osquery
sudo yum-config-manager --add-repo https://pkg.osquery.io/rpm/osquery-s3-rpm.repo
sudo yum-config-manager --enable osquery-s3-rpm-repo
sudo yum install osquery
Using osqueryi on Web01:
I experimented with the use of osqueryi commands and explored the operating system using SQL commands. I was able to view tables that contained various types of system information. Some tables contain events information, but in order to gather such information I had to run the osqueryi command with the --disable_events=false flag. This enabled event publishers for osqueryi.
Osqueryi commands
Below is a list of some commands and proper syntax for navigation and usage with the osqueryi tool.
.tableslists all the tables.schema TABLE_NAMElist the schema of a specified tablepragma table_info(TABLE_NAME);list details about specified table.helplists all available commands that can be run in osqueryi.exitleaves osqueryi mode
The syntax of an Osqueryi query command is SQL command syntax. An example is as follows:
SELECT [SELECTION] FROM [TABLE];where selection is a [column] of a table and [table] is the name of the table.
- Another argument that can be added is “WHERE”, which allows the specification of a certain field or value in a query.
Note: The semicolon at the end of the query is necessary in order for the command to be successful
Osqueryi Example Commands on Web01
Some osquery commands that I executed on web01 and screenshots of are shown below:
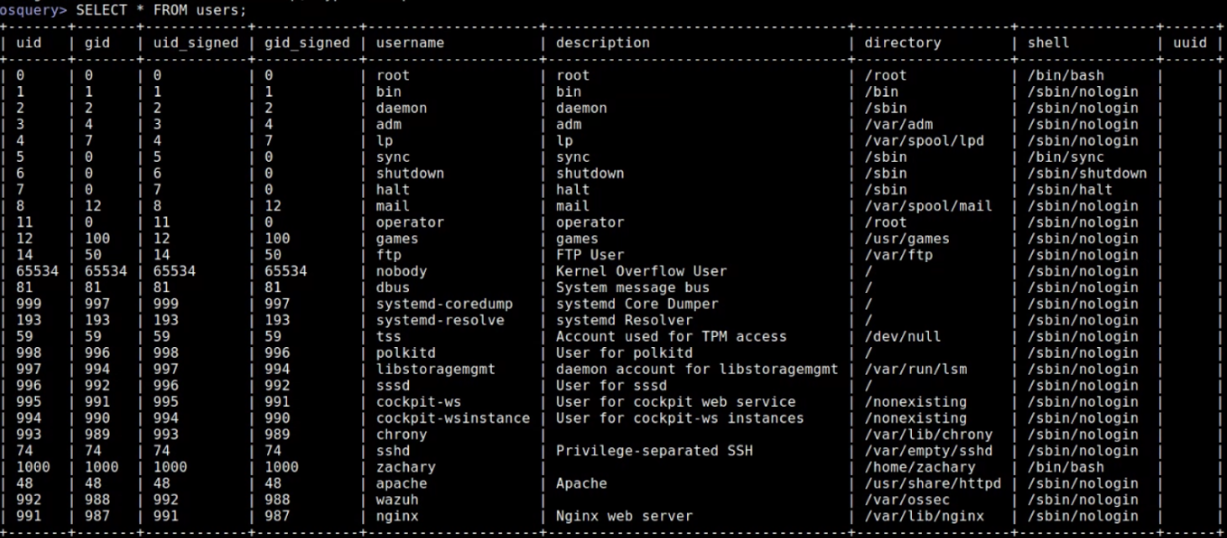
Command: SELECT * FROM users;
- Output: Shows all information in the users table
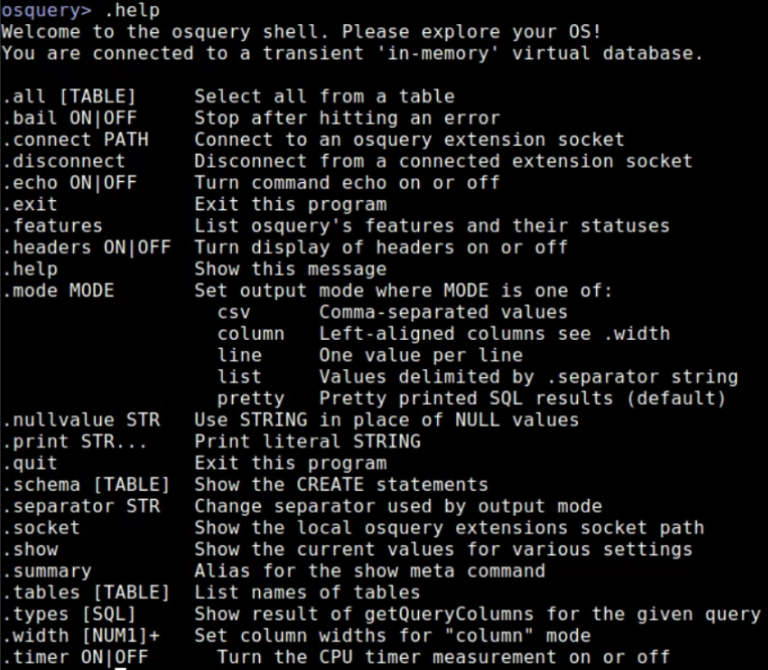
Command: .help
- Output: Shows all available commands
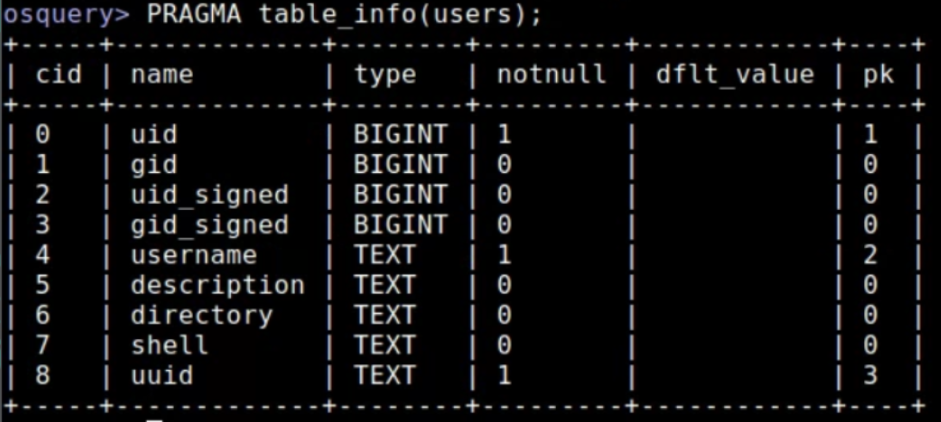
Command: PRAGMA tablie_info(users);
- Output: Shows the information fields and types in the users table.
Command: SELECT * FROM processes LIMIT 10
- The output for this command is quite lengthy. It shows the running process on the system. The “LIMIT 10” portion tells the command to only show 10 processes.
OSQuery Integration with Wazuh:
OSQuery can be integrated with Wazuh to show osquery logs in Wazuh. This works by having the wazuh agent run the osqueryd daemon service as a subprocess to report logs that will be displayed by Wazuh. To integrate OSQuery into Wazuh, configuration needs to be set for both osquery and wazuh.
For the osquery configuration, I added the following code to the “/etc/osquery/osquery.conf” file.
{
    "options": {
        "config_plugin": "filesystem",
        "logger_plugin": "filesystem",
        "utc": "true"
    },

    "schedule": {
        "system_info": {
        "query": "SELECT hostname, cpu_brand, physical_memory FROM system_info;",
        "interval": 60
        },
	"gb_free": {
        "query": "SELECT path, ROUND( (10e-10 * blocks_available * blocks_size), 1) AS gb_free, 100 - ROUND ((blocks_availabl$
        "interval": 30
        },
	"logged_in_users": {
        "query": "SELECT * FROM logged_in_users;",
        "interval": 10
        },
	"process_no_bin": {
        "query": "SELECT name, path, pid FROM processes WHERE on_disk = 0;",
        "interval": 30
        },
	"high_load_average": {
        "query": "SELECT period, average, '70%' AS 'threshold' FROM load_average WHERE period = '15m' AND average > '0.7';",
        "interval": 900,
        "description": "Report if load charge is over 70 percent."
        },
	"low_free_memory": {
        "query": "SELECT memory_total, memory_free, CAST(memory_free AS real) / memory_total AS memory_free_perc, '10%' AS th$
        "interval": 1800,
        "description": "Free RAM is under 10%."
        }
    },

    "packs": {
	"osquery-monitoring": "/opt/osquery/share/osquery/packs/osquery-monitoring.conf",
        "incident-response": "/opt/osquery/share/osquery/packs/incident-response.conf",
        "it-compliance": "/opt/osquery/share/osquery/packs/it-compliance.conf",
        "vuln-management": "/opt/osquery/share/osquery/packs/vuln-management.conf",
        "hardware-monitoring": "/opt/osquery/share/osquery/packs/hardware-monitoring.conf",
        "ossec-rootkit": "/opt/osquery/share/osquery/packs/ossec-rootkit.conf"
    }
}
This configuration file above specifies queries to perform in defined intervals. It also references different pre-set “packs” used by osquery for logging.
Alternatively to the configuration shown above, there is an example osquery configuration file provided by osquery located at /opt/osquery/share/osquery/osquery.example.conf
For the wazuh configuration, I edited the “Osquery Integration” section of the “/var/ossec/etc/ossec.conf” to be the following:
Ossec(Wazuh)Config:
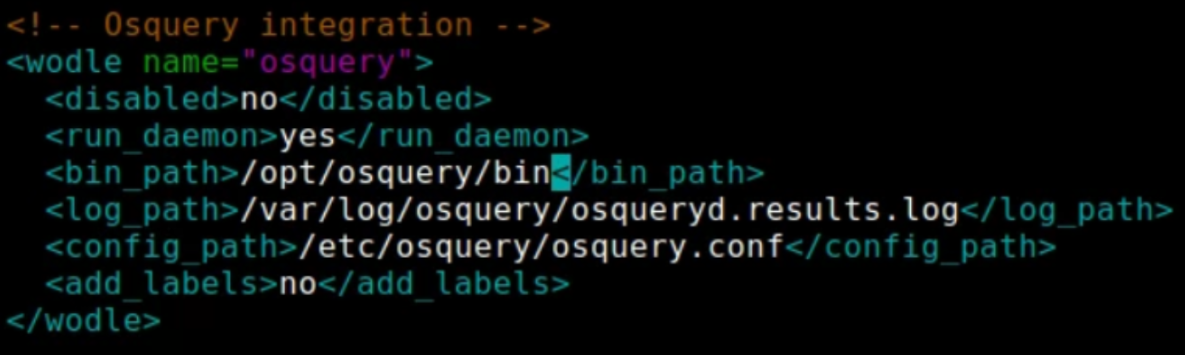
This configuration file above tells wazuh to enable osquery logging and to start the osquery daemon when the wazuh-agent is started.
To put the changes into effect, I restarted the wazuh-agent using systemctl restart wazuh-agent.
In the Wazuh dashboard, I enabled the Osquery Threat Detection and Response Module in Wazuh > Settings > Modules > Threat Detection and Response.
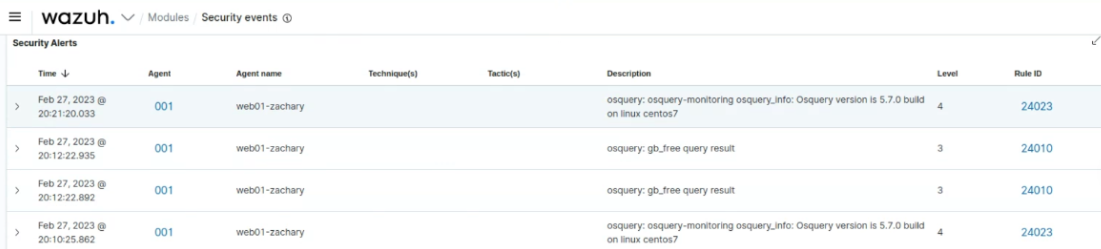
Osquery Logs then started appearing in Wazuh, as seen in the screenshots below:
Screenshot showing Osquery logs being recorded in Wazuh:
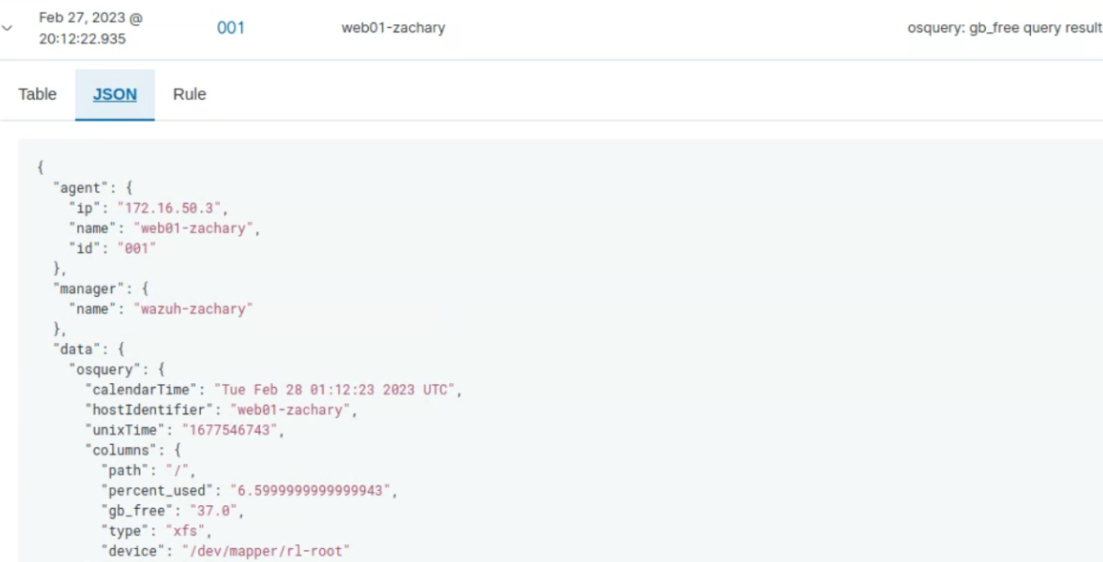
Screenshot showing contents of an Osquery log containing remaining free space on the system:
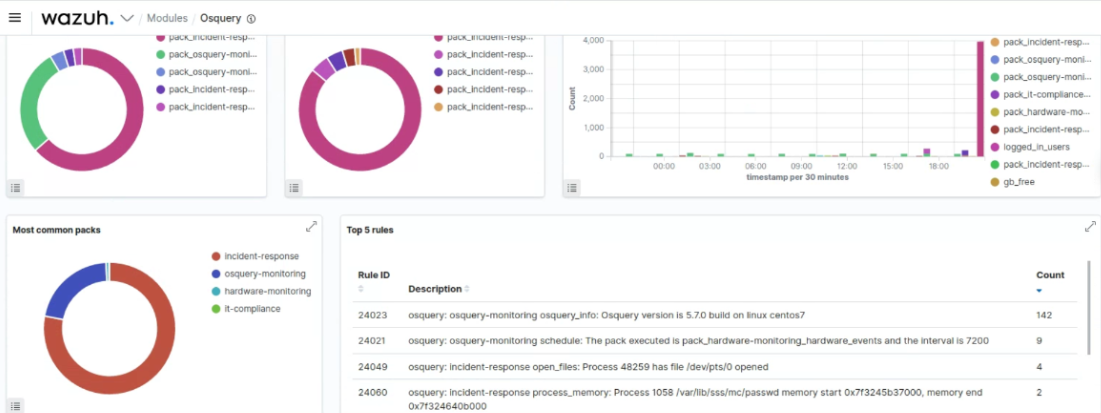
Screenshot showing the Osquery module interface in the Wazuh Manager:
Pros and Cons
Below is a table containing the Pros and Cons of Osquery
| Pros | Cons |
|---|---|
| Easy System Logging | May Encounter Performance Issues |
| Incident Response Events | Documentation not fully accurate |
| Easy Configuration | May miss events between queries |
| Easy SQL database navigation |
#Reference Links:
- https://www.uptycs.com/blog/osquery-what-it-is-how-it-works-and-how-to-use-it
- https://www.osquery.io/
- https://osquery.readthedocs.io/en/latest/
- https://www.youtube.com/watch?v=zT5RpPR7uhg
- https://osquery.readthedocs.io/en/latest/installation/install-linux/
- https://osquery.readthedocs.io/en/stable/introduction/using-osqueryi/
- https://hackertarget.com/osquery-linux-tutorial/
- https://unixcop.com/osquery-integration-with-wazuh/
- https://documentation.wazuh.com/current/user-manual/capabilities/osquery.html