Pie Chart - YunByungKwan/YBKChart GitHub Wiki
This page describes the usage and principles of the PieChart.

The following are precautions when using the PieChart.
- Set
layout_widthandlayout_heightequal. You will meet an exception if they are different. - Set specific values for width and height. For example,
layout_width="300dp"andlayout_height="300dp"
The simple usage is as follows.
activity_main.xml>
<androidx.constraintlayout.widget.ConstraintLayout xmlns:android="http://schemas.android.com/apk/res/android"
    xmlns:app="http://schemas.android.com/apk/res-auto"
    xmlns:tools="http://schemas.android.com/tools"
    android:layout_width="match_parent"
    android:layout_height="match_parent">

    <com.kwancorp.ybkchart.piechart.PieChart
        android:id="@+id/pieChart"
        android:layout_width="300dp"
        android:layout_height="300dp"
        app:layout_constraintBottom_toBottomOf="parent"
        app:layout_constraintEnd_toEndOf="parent"
        app:layout_constraintStart_toStartOf="parent"
        app:layout_constraintTop_toTopOf="parent" />

</androidx.constraintlayout.widget.ConstraintLayout>
MainActivity.kt>
class MainActivity : AppCompatActivity() {
    override fun onCreate(savedInstanceState: Bundle?) {
        super.onCreate(savedInstanceState)
        setContentView(R.layout.activity_main)

        val pieChart = findViewById<PieChart>(R.id.pieChart)
        val list = mutableListOf(
            Item("Java", 1F),
            Item("Kotlin", 1F),
            Item("Python", 1F),
            Item("C++", 1F),
            Item("C", 1F),
            Item("JavaScript", 1F),
            Item("CSS", 1F),
            Item("HTML", 2F)
        )
        pieChart.setItems(list)
        pieChart.setBorderWidth(2F)
        pieChart.setItemTextSize(25F)
        pieChart.setHeight(100F)
    }
}| Public methods | |
|---|---|
| Unit | setItems(list: MutableList) Set the item of the pie chart. |
| Unit | setCircleColor(color: Int) Set the color of PieChart's top face. |
| Unit | setSideColor(color: Int) Set the color of PieChart's side face. |
| Unit | setBorderWidth(stroke: Float) Set the width of PieChart's stroke. |
| Unit | setBorderColor(color: Int) Set the color of PieChart's border. |
| Unit | setItemTextSize(size: Float) Set the size of PieChart's text. |
| Unit | setItemTextColor(color: Int) Set the color of PieChart's text. |
| Unit | setHeight(pieHeight: Float) Set the height of PieChart. |
The process by which PieChart is shown on the screen is as follows.
- drawPieChart(canvas)
- drawSideOfPieChart(canvas)
- drawBottomBorderOfSideOfPieChart(canvas)
- fillSideOfPieChartWithArc(canvas)
- drawBorderOfSideOfPieChart(canvas)
- drawTopOfPieChart(canvas)
- fillTopOfPieChartWithArc(canvas)
- drawBorderOfTopOfPieChart(canvas)
- drawTextOfPieChart(canvas)
The process of being drawn
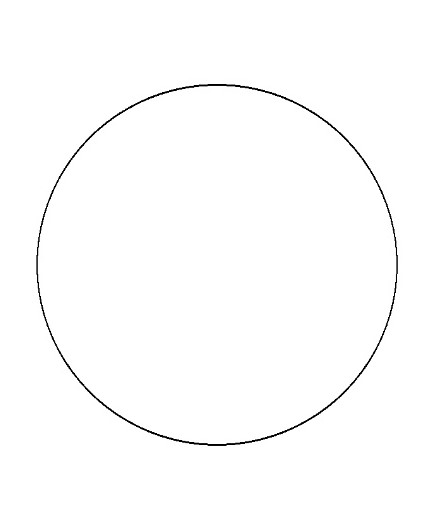
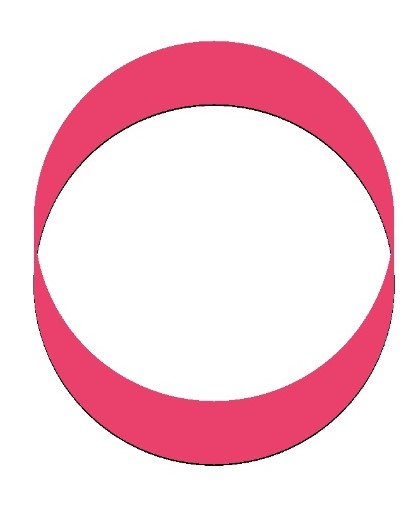
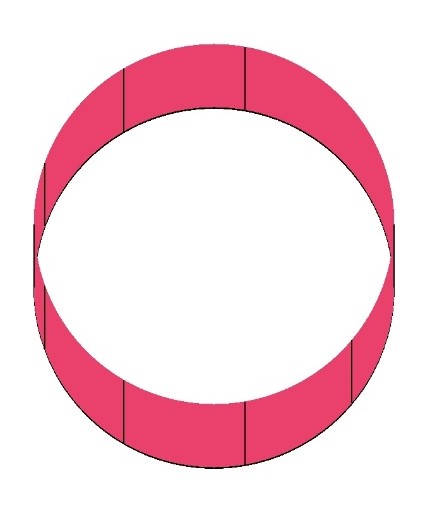
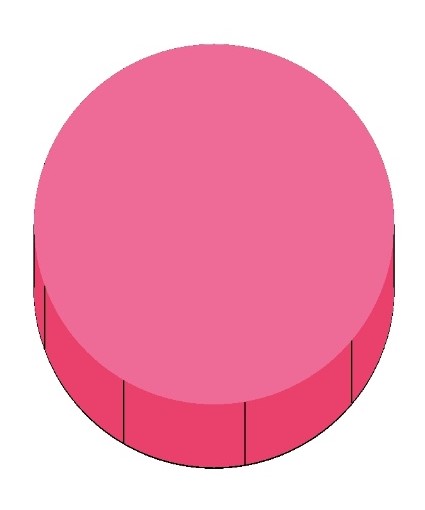
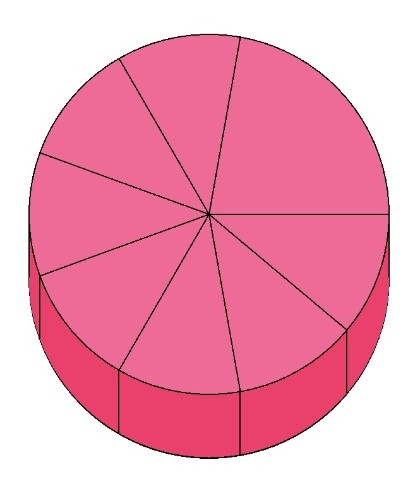
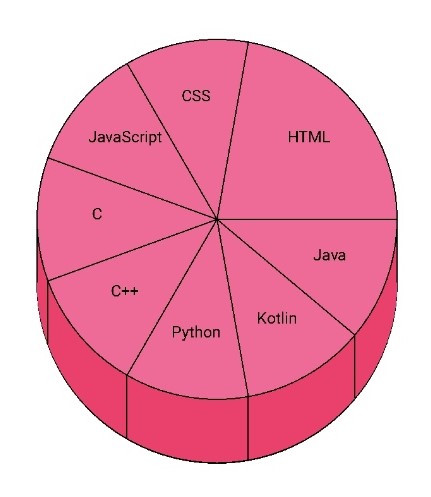
A little mathematical knowledge is used to draw the PieChart.
-
To find the coordinates of the text
val startX = centerX + (radius*2/3 * cos((offset + item.value/2) * Constants.RADIAN))
val startY = centerY + (radius*2/3 * sin((offset + item.value/2) * Constants.RADIAN))
-
To find the coordinates of the arc's endpoints.

The end point of the arc was obtained by solving the equation of ellipse and the equation of the first order function.
val alpha = offset * Constants.RADIAN
val beta = (offset + item.value) * Constants.RADIAN

val alphaSign = if(offset in 90.0..270.0) -1F else 1F
val betaSign = if(offset + item.value in 90.0..270.0) -1F else 1F

val sX1 = centerX + alphaSign * (1 / sqrt((1/(a * a)) + ((tan(alpha) * tan(alpha)) / (b * b))))
val sY1 = centerY + alphaSign * (tan(alpha) / sqrt((1/(a * a)) + ((tan(alpha) * tan(alpha)) / (b * b))))
val sX2 = centerX + betaSign * (1 / sqrt((1/(a * a)) + ((tan(beta) * tan(beta)) / (b * b))))
val sY2 = centerY + betaSign * (tan(beta) / sqrt((1/(a * a)) + ((tan(beta) * tan(beta)) / (b * b))))