Why ggtree is special? - YuLab-SMU/ggtree GitHub Wiki
Note: The ggtree wiki is no longer maintained, please use the following link instead!
https://yulab-smu.github.io/treedata-book/
ggtree innovations
Innovations of ggtree include:
- parsing data from a number of molecular evolution software
- not only for visualization in
ggtree, but also bring these data toRuser for further analysis (e.g. summarization, visualization, comparision, test)
- not only for visualization in
- viewing and annotating phylogenetic trees, programmatically in
R- the plot functions of other phylogenetic viewing
Rpackages are defined for special cases
- the plot functions of other phylogenetic viewing
- support grammar of graphics implemented in
ggplot2- only
ggtreesupports grammar of graphics for phylogenetic tree annotation - unlike other packages that define functions for specific cases with pre-defined style, functions implemented in
ggtreeare only building blocks to facilitate users to create their tree view - users have no restriction to annotate trees, even with their own data
- only
- two dimension tree
- re-scale y-axis to visualize the changes along branches
see user comments.
It's different from other tree viewers which mostly limit a user to pre-defined specific cases of tree views. ggtree doesn't define how annotation should be presented. Users have no restrictions on presenting data in their favorite way, and complex tree views can be achieved via multiple layers of annotation.
Extends ggplot2 Grammar of Graphics
The ggtree grammar extends ggplot2 which is widely used in biomedicine and ecology research. Many researchers in these fields are already familiar with the grammar of graphics.
There are several packages that implement tree viewers using ggplot2, including ggphylo, OutbreakTools and phyloseq.
Using ggplot2 can't guarantees that the grammar of graphics is supported. The ggtree fully supports the graphics grammar, while others only implement a limited tree viewer designed for a specific need.
Comparison to Other Packages
ggphylo
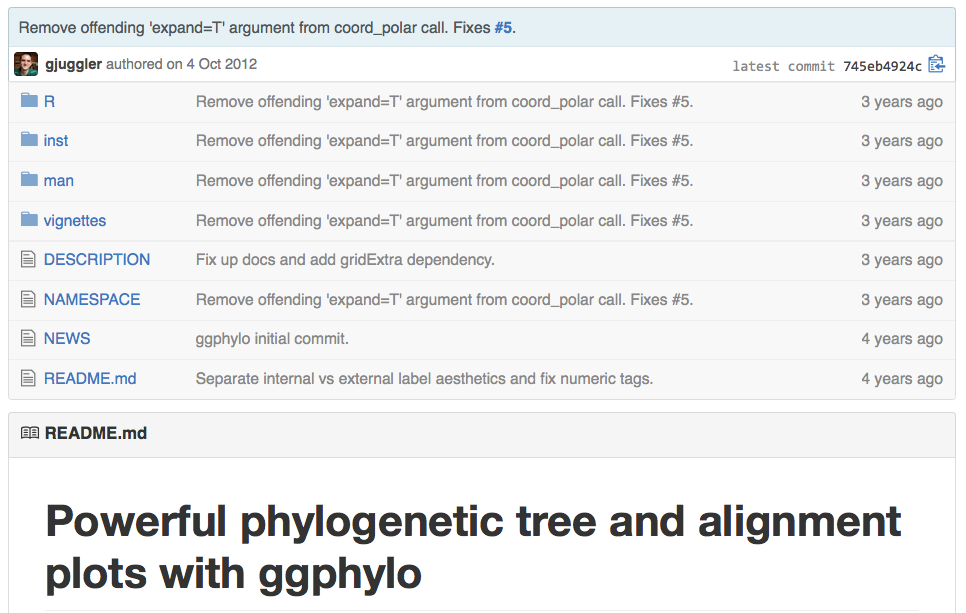
This package is designed for viewing phylogenetic tree with alignment. It has not updated since 2012, and the alignment part is not yet implemented.
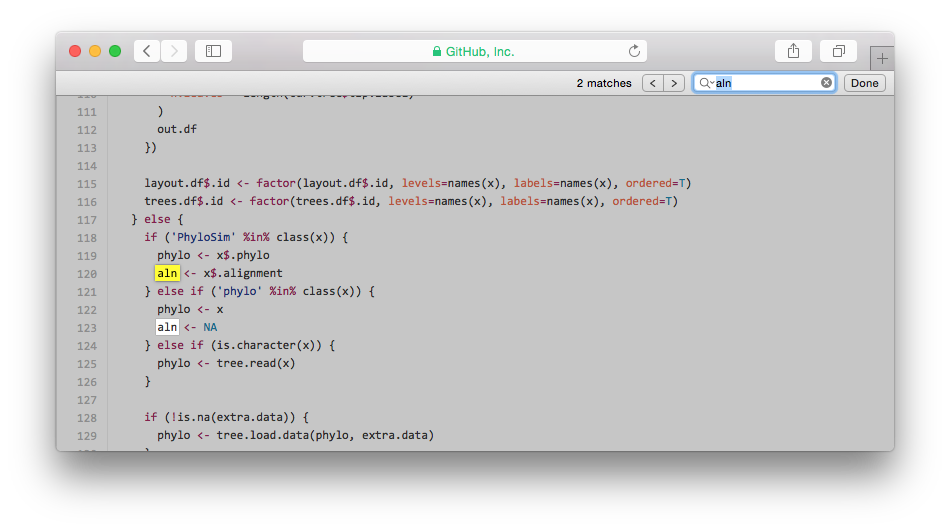
PS. Viewing phylogenetic tree with alignment is supported in
ggtree.
The way to view a tree in ggphylo is quite strictly pre-defined, yet with some parameters to control the view.
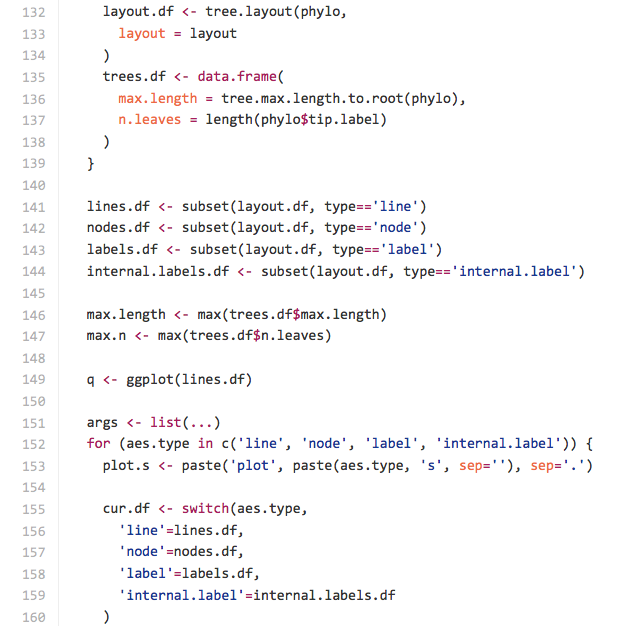
As shown in the screenshot, it created several data.frame and the tree was drawn by q <- ggplot(lines.df). ggphylo parses a tree as a collection of lines which is meaningless (information only related to taxa).
OutbreakTools
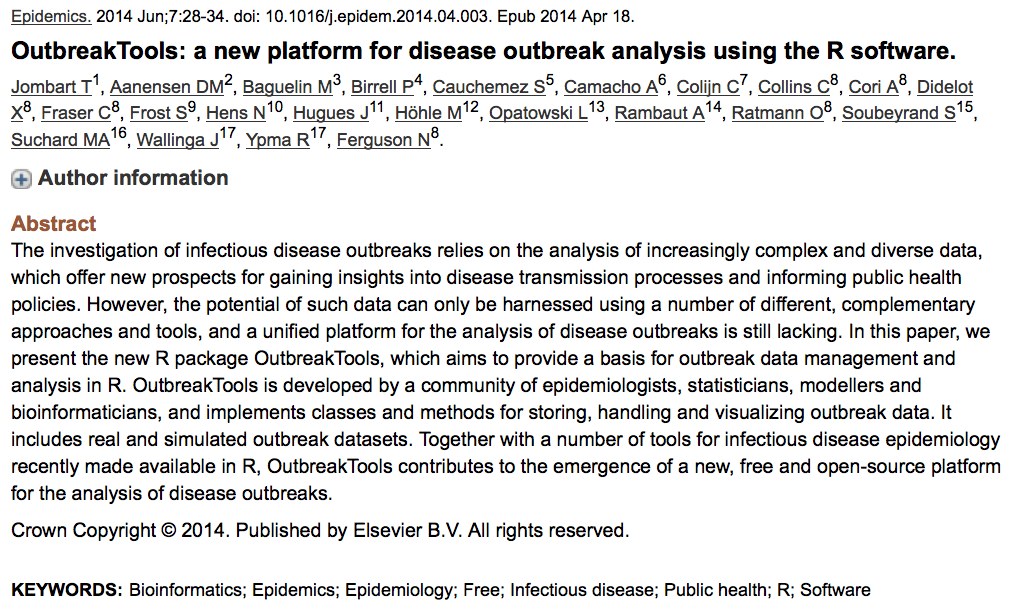
OutbreakTools is designed for disease outbreak analysis and viewing phylogenetic tree is not its major focus.
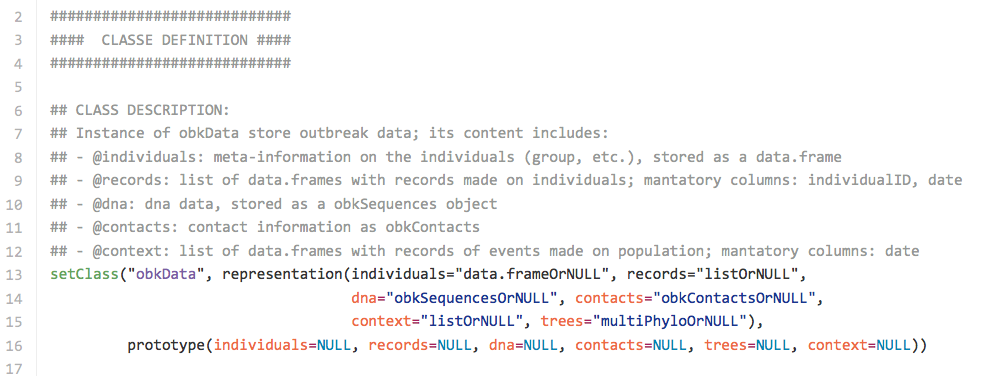
The tree view function plotggphy is only applicable to obkData class defined within this package. It cannot view the phylogenetic tree parsing from the newick file directly.
As shown in the screenshot, it has similar design with ggphylo that creates several data.frame and draws the tree via p <- ggplot(data=df.edge). It also parses a tree into a collection of lines.
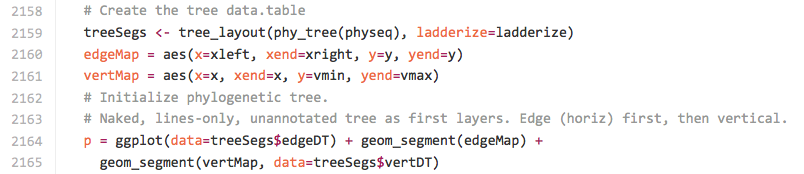
phyloseq
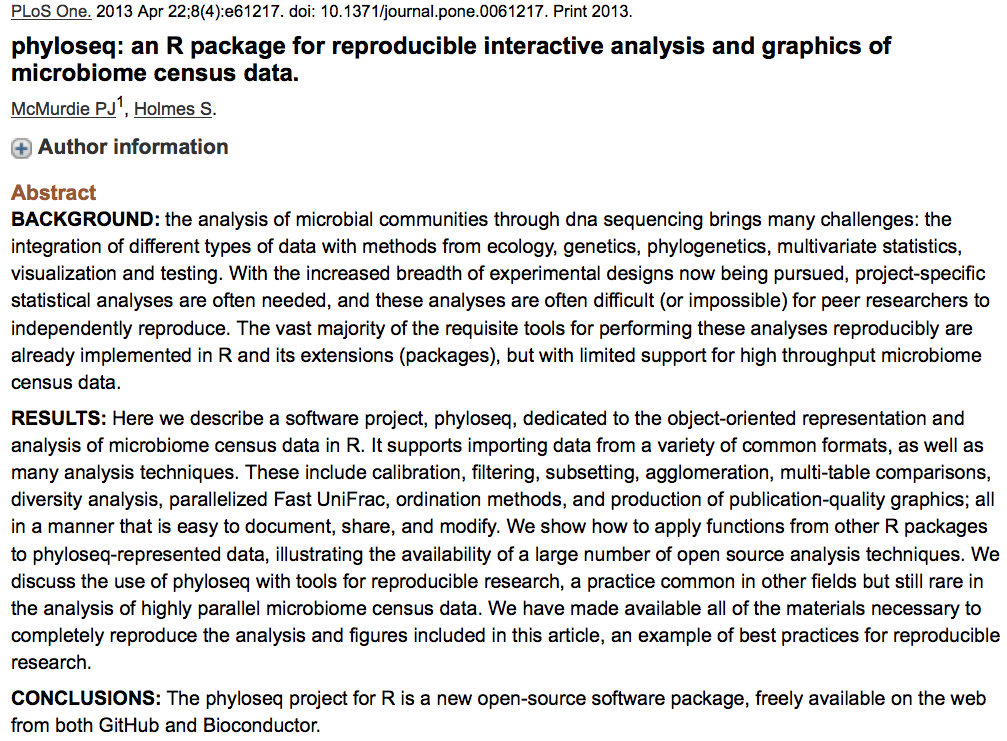
phyloseq is designed for viewing microbiome census data.
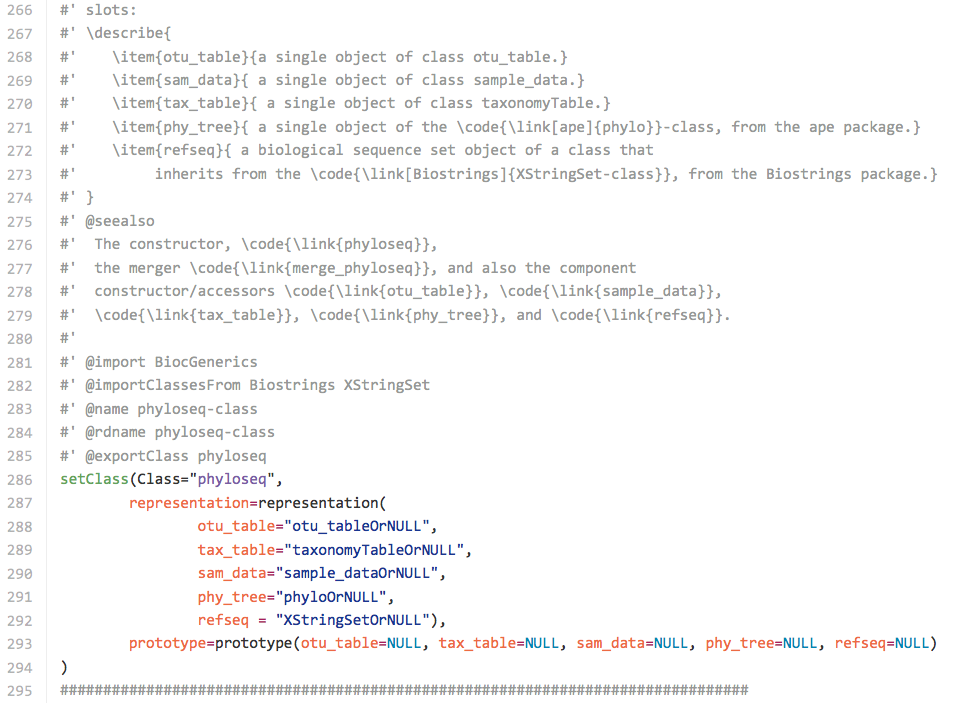
The tree viewer defined in phyloseq only works with phyloseq class. It also cannot view the tree parsing by newick file directly.
Internally, it calls ape to calculate edge positions.
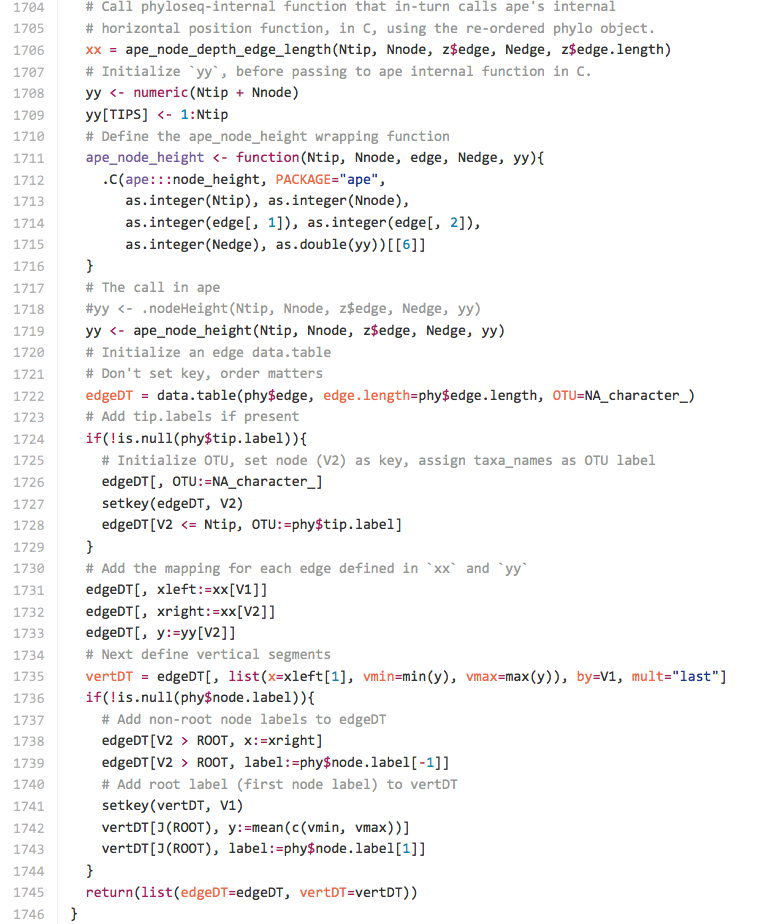
It draws horizontal lines followed by vertical lines.
Common drawbacks
- designed for specific need
ggphylofor mapping alignments to trees (not implemented yet)OutbreakToolsfor outbreak dataphyloseqfor microbiome census data
- not applicable for widely use tree file format
plotggphyinOutbreakToolsassumes input as an instance ofobkDataplot_treeinphyloseqassumes input as an instance ofphyloseq
- not extensible
- tree is drawn by lines, but information is related to taxa (nodes & tips)
- tree data (lines, nodes, labels) is separated in different
data.frame/data.table, making it impossible for users to further modify the tree
Using
ggplot2does not guarantee that the grammar of graphics is supported. Theggtreesupports grammar of graphics, while others implemented tree viewer for their specific need.
In ggphylo:
  lines.df <- subset(layout.df, type=='line')
  nodes.df <- subset(layout.df, type=='node')
  labels.df <- subset(layout.df, type=='label')
  internal.labels.df <- subset(layout.df, type=='internal.label')
  q <- ggplot(lines.df)

      geom.fn <- switch(aes.type,
        line='geom_joinedsegment',
        node='geom_point',
        label='geom_text',
        internal.label='geom_text'
      )
      q <- q + do.call(geom.fn, geom.list)
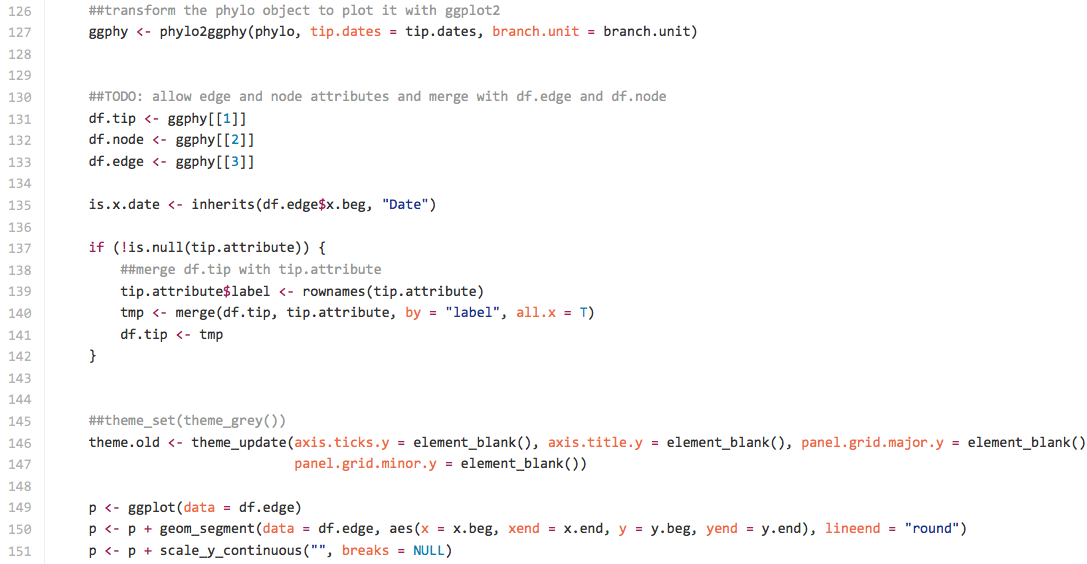
In OutbreakTools:
ggphy <- phylo2ggphy(phylo, tip.dates = tip.dates, branch.unit = branch.unit)


##TODO: allow edge and node attributes and merge with df.edge and df.node
df.tip <- ggphy[1](/YuLab-SMU/ggtree/wiki/1)
df.node <- ggphy[2](/YuLab-SMU/ggtree/wiki/2)
df.edge <- ggphy[3](/YuLab-SMU/ggtree/wiki/3)

p <- ggplot(data = df.edge)
p <- p + geom_segment(data = df.edge, aes(x = x.beg, xend = x.end,
                          y = y.beg, yend = y.end), lineend = "round")
p <- p + scale_y_continuous("", breaks = NULL)

if (show.tip.label) {
    p <- p + geom_text(data = df.tip, aes(x = x, y = y, label = label),
                       hjust = 0, size = tip.label.size)
}
In phyloseq:
treeSegs <- tree_layout(phy_tree(physeq), ladderize=ladderize)
edgeMap = aes(x=xleft, xend=xright, y=y, yend=y)
vertMap = aes(x=x, xend=x, y=vmin, yend=vmax)
## Initialize phylogenetic tree.
## Naked, lines-only, unannotated tree as first layers. Edge (horiz) first, then vertical.
p = ggplot(data=treeSegs$edgeDT) + geom_segment(edgeMap) +
    geom_segment(vertMap, data=treeSegs$vertDT)

if(!is.null(label.tips)){
    ## `tiplabDT` has only one row per tip, the farthest horizontal
    ## adjusted position (one for each taxa)
    tiplabDT = dodgeDT
    tiplabDT[, xfartiplab:=max(xdodge), by=OTU]
    tiplabDT <- tiplabDT[h.adj.index==1, .SD, by=OTU]
    if(!is.null(color)){
        if(color %in% sample_variables(physeq, errorIfNULL=FALSE)){
            color <- NULL
        }
    }
    labelMap <- NULL
    if(justify=="jagged"){
        labelMap <- aes_string(x="xfartiplab", y="y", label=label.tips, color=color)
    } else {
        labelMap <- aes_string(x="max(xfartiplab, na.rm=TRUE)", y="y", label=label.tips, color=color)
    }
    ## Add labels layer to plotting object.
    p <- p + geom_text(labelMap, tiplabDT, size=I(text.size), hjust=-0.1, na.rm=TRUE)
}
These tree view functions are just other ordinary plot functions. Although they use ggplot2 and we can for example use theme to change background, scale_X function to change XY axis and we can add nonsense layer above the tree just as we can produce grammar correct sentence that is nonsense. This is not the philosophy of grammar of graphics. Their implementations hardly allow users to add layers that related to taxa in the tree.
Their tree views can be hardly controlled without pre-defined parameters. As the code shown above, if a tree has been created without labels, we cannot add a layer of tip labels since the information is created within the function (we could only access the positions of lines after the tree was drawn).
For example, in OutbreakTools
if (show.tip.label) {
    p <- p + geom_text(data = df.tip, aes(x = x, y = y, label = label),
                       hjust = 0, size = tip.label.size)
}
If show.tip.label = FALSE, the df.tip will be thrown away when p is returned. Then it is impossible to add tip labels. The only way is to pass show.tip.label=TRUE at the very beginning when calling plotggphy. For this, ggphylo and phyloseq have similar implementations. Users have little idea about how to add related information if the related parameters are not pre-defined in those functions.
All these implementations parse a tree into a collection of lines. If we want to annotate taxa with the related information, we have to calculate node positions based on the position of lines. It is even harder if the lines.df does not contain information of mapping the line to node. Some users may not have that expertise and it is almost impossible to add new layers of related information.
reproduce examples from other packages using ggtree
Plot functions defined in ggphylo, OutbreakTools and phyloseq are all special cases that can be implemented by a few layers using ggtree.
Please refer to the following links:
- reproduce ggphylo example using ggtree
- reproduce OutbreakTools example using ggtree
- reproduce phyloseq example using ggtree
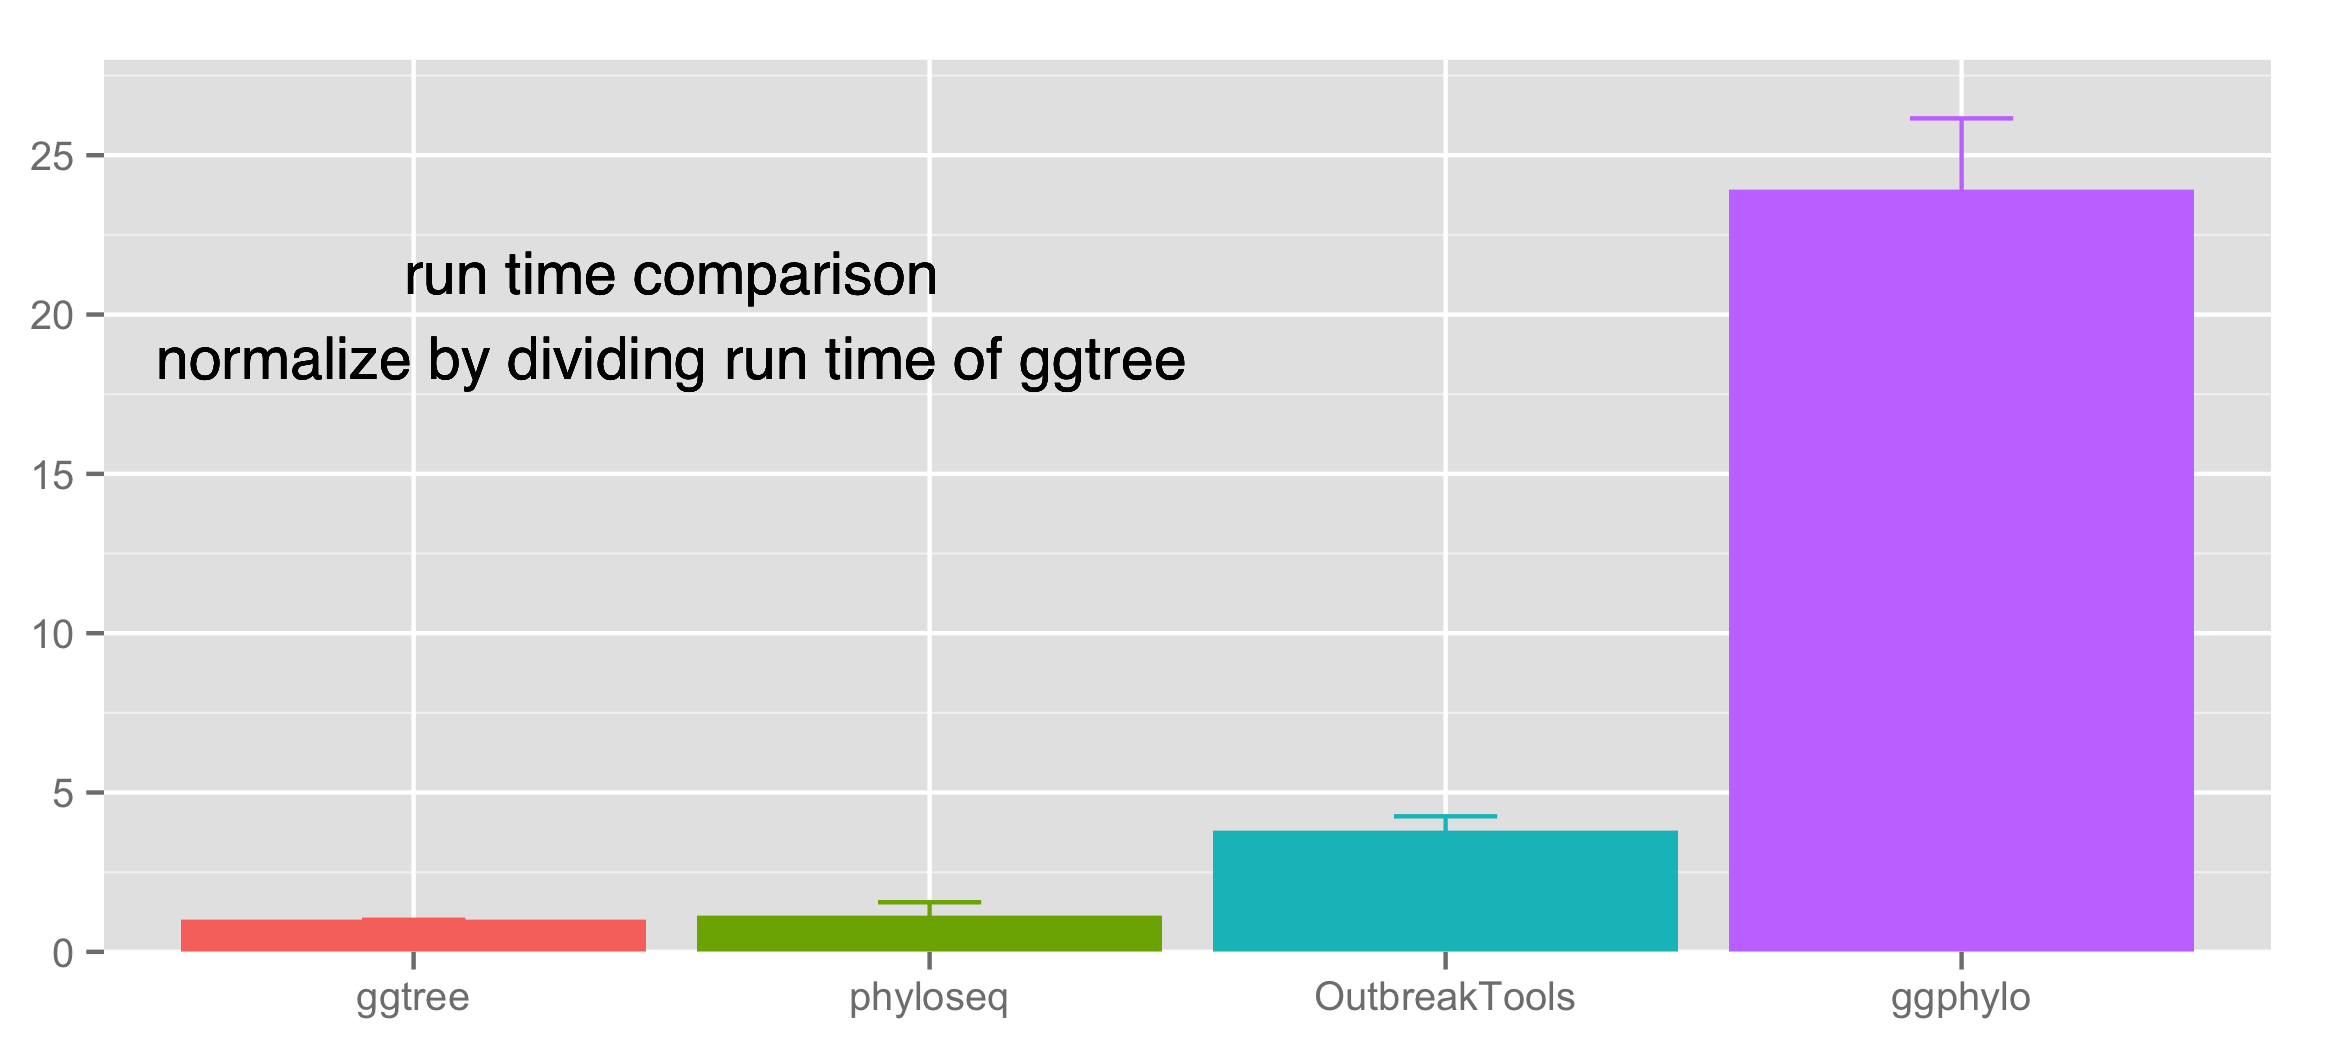
run time benchmark
To compare the run time of these three packages (phyloseq, OutbreakTools & ggphylo) with ggtree, we ran the example (mentioned above) from each of these packages with their own as well as with ggtree. Each example was replicated 100 times in each of which the run time was recorded. We normalized their run time by dividing with the run time of corresponding example run in ggtree. In general, ggtree runs faster than other packages.
The design of ggtree
Overall, ggtree has the beauties of the following features:
- truly extends
ggplot - parses tree as a collection of taxa
Briefly we separate the tree parsing (including common software output) from visualization. We provide simple plot function, which is a true extension of ggplot to support tree objects.
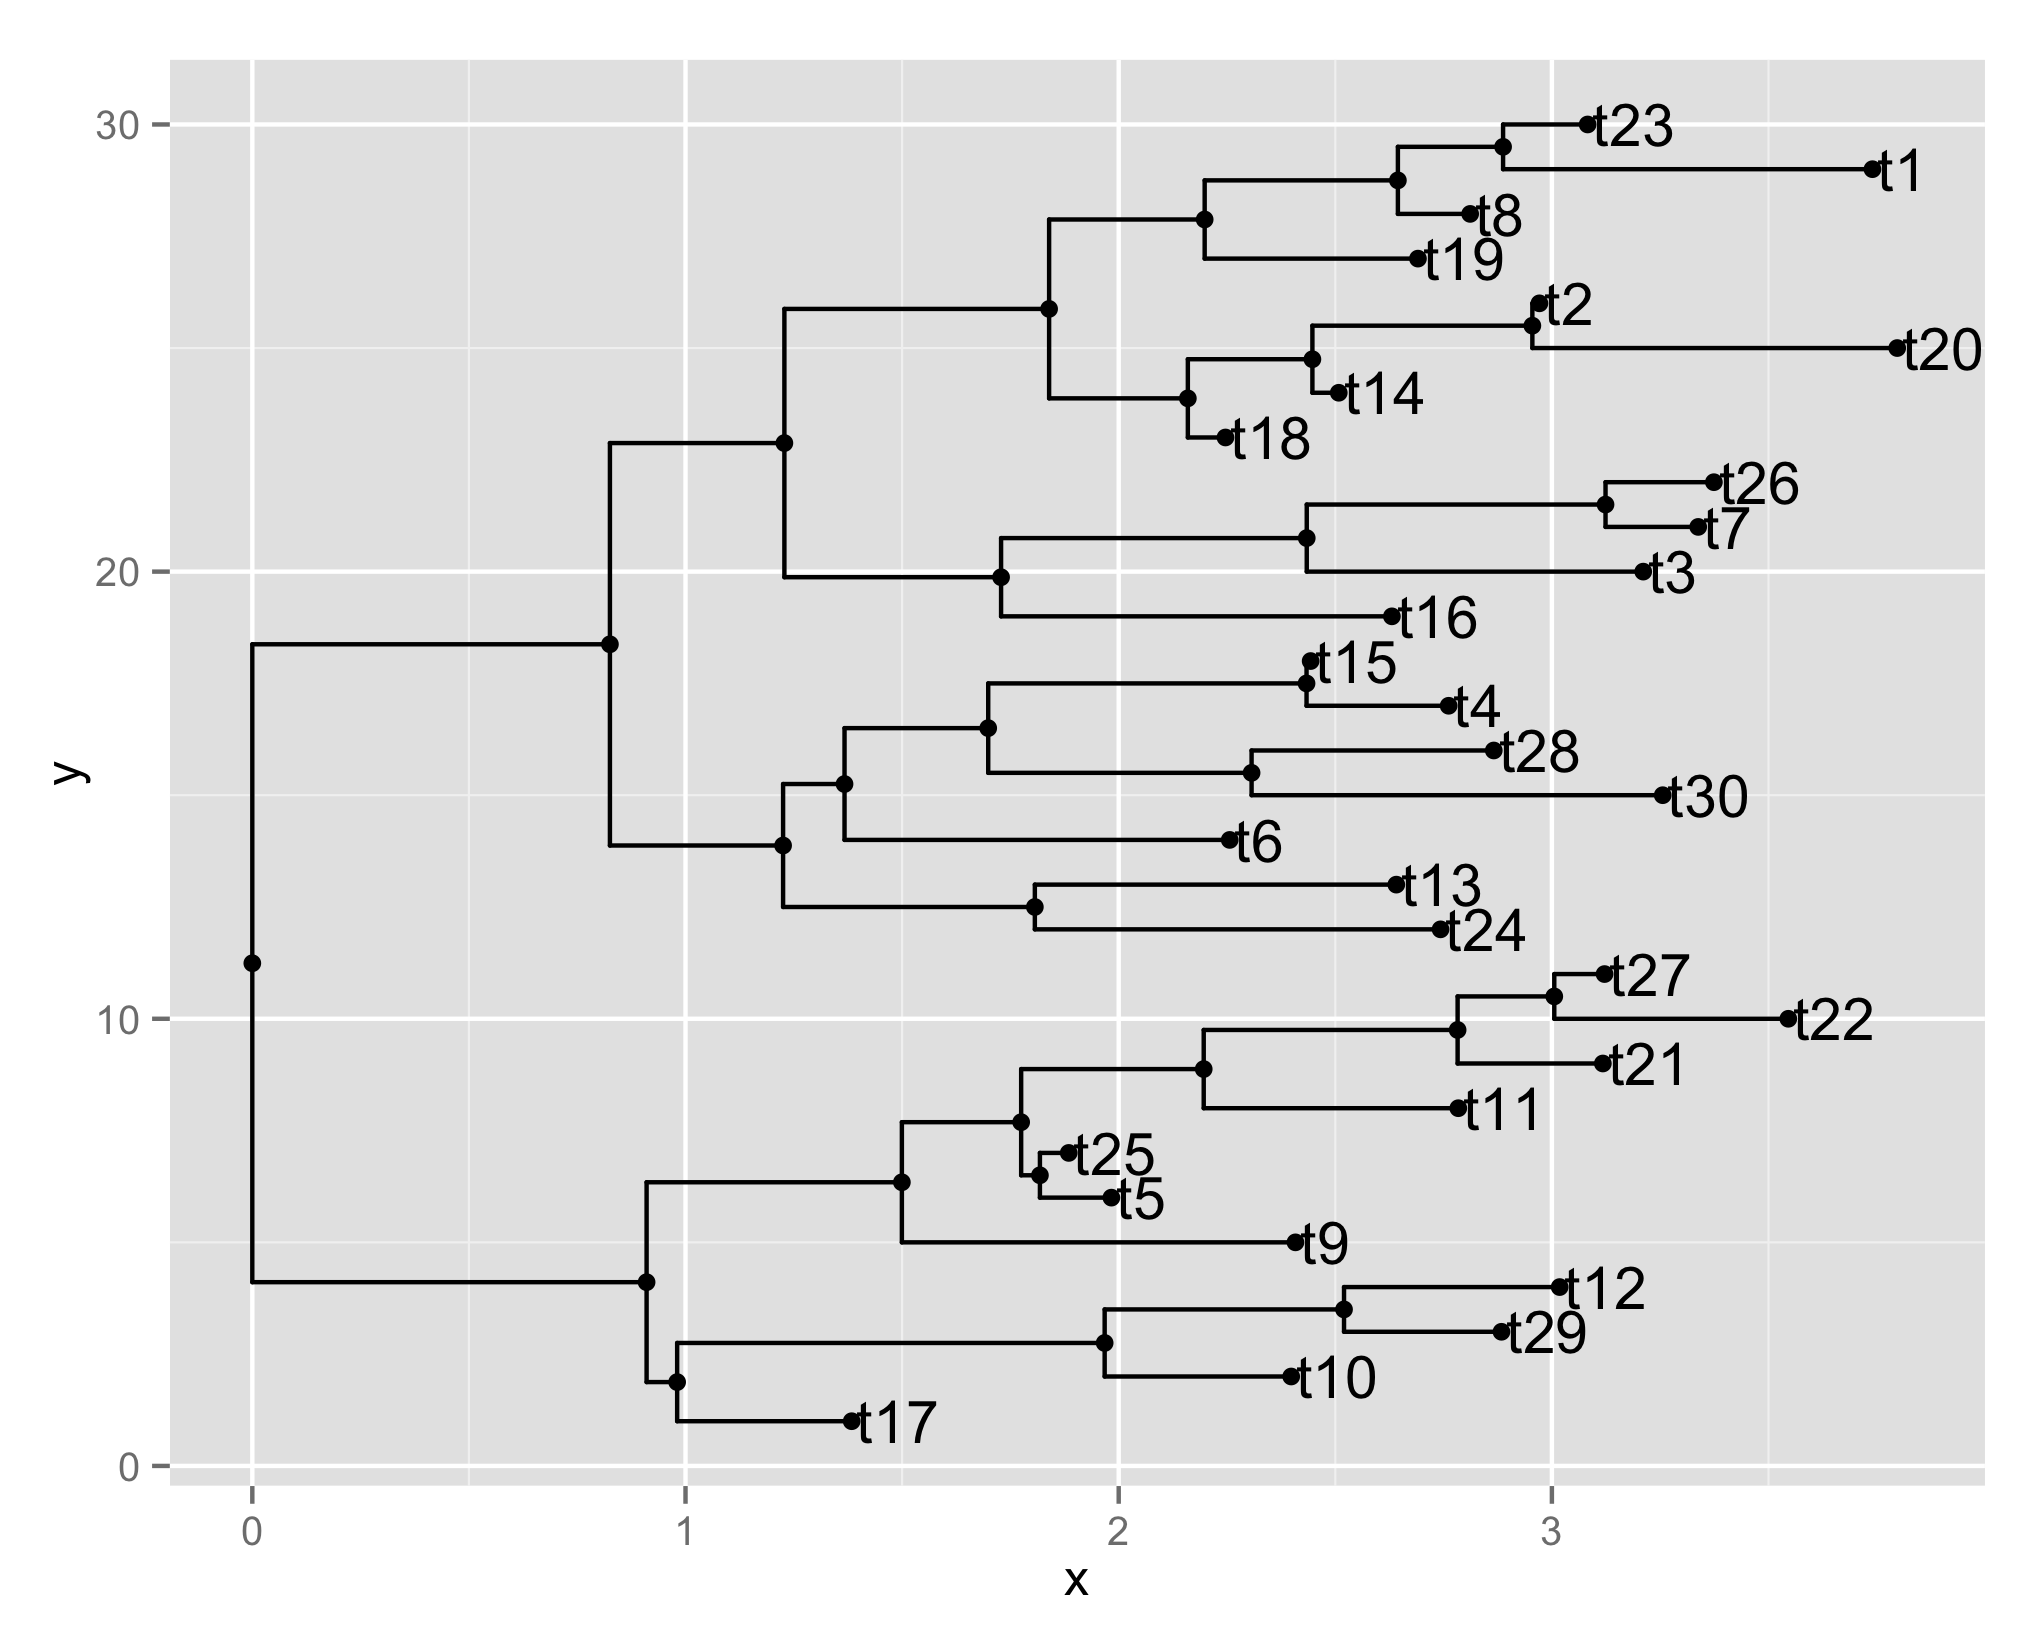
Tree is viewed via geom_tree layer that was created in ggtree. complex tree view can be achieved via adding annotation layers that could be freely controlled by users.
tr <- rtree(30)
ggplot(tr, aes(x, y)) + geom_tree()
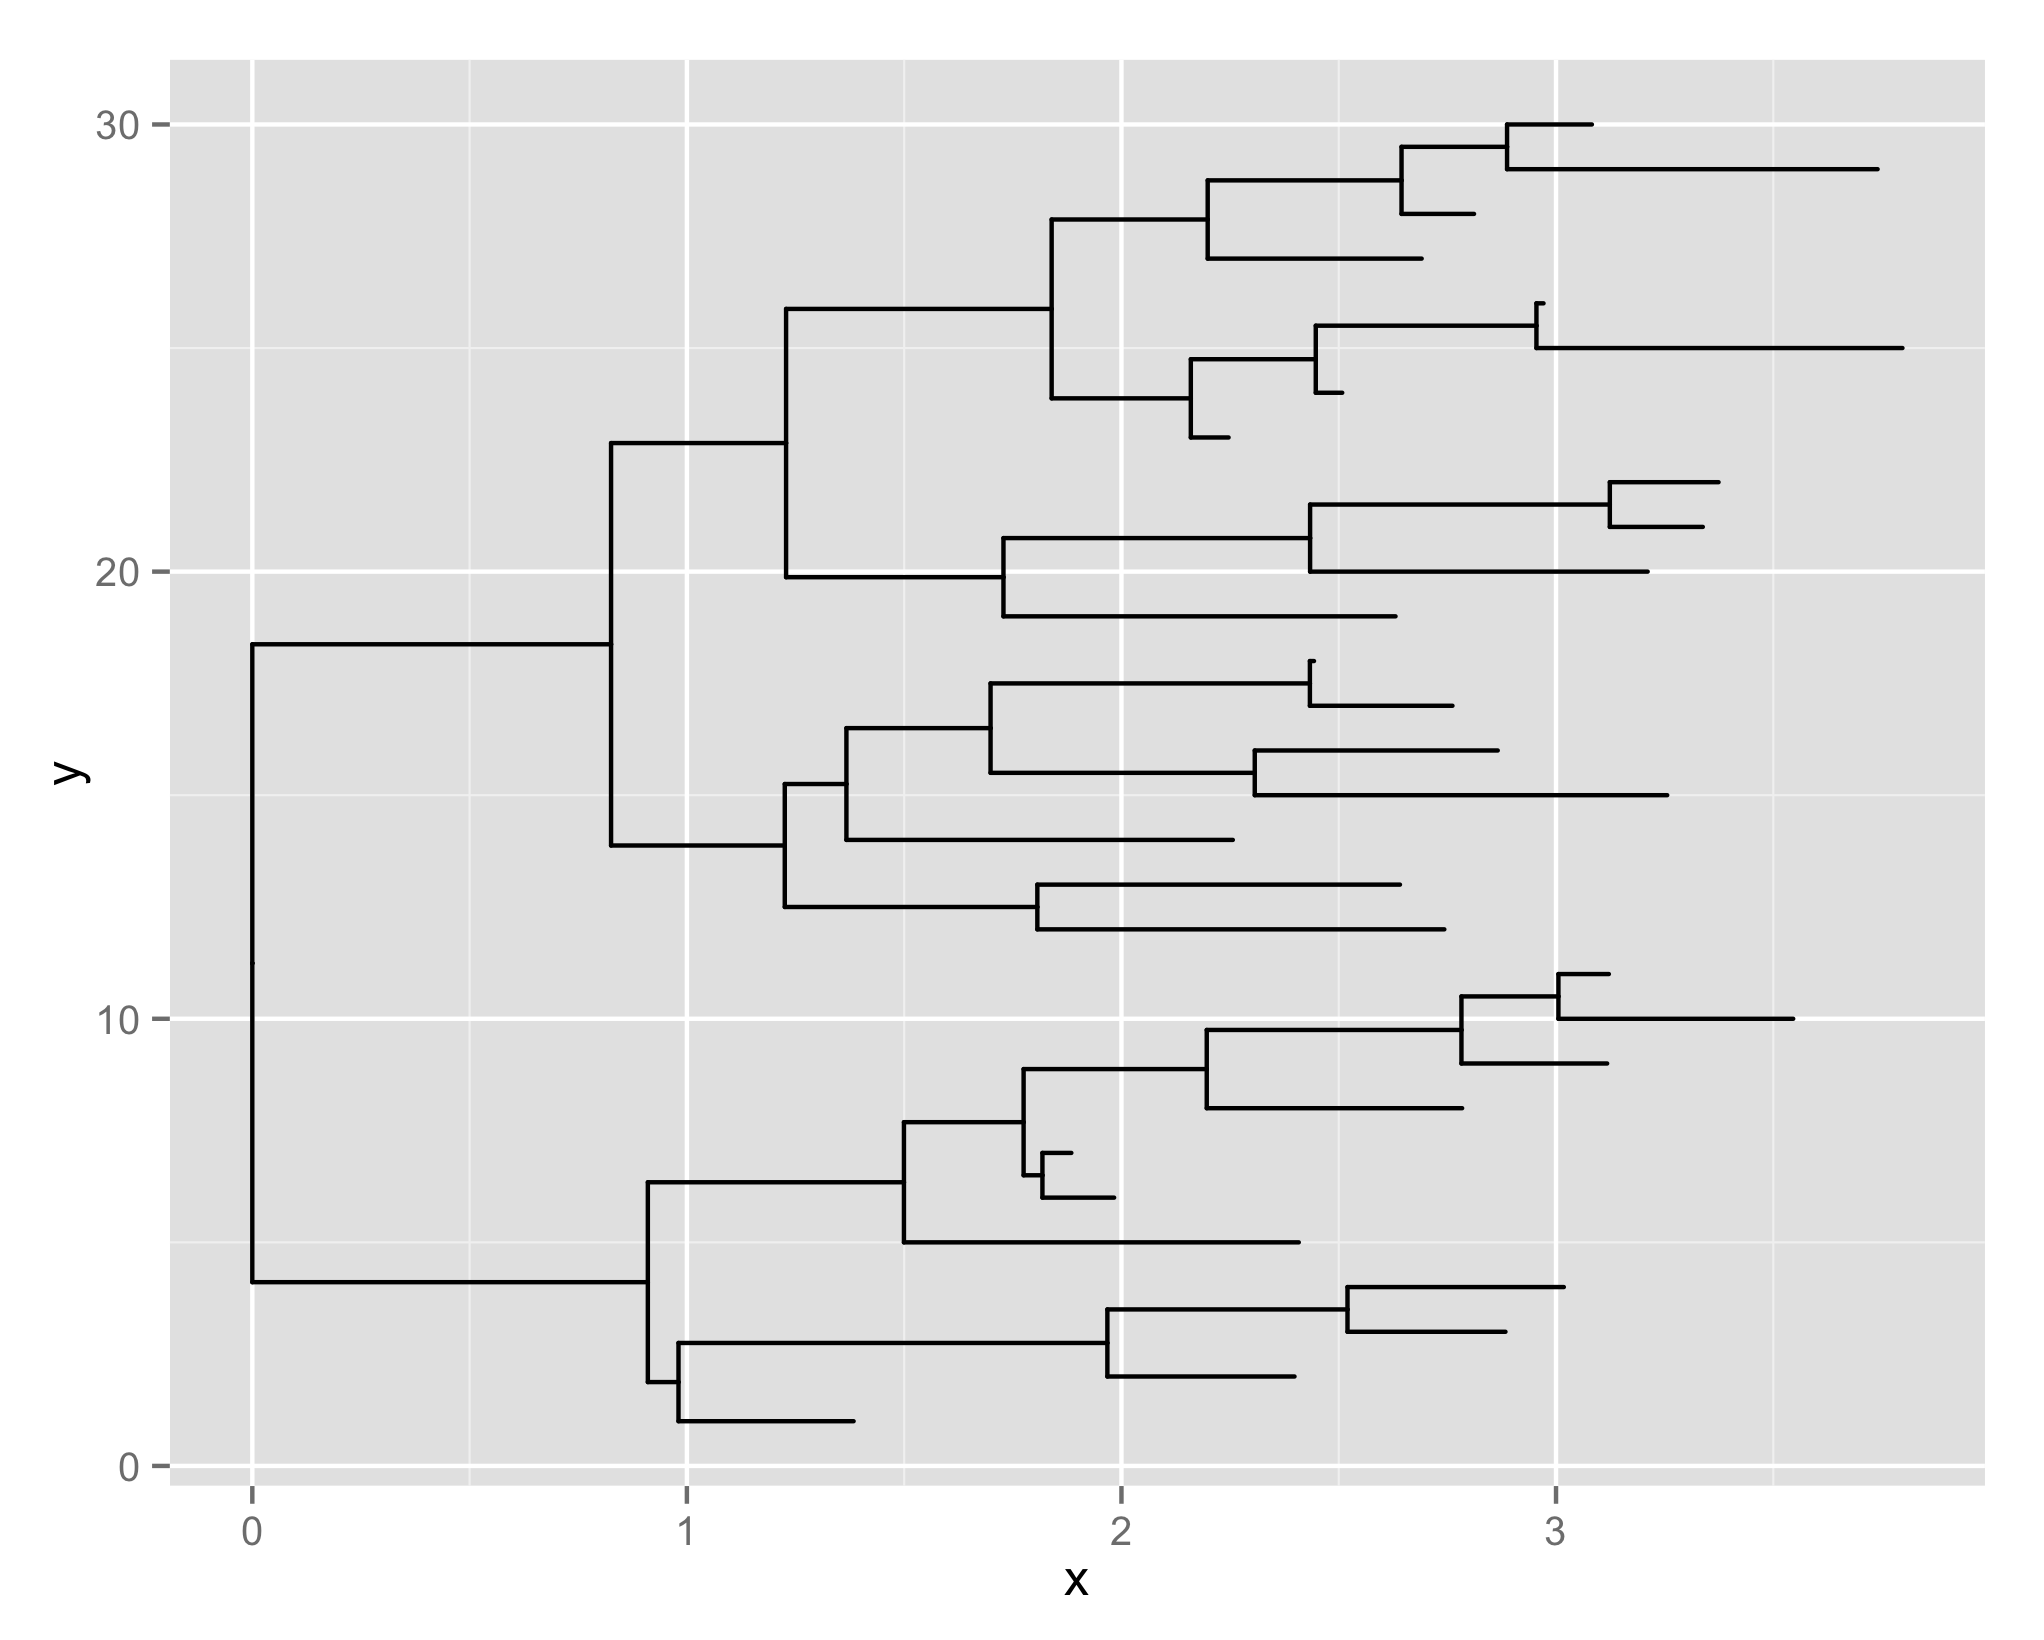
The ggtree function is just a shortcut of ggplot() + geom_tree() + xlab(NULL)+ylab(NULL) + theme_tree().
We parse a tree as a collection of taxa, and only taxaon (node) positions are recorded. This makes it easy to add external information related to taxa (label, clade probability, bootstrap value, dN/dS, etc) on the tree view.
ggplot(tr, aes(x, y)) + geom_tree() + geom_point() + geom_tiplab()
ggtree offers many helper functions (e.g. geom_tiplap() in the example for adding tip labels) to highlight clade, annotate clade, classify taxa, rotate clade, rescale clade etc.. Although these functionalities can be found elsewhere (mostly piece by piece), unlike other software, functions implemented in ggtree are only building blocks and users are not imposed restriction of employing these functionalities to create their own style to view a tree.
Output files of common software for molecular evolution analysis are supported and their estimated evolutionary data can be viewed directly in a new layer. Results of different software analyzing the same tree can be merged, and therefore can be conveniently compared.
As we mentioned above, tree views produced by ggphylo, OutbreakTools and phyloseq are not easily extensible. ggtree provides equivalent functions yet with extensible implementations. Users are allowed to freely add new layers, to create more complex tree view. The differences between ggtree and other packages are not solely on the designed, but more fundamentally of how we parse a tree. It's different from other tree viewers at the very beginning.
ggphylo, OutbreakTools and phyloseq made all good implementation to answer specific questions, while ggtree is designed as a general framework of viewing and annotating phylogenies with diverse meta-data. Therefore, we strive to provide a flexible and versatile tree annotator without restriction.