Projecting and Cleaning from Eastings and Northings to WGS84 - WorldBank-Transport/tz-data-cleaning GitHub Wiki
This guide will show you how to clean data with malformed coordinates. Specifically how to clean data where coordinates are in two different cartesian reference systems, like ARC1960 UTM36S and ARC1960 UTM37S. This guide uses School Location data provided by the National Bureau of Statistics of Tanzania.
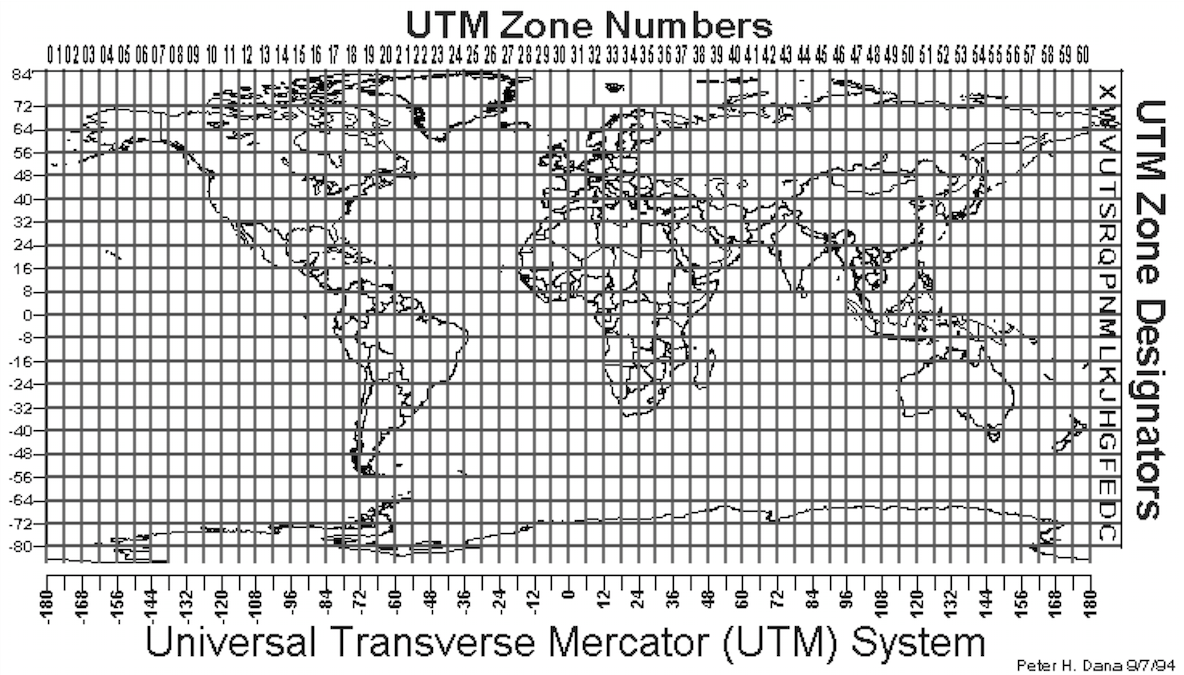
There are two main types of coordinate reference system, Cartesian and Geographic. A cartesian coordinate system is where coordinates are projected in a 2D manner, into a grid, like the image above. Commonly cartesian coordinates are in specific zones. Each zone will have a datum point, indicating the start point of the system. Tanzania spans three zones, 35S, 36S 37S. This means the 35th, 36th and 37th Southern Zones. This has the issue that at times coordinates span different zones, but are not marked, leading to projection issues. This contrasts with a Geographic Coordinate System like WGS84 (GPS coordinates, latitude and longitude). These coordinate systems span the world and generally are slightly more imprecise than cartesian systems, however, GPS has made massive leaps forward in resolving these imprecision issues.
The data provided by NBS is in the format of school name, easting and northing. Originally this data was in differing excel files, categorised by district. Each sheet within the spreadsheet would cover a different area, from education, water, health and other facilities. Using freely available tools, like Open Refine and QGIS we are able to combine and clean this data. A first step is to just combine the data into one file.
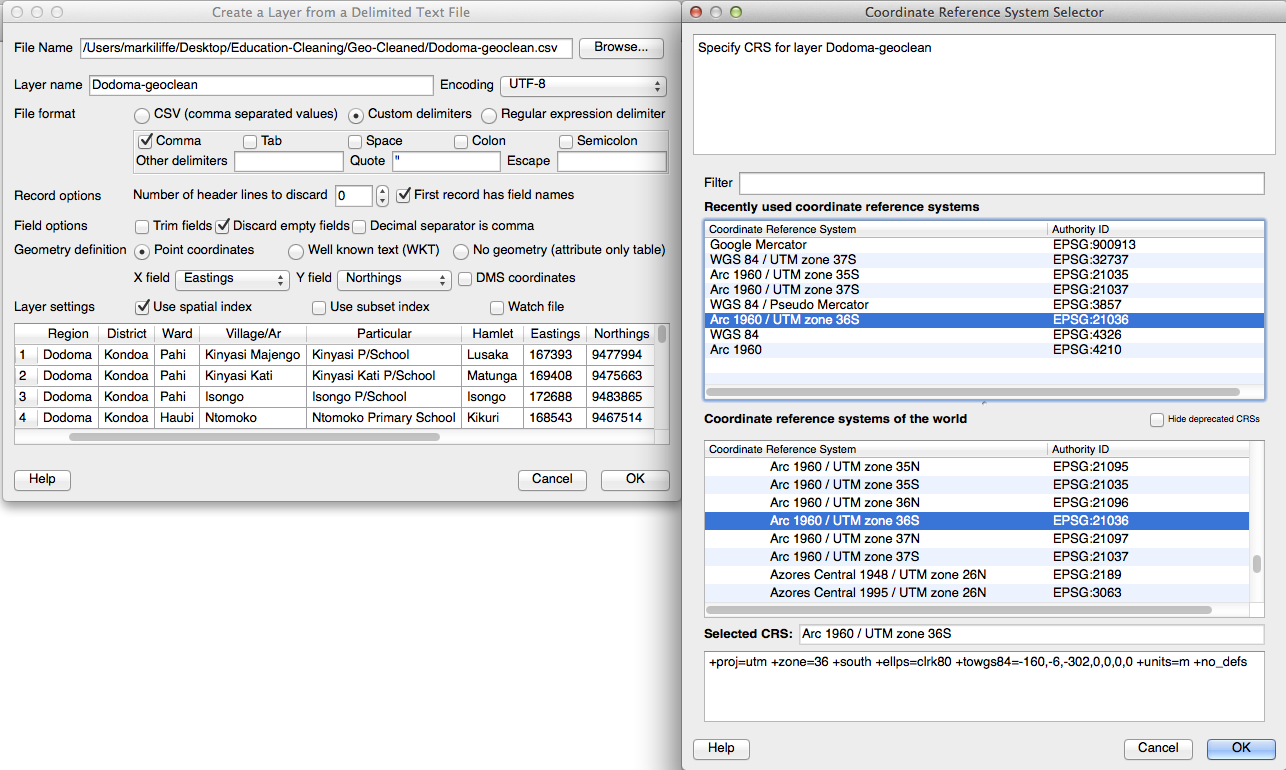
To load the school data into QGIS, a free and open source GIS software, click the menu bar Layer -> Add Delimited Text Layer. Find your file on your computer. When you have loaded it, you will have to choose the Eastings and Northings into the x and y field. Remember that the x axis goes left-right and y axis is top-bottom. When you click ok, you will be asked to chose the projection system for the coordinates, as it is Tanzania, it will usually be ARC 1960 UTM35S/UTM36S/UTM37S, depending on where the region is. Potentially it could be both. Use the grid above to work this out. Use the OpenLayers OpenStreetMap plugin is also quite useful to view by eye to see if your projection is correct. Reprojecting will be covered in depth later in this guide.
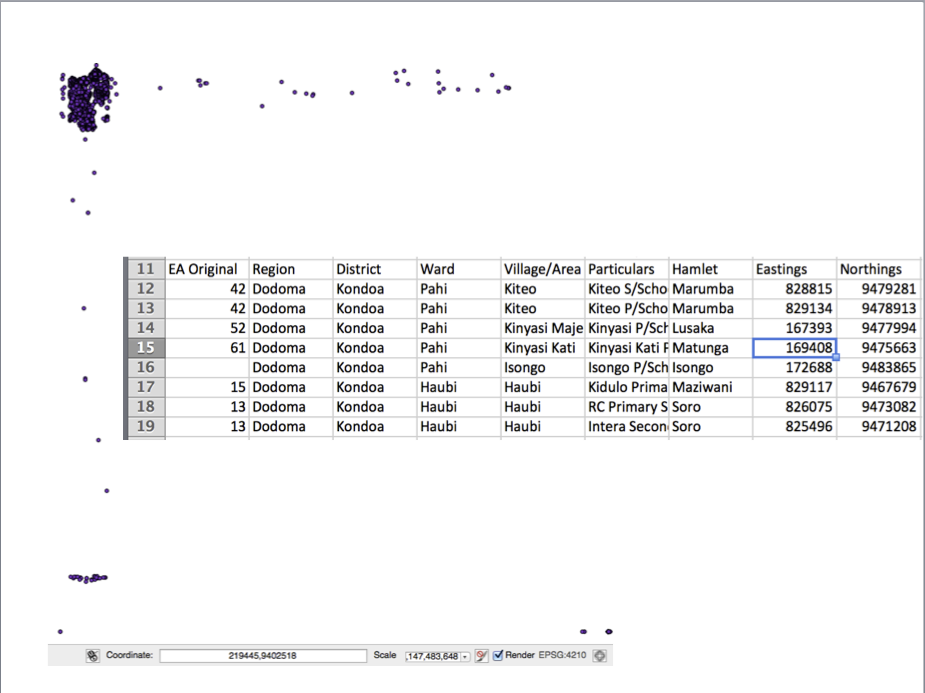
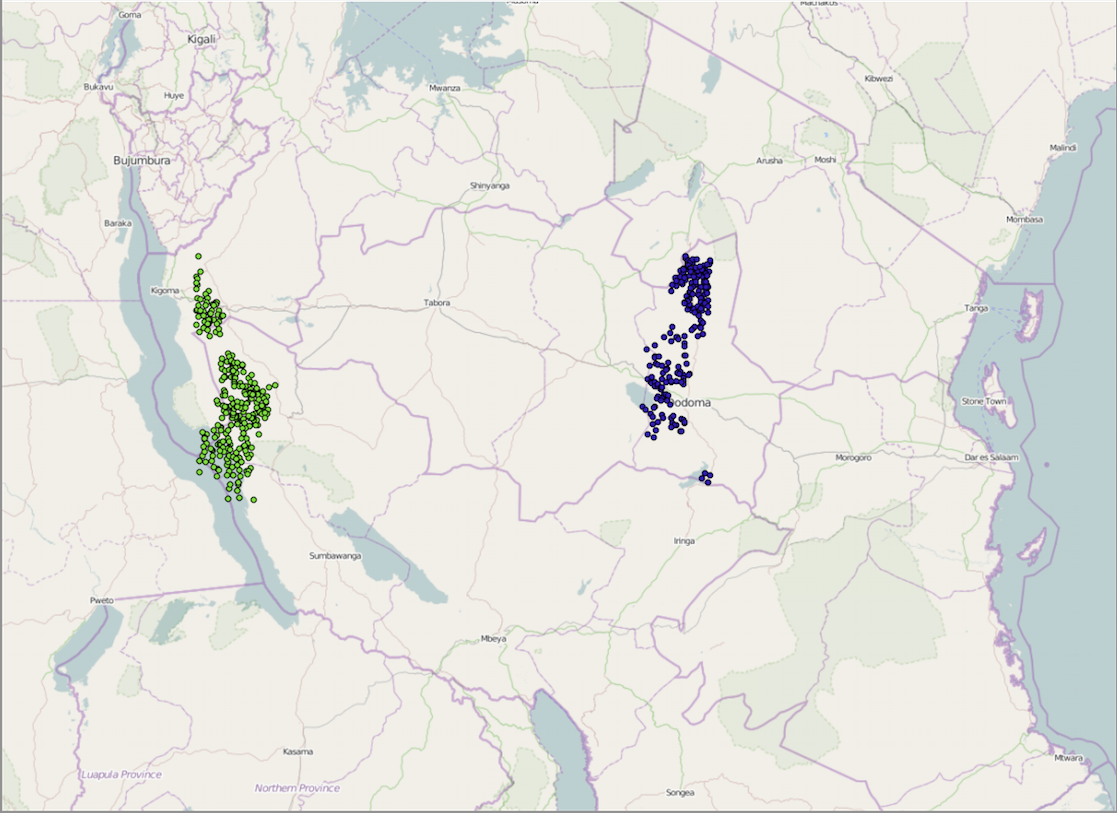
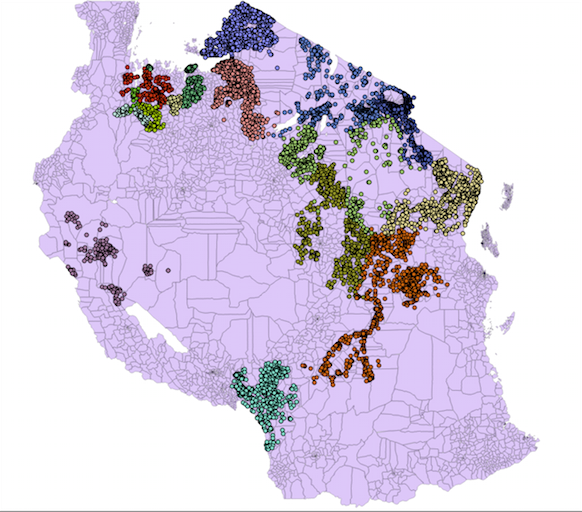
Once your data is loaded and projected it could appear like the image above. This is indicate of two major geospatial issues. First the points that are either massively east or south of the main bulk of points. This mainly due to human input error, but this can be resolved by using Open Refine, a free and open source data cleaning program. Upload your data to Open Refine.
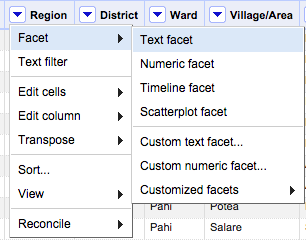
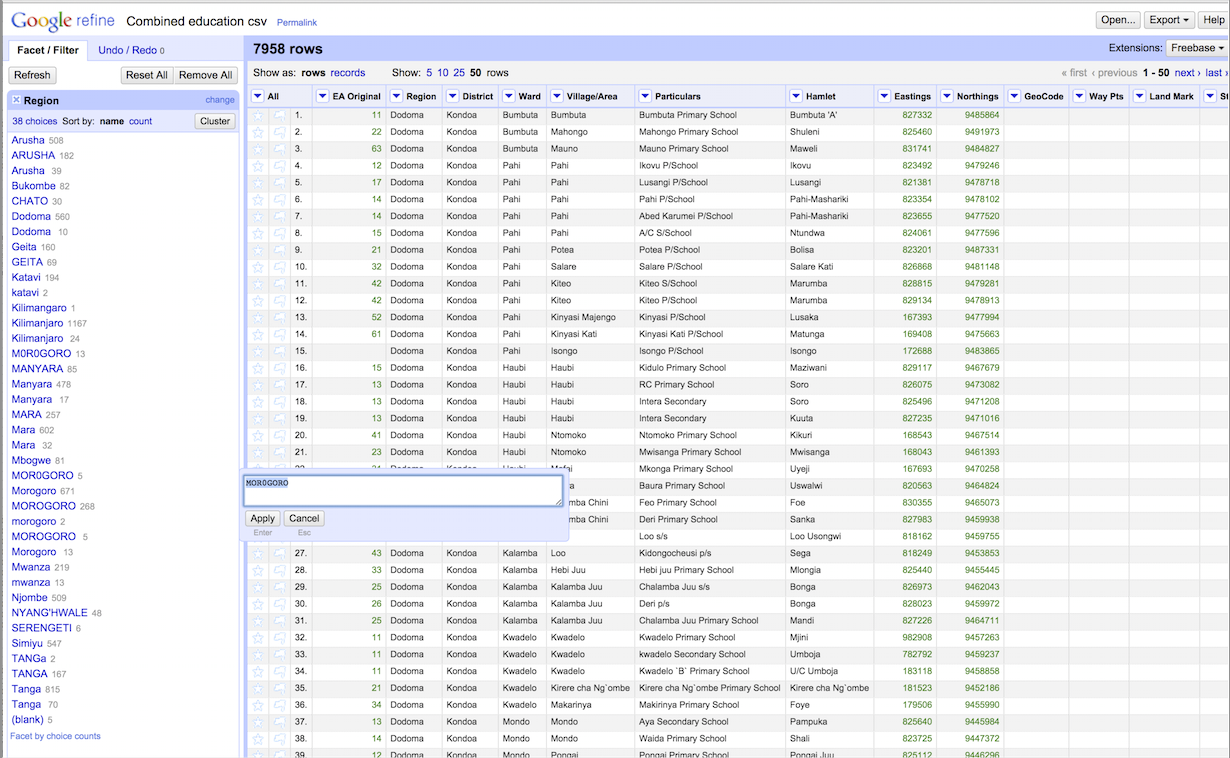
Once the project and data has been uploaded you can take click on the column headers and create facets. Facets are ways of classifying and breaking down the data. Once you create a facet (here we classify by region), you can correct visible errors. In the schools data set, the region of Morogoro had different permutations; Mor0goro, MOROGORO, mogorogo etc. It is important to harmonise the data so none of this exists. This involves having knowledge of the correct regions and ensuring all data conforms to them. The same process can then be done for districts and wards.
Once you have completed this process, download the data by region. By making the data sections by region you'll now be able to export it as a CSV. This is important for resolving the geospatial inaccuracies identified earlier.
When you upload your region data in QGIS it could look like the image above. There are two main issues, points being in the ocean and some of the points are in the wrong place. It is important to differential between human error and the wrong coordinate system. A good way of understanding human error is to look at the outliers, these will be on their own or with a few other points in the Antarctic or in the ocean. Select them using the QGIS select by location tool, and look at the attribute table. Look at the other attributes in the 'same' location, could be ward or village and attempt to identify the error. It could be a number being added or missing from the easting or northing column. In these cases add what appears to be the right number or remove it, then look at what happens on the map to verify. In the case of a 'wrong' number, i.e. a 3 instead if a five, change it. The rule is to do what looks right and then verify. Iterate this process.
The second issue of resolving the different coordinate systems is quite simple to resolve. Load the data using the 'right' projection. Some of the points will be using a different system. Select these points and export them in the right UTM zone plus one.
So, Dodoma exists in UTM Zone 36S. Some of the data points are misprojected into UTM Zone 35S, so you would save them as UTM 36S. By adding this inputted file, they will now be in the right place. Using the Edit function within the Attribute Table delete the now misplaced school points.
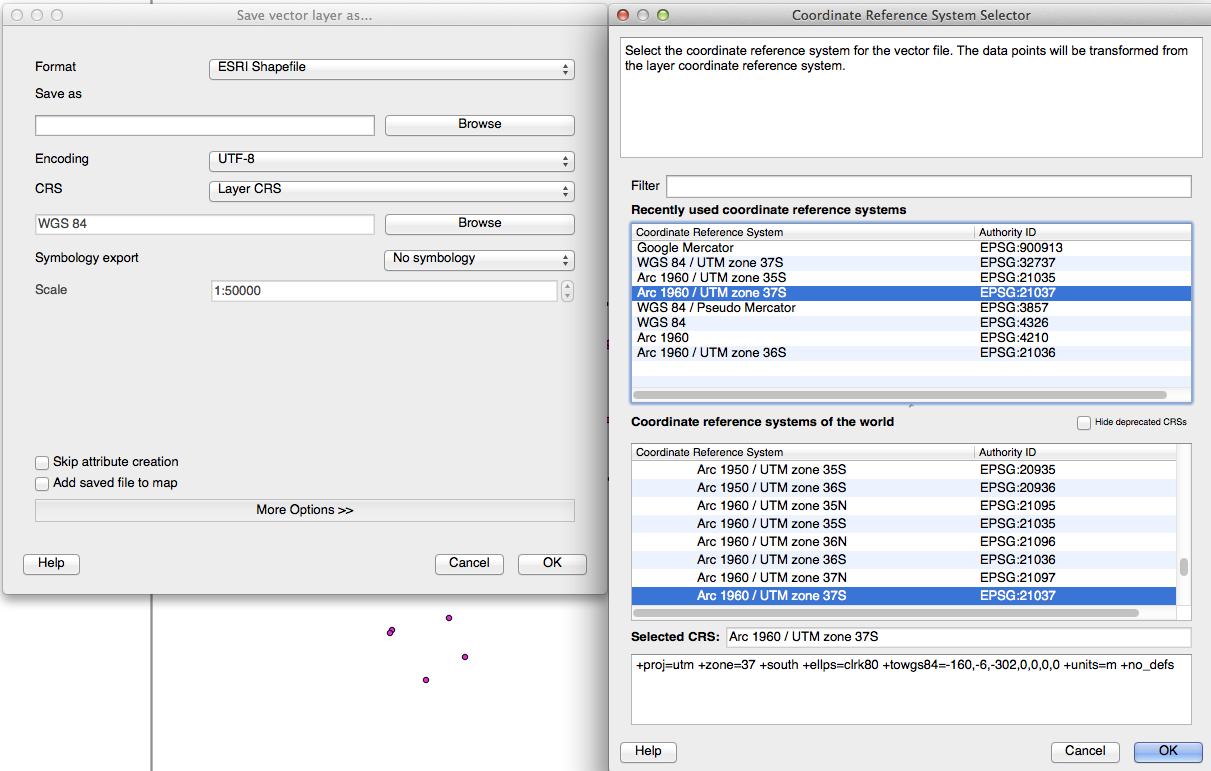
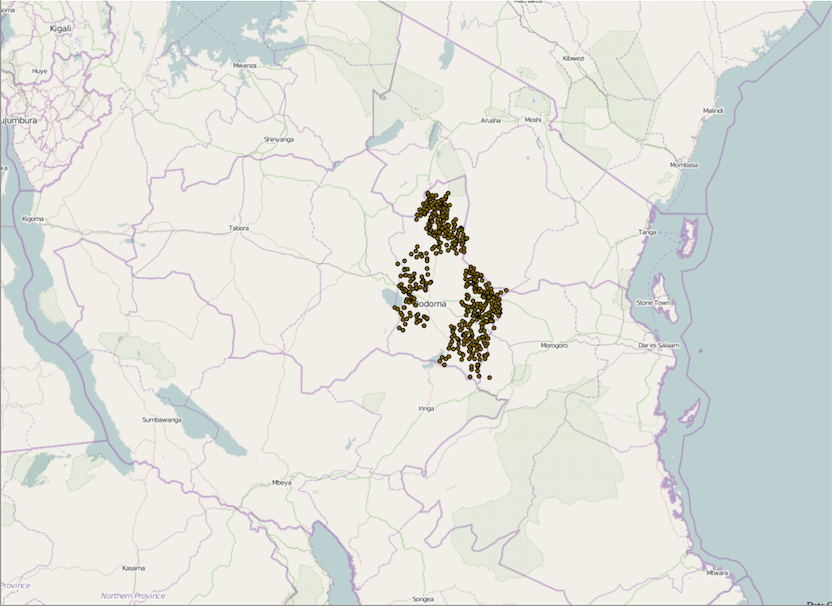
Once you have done this the schools should now appear like the image above, all in the right place. Iterate this for all regions. From here, click the menubar Vector -> Data Management Tools -> Merge Shapefiles Into One and merge your geographically cleaned shapefiles into one file. The final step is to add the latitude and longitude to the attribute table, so if you export the shapefile as a CSV, latitude and longitude exist as variables in the file. First of all, right click the merged shapefile and Save As... using the projection EPSG 4326 WGS 1984.
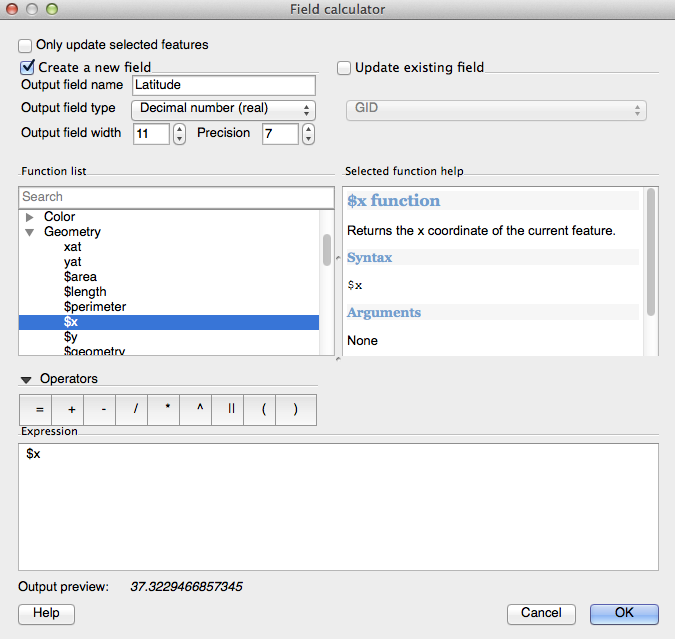
This is the projection for GPS, so will harmonise with people doing surveys with GPS coordinates. Open the attribute table, put the file into editing mode by clicking the Edit button and click the Field Calculator icon, this looks like a abacus. In the calculator check the Add New Field checkbox. Type the name of the field, either latitude or longitude, select Decimal Number (Real) as the data type, this is the data type for latitude and longitude. Add 11 as an Output Field Width and add the number 7 to the Precision. Within the Function List, select Geometry and chose $x if you want the latitude or $y if you want longitude. Press Ok and your column will be added with each School populated with the right latitude or longitude. Once this process is completed for both latitude and longitude, ensure you end editing mode by clicking the edit icon and save your changes. You should now have a file with the right locations for schools, with latitude and longitude. Now it is a case of classifying the schools.