2021 01 05 Gamma - WojciechMigda/TruRL GitHub Wiki
Experiment parameters:
Episodes: 100
max_episode_steps: 200
Memory capacity: 100000
GAMMA: <#####>
NEPOCHS(20)
KBinsDiscretizer({
    {34, -0.300000, 0.300000},
    {34, -0.300000, 0.300000},
    {34, -0.300000, 0.300000},
    {34, -0.300000, 0.300000},
    {34, -0.300000, 0.300000},
    {34, -0.300000, 0.300000},
    {34, -0.300000, 0.300000},
    {34, -0.300000, 0.300000},
    {34, -0.300000, 0.300000},
    {34, -0.300000, 0.300000},
    {34, -0.300000, 0.300000},
    {34, -0.300000, 0.300000},
    {34, -0.300000, 0.300000},
    {34, -0.300000, 0.300000},
    {34, -0.300000, 0.300000},
    {34, -0.300000, 0.300000},
    {34, -0.300000, 0.300000},
    {34, -0.300000, 0.300000},
    {34, -0.300000, 0.300000},
    {34, -0.300000, 0.300000},
    {34, -0.300000, 0.300000},
    {34, -0.300000, 0.300000},
    {34, -0.300000, 0.300000},
    {34, -0.300000, 0.300000},
    {34, -0.300000, 0.300000},
    {34, -0.300000, 0.300000},
    {34, -0.300000, 0.300000},
    {34, -0.300000, 0.300000},
    {34, -0.300000, 0.300000},
    {34, -0.300000, 0.300000},
    {10, 0.000000, 100.000000},
    {10, 0.000000, 100.000000},
    {10, 0.000000, 200.000000},})
Scaler({[-50.000000, 50.000000], [0, 10000]})
TsetliniClassifierBitwise({
        "threshold": 10000,
        "s": 4.000000,
        "number_of_regressor_clauses": 3200,
        "number_of_states": 127,
        "boost_true_positive_feedback": 1,
        "random_state": 1,
        "n_jobs": 6,
        "clause_output_tile_size": 16,
        "weighted": true,
        "loss_fn": "MSE",
        "loss_fn_C1": 0.000000,
        "max_weight": 2147483647,
        "verbose": false
    })
Gym: <TimeLimit<WavyMarketEnv, Actions=[<Actions.HOLD: 0>, <Actions.BUY100: 1>, <Actions.SELL100: 2>]>>
Gamma controls how far into the future Q function looks.
Four values of gamma were evaluated: 0.70 (from yesterday's experiment), 0.80, 0.90, and 0.95.
All other parameters were the same as in yesterday's experiment (baseline).
There were 10 separate runs, each consisted of 100 episodes and each episode ran for 200 steps.
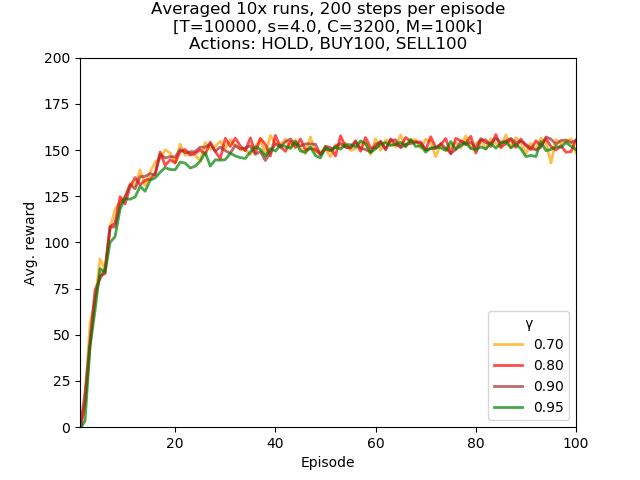
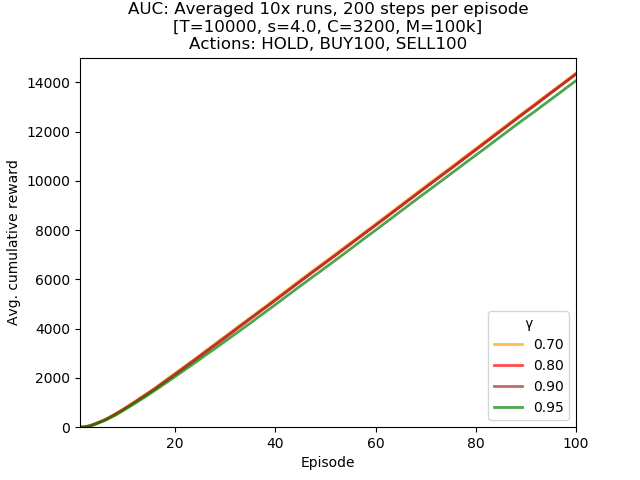
Each tested gamma value displayed very similar learning performance. Differences are very slight, and gamma=0.70 was above others.
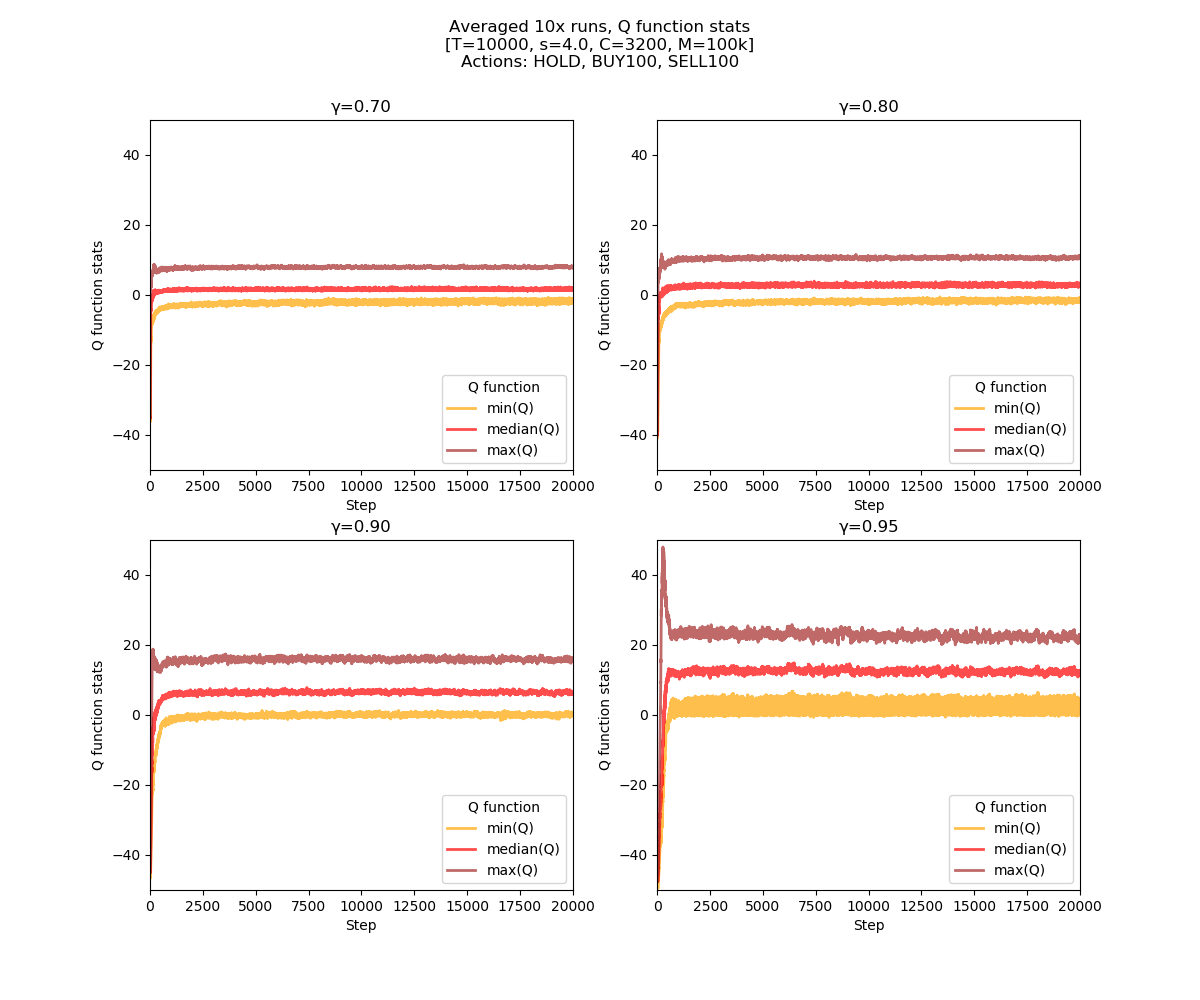
Q function statistics plot below demonstrate that the Q values fed to the model were stable. There seem to be difference in variance (gamma=0.70 being the least noisy) but that might also be a result of different ranges reusulting from different gamma values.
Location: /experiments/2021-01-05_wavy_gamma
Scripts are versioned in the folder above.