2020 09 30 L1+L2 loss function for max_episode_steps=500 - WojciechMigda/TruRL GitHub Wiki
Run parameters:
Episodes: 1000
max_episode_steps: 500
Memory capacity: 25000
NEPOCHS(20)
KBinsDiscretizer({
    {34, -4.800000, 4.800000},
    {34, -2.600000, 2.600000},
    {34, -0.418000, 0.418000},
    {34, -3.000000, 3.000000},})
Scaler({[0.000000, 500.000000], [0, 80000]})
TsetliniClassifierBitwise({
        "threshold": 80000,
        "s": 4.000000,
        "number_of_regressor_clauses": 3200,
        "number_of_states": 127,
        "boost_true_positive_feedback": 1,
        "random_state": 1,
        "n_jobs": 6,
        "clause_output_tile_size": 16,
        "weighted": true,
        "loss_fn": "L1+2",
        "loss_fn_C1": <#####>,
        "max_weight": 2147483647,
        "verbose": false
    })
Eight C parameter values for the L1+L2 loss function were examined: 0.00, 0.01, 0.02, 0.04, 0.05, 0.1, 0.2, and 0.3.
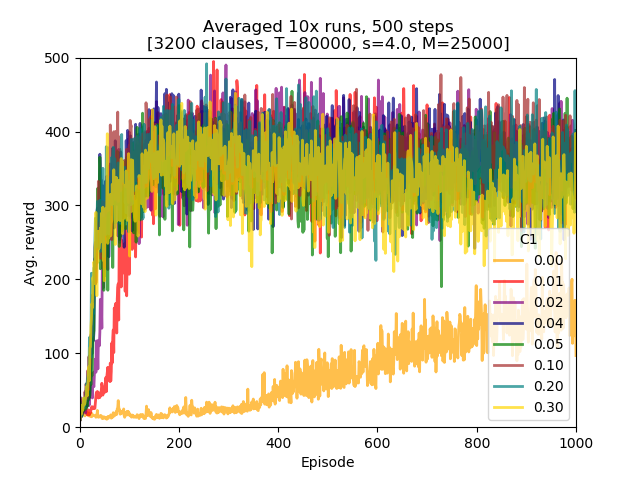
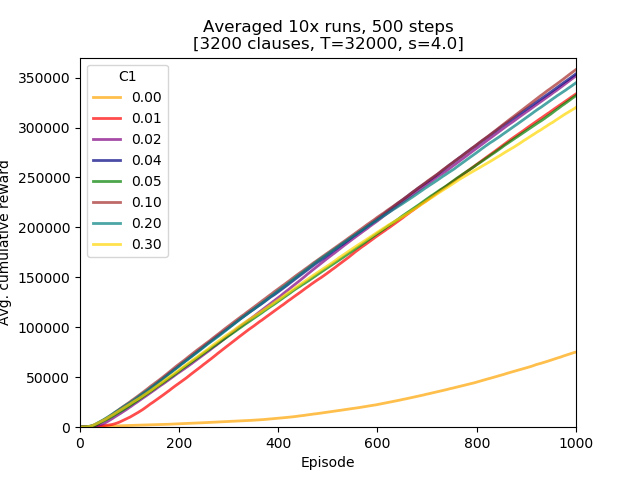
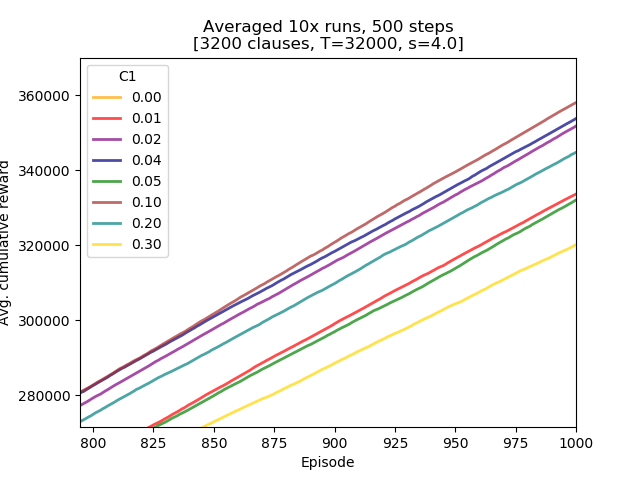
Conclusions:
- all of the L1+L2 loss experiments resulted in learning superior to bare L2 loss function (C=0),
- of the non-zero C parameter values there seems to be an optimum somewhere between 0.02 and 0.10,
- the largest tested C value (0.3) displayed some instability: one of the runs had MA(100) which dod not exceed 100.
steps_500_L12.py
#!/usr/bin/python3
# -*- coding: utf-8 -*-

import plac
import numpy as np
import pandas as pd


def main():
    df = pd.read_csv('steps_500_L12.csv', header=None, names=['C0', 'C1e-2', 'C2e-2', 'C4e-2', 'C5e-2', 'C1e-1', 'C2e-1', 'C3e-1'])

    import matplotlib.pyplot as plt

    plt.figure()

    lw = 2

    plt.plot(df.index + 1, df['C0'], lw=lw, color='orange', alpha=0.7, label='0.00')
    plt.plot(df.index + 1, df['C1e-2'], lw=lw, color='red', alpha=0.7, label='0.01')
    plt.plot(df.index + 1, df['C2e-2'], lw=lw, color='purple', alpha=0.7, label='0.02')
    plt.plot(df.index + 1, df['C4e-2'], lw=lw, color='navy', alpha=0.7, label='0.04')
    plt.plot(df.index + 1, df['C5e-2'], lw=lw, color='green', alpha=0.7, label='0.05')
    plt.plot(df.index + 1, df['C1e-1'], lw=lw, color='brown', alpha=0.7, label='0.10')
    plt.plot(df.index + 1, df['C2e-1'], lw=lw, color='teal', alpha=0.7, label='0.20')
    plt.plot(df.index + 1, df['C3e-1'], lw=lw, color='gold', alpha=0.7, label='0.30')

    plt.xlabel("Episode")
    plt.ylabel("Avg. reward")

    plt.xlim(1, 1000)
    plt.ylim(0, 500)

    plt.title("Averaged 10x runs, 500 steps\n[3200 clauses, T=80000, s=4.0, M=25000]")
    plt.legend(title='C1', loc='lower right')

    plt.show()
    return 0


if __name__ == '__main__':
    plac.call(main)
steps_500_L12_AUC.py
#!/usr/bin/python3
# -*- coding: utf-8 -*-

import plac
import numpy as np
import pandas as pd


def main():
    df = pd.read_csv('steps_500_L12.csv', header=None, names=['C0', 'C1e-2', 'C2e-2', 'C4e-2', 'C5e-2', 'C1e-1', 'C2e-1', 'C3e-1'])

    df = df.cumsum(axis=0)
    print(df.max(axis=0))

    import matplotlib.pyplot as plt

    plt.figure()

    lw = 2

    plt.plot(df.index + 1, df['C0'], lw=lw, color='orange', alpha=0.7, label='0.00')
    plt.plot(df.index + 1, df['C1e-2'], lw=lw, color='red', alpha=0.7, label='0.01')
    plt.plot(df.index + 1, df['C2e-2'], lw=lw, color='purple', alpha=0.7, label='0.02')
    plt.plot(df.index + 1, df['C4e-2'], lw=lw, color='navy', alpha=0.7, label='0.04')
    plt.plot(df.index + 1, df['C5e-2'], lw=lw, color='green', alpha=0.7, label='0.05')
    plt.plot(df.index + 1, df['C1e-1'], lw=lw, color='brown', alpha=0.7, label='0.10')
    plt.plot(df.index + 1, df['C2e-1'], lw=lw, color='teal', alpha=0.7, label='0.20')
    plt.plot(df.index + 1, df['C3e-1'], lw=lw, color='gold', alpha=0.7, label='0.30')

    plt.xlabel("Episode")
    plt.ylabel("Avg. cumulative reward")

    plt.xlim(1, 1000)
    plt.ylim(0, 370000)

    plt.title("Averaged 10x runs, 500 steps\n[3200 clauses, T=32000, s=4.0]")
    plt.legend(title='C1', loc='upper left')

    plt.show()
    return 0


if __name__ == '__main__':
plac.call(main)Location: /experiments/2020-09-15_step500_L12
Logs were created by running /experiments/run.sh script (invocation parameters hardcoded inside). Logs were transformed into CSV file with averaged runs by executing /experiments/run_csv.py:
../run_csv.py steps_500_L12.csv run_test7.log run_test6.log run_test5.log run_test4.log run_test2.log run_test6_.log run_test8.log run_test9.log
540b5cfd9cae89155e1de3028c424a14c01698d0