2020 09 27 Number of EPOCHS - WojciechMigda/TruRL GitHub Wiki
Run parameters:
Episodes: 1000
max_episode_steps: 200
Memory capacity: 10000
NEPOCHS(<#####>)
KBinsDiscretizer({
    {34, -4.800000, 4.800000},
    {34, -2.600000, 2.600000},
    {34, -0.418000, 0.418000},
    {34, -3.000000, 3.000000},})
Scaler({[0.000000, 200.000000], [0, 32000]})
TsetliniClassifierBitwise({
        "threshold": 32000,
        "s": 4.000000,
        "number_of_regressor_clauses": 3200,
        "number_of_states": 127,
        "boost_true_positive_feedback": 1,
        "random_state": 1,
        "n_jobs": 6,
        "clause_output_tile_size": 16,
        "weighted": true,
        "loss_fn": "MSE",
        "loss_fn_C1": 0.000000,
        "max_weight": 2147483647,
        "verbose": false
    })
Five values of NEPOCHS were examined: 10, 20, 30, 40, and 80.
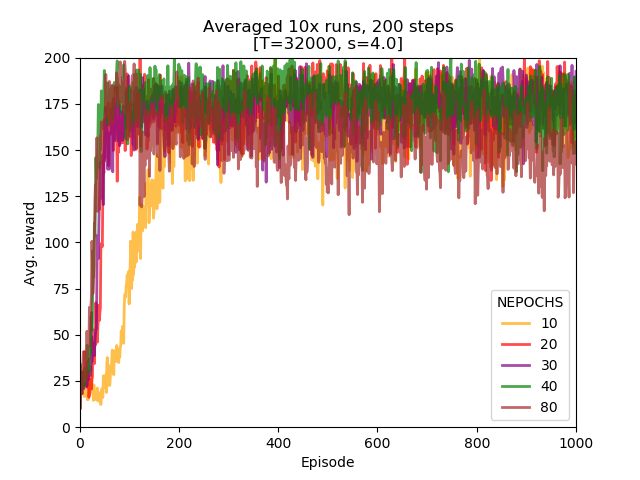
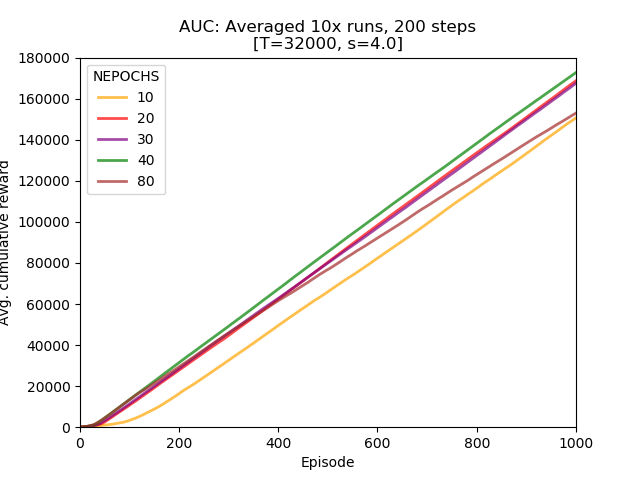
Conclusions:
- initially, the larger the number of EPOCHS, the better learning performance,
- with 80 EPOCHS learning performance of the model degrades with time (instability?),
steps_200_nepochs.py
#!/usr/bin/python3
# -*- coding: utf-8 -*-

import plac
import numpy as np
import pandas as pd


def main():
    df = pd.read_csv('steps_200_nepochs.csv', header=None, names=['10', '20', '30', '40', '80'])

    import matplotlib.pyplot as plt

    plt.figure()

    lw = 2

    plt.plot(df.index + 1, df['10'], lw=lw, color='orange', alpha=0.7, label='10')
    plt.plot(df.index + 1, df['20'], lw=lw, color='red', alpha=0.7, label='20')
    plt.plot(df.index + 1, df['30'], lw=lw, color='purple', alpha=0.7, label='30')
    plt.plot(df.index + 1, df['40'], lw=lw, color='green', alpha=0.7, label='40')
    plt.plot(df.index + 1, df['80'], lw=lw, color='brown', alpha=0.7, label='80')

    plt.xlabel("Episode")
    plt.ylabel("Avg. reward")

    plt.xlim(1, 1000)
    plt.ylim(0, 200)

    plt.title("Averaged 10x runs, 200 steps\n[T=32000, s=4.0]")
    plt.legend(title='NEPOCHS', loc='lower right')

    plt.show()
    return 0


if __name__ == '__main__':
    plac.call(main)
steps_200_nepochs_AUC.py
#!/usr/bin/python3
# -*- coding: utf-8 -*-

import plac
import numpy as np
import pandas as pd


def main():
    df = pd.read_csv('steps_200_nepochs.csv', header=None, names=['10', '20', '30', '40', '80'])

    df = df.cumsum(axis=0)
    print(df.max(axis=0))

    import matplotlib.pyplot as plt

    plt.figure()

    lw = 2

    plt.plot(df.index + 1, df['10'], lw=lw, color='orange', alpha=0.7, label='10')
    plt.plot(df.index + 1, df['20'], lw=lw, color='red', alpha=0.7, label='20')
    plt.plot(df.index + 1, df['30'], lw=lw, color='purple', alpha=0.7, label='30')
    plt.plot(df.index + 1, df['40'], lw=lw, color='green', alpha=0.7, label='40')
    plt.plot(df.index + 1, df['80'], lw=lw, color='brown', alpha=0.7, label='80')

    plt.xlabel("Episode")
    plt.ylabel("Avg. cumulative reward")

    plt.xlim(1, 1000)
    plt.ylim(0, 180000)

    plt.title("AUC: Averaged 10x runs, 200 steps\n[T=32000, s=4.0]")
    plt.legend(title='NEPOCHS', loc='upper left')

    plt.show()
    return 0


if __name__ == '__main__':
    plac.call(main)
Location: /experiments/2020-09-26_step200_nepochs
Logs were created by running /experiments/run.sh script (invocation parameters hardcoded inside). Logs were transformed into CSV file with averaged runs by executing /experiments/run_csv.py:
../run_csv.py steps_200_nepochs.csv run_test1.log run_test4.log run_test2.log run_test3.log run_test5.log
e428e944febcd243ee86688353e25926025264bb
9db0c28b43d778d9cf6225337bacb2cc65349425