2020 09 10 Threshold offset plots T=80k - WojciechMigda/TruRL GitHub Wiki
Run parameters:
Episodes: 1000
max_episode_steps: 500
KBinsDiscretizer({
    {34, -4.800000, 4.800000},
    {34, -2.600000, 2.600000},
    {34, -0.418000, 0.418000},
    {34, -3.000000, 3.000000},})
TsetliniClassifierBitwise({
        "threshold": <#####>,
        "s": 4.000000,
        "number_of_regressor_clauses": 3200,
        "number_of_states": 127,
        "boost_true_positive_feedback": 1,
        "random_state": 1,
        "n_jobs": 6,
        "clause_output_tile_size": 16,
        "weighted": true,
        "max_weight": 2147483647,
        "verbose": false
    })
Three Threshold offset values were examined: 0, 1600, and 3200.
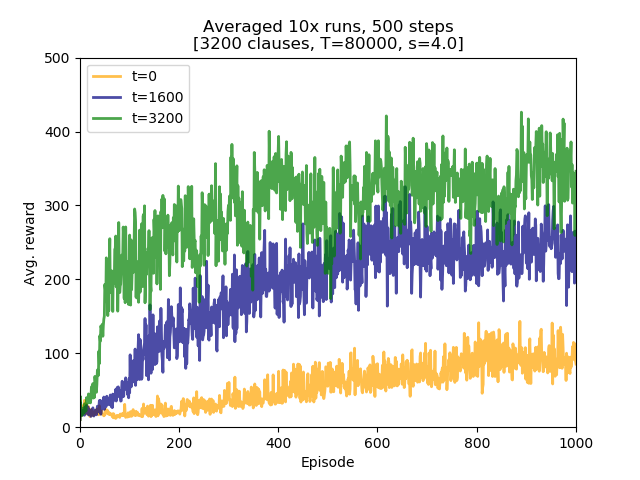
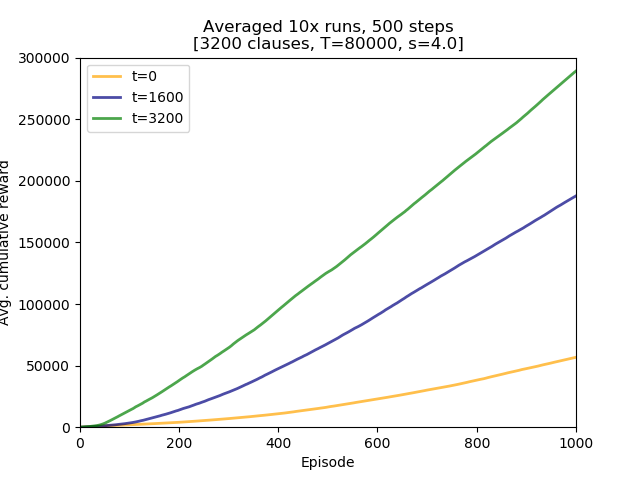
Conclusions:
- further increase of Threshold, 2.5x from 32000 to 80000, helped with learning, compared to earlier runs with both 32000 and 64000,
- using Threshold offsets boosts learning speed. This improved performance is maintained, similarly to the T=64000 runs,
- for Threshold offset value of 3200 initial learning speed resembles one observed for experiments with
max_episode_steps=200, - used parameter set is insufficient to learn the model so as it would get close to an average reward of 500.
steps_500_Toff.py
#!/usr/bin/python3
# -*- coding: utf-8 -*-

import plac
import numpy as np
import pandas as pd


def main():
    df = pd.read_csv('steps_500_Toff.csv', header=None, names=['t0', 't1600', 't3200'])

    import matplotlib.pyplot as plt

    plt.figure()

    lw = 2

    plt.plot(df.index + 1, df['t0'], lw=lw, color='orange', alpha=0.7, label='t=0')
    plt.plot(df.index + 1, df['t1600'], lw=lw, color='navy', alpha=0.7, label='t=1600')
    plt.plot(df.index + 1, df['t3200'], lw=lw, color='green', alpha=0.7, label='t=3200')

    plt.xlabel("Episode")
    plt.ylabel("Avg. reward")

    plt.xlim(1, 1000)
    plt.ylim(0, 500)

    plt.title("Averaged 10x runs, 500 steps\n[3200 clauses, T=80000, s=4.0]")
    plt.legend(loc='upper left')

    plt.show()
    return 0


if __name__ == '__main__':
    plac.call(main)
steps_500_Toff_AUC.py
#!/usr/bin/python3
# -*- coding: utf-8 -*-

import plac
import numpy as np
import pandas as pd


def main():
    df = pd.read_csv('steps_500_Toff.csv', header=None, names=['t0', 't1600', 't3200'])

    df = df.cumsum(axis=0)

    import matplotlib.pyplot as plt

    plt.figure()

    lw = 2

    plt.plot(df.index + 1, df['t0'], lw=lw, color='orange', alpha=0.7, label='t=0')
    plt.plot(df.index + 1, df['t1600'], lw=lw, color='navy', alpha=0.7, label='t=1600')
    plt.plot(df.index + 1, df['t3200'], lw=lw, color='green', alpha=0.7, label='t=3200')

    plt.xlabel("Episode")
    plt.ylabel("Avg. cumulative reward")

    plt.xlim(1, 1000)
    plt.ylim(0, 300000)

    plt.title("Averaged 10x runs, 500 steps\n[3200 clauses, T=80000, s=4.0]")
    plt.legend(loc='upper left')

    plt.show()
    return 0


if __name__ == '__main__':
plac.call(main)Location: /experiments/2020-09-09_step500_T80k_Toff
Logs were created by running /experiments/run.sh script (invocation parameters hardcoded inside). Logs were transformed into CSV file with averaged runs by executing /experiments/run_csv.py:
../run_csv.py steps_500_Toff.csv run_test3.log run_test1.log run_test2.log
4e67acb724178ee6a87b4e08d4a14fd113233293