2020 09 07 Threshold offset plots - WojciechMigda/TruRL GitHub Wiki
In case of RL initial response values that the regressor is trained with are close to 0. With high Threshold values the gradient is very small and the stochastic training employed by Tsetlin Regressor fails to pick up sufficient learning speed.
One of the solutions is to employ an offset to the discrete response values that are directly fed to the model and which are mapped from continuous response space. For instance, instead of mapping continous range of [0, 200] to discrete [0, T] one can map the target into [offset, T + offset]. With that the initial gradient will be enlarged and the initial learning rate will be boosted.
Run parameters:
Episodes: 1000
max_episode_steps: 200
KBinsDiscretizer({
    {34, -4.800000, 4.800000},
    {34, -2.600000, 2.600000},
    {34, -0.418000, 0.418000},
    {34, -3.000000, 3.000000},})
TsetliniClassifierBitwise({
        "threshold": <#####>,
        "s": 4.000000,
        "number_of_regressor_clauses": 3200,
        "number_of_states": 127,
        "boost_true_positive_feedback": 1,
        "random_state": 1,
        "n_jobs": 6,
        "clause_output_tile_size": 16,
        "weighted": true,
        "max_weight": 2147483647,
        "verbose": false
    })
Four Threshold offset values were examined: 0, 400, 800, and 1600.
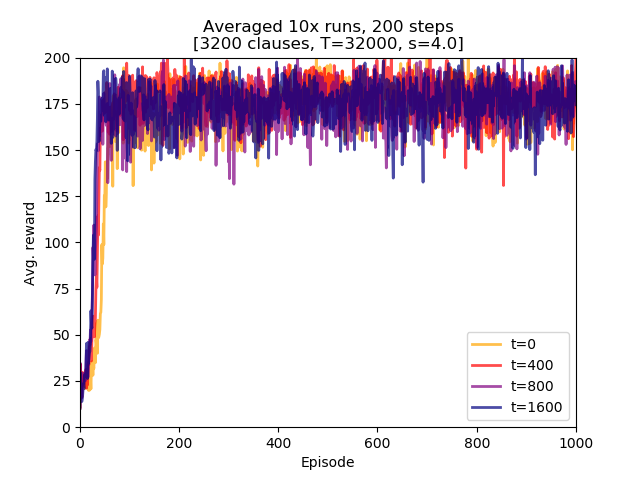
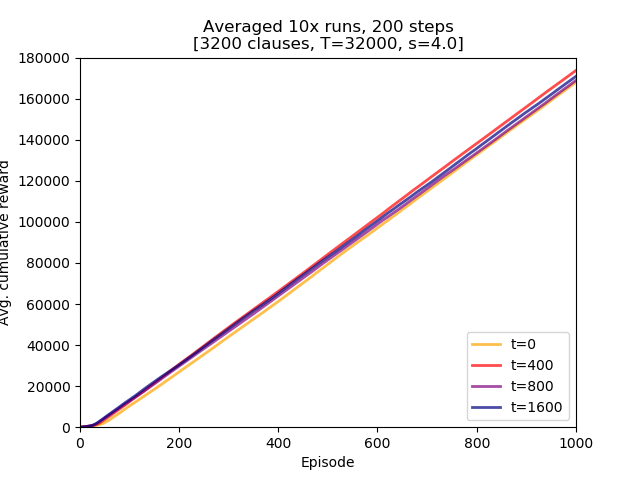
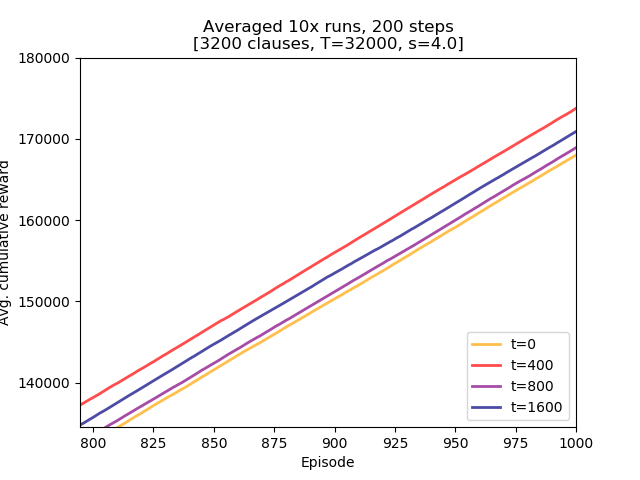
Conclusions:
- Threshold offset did not lead to a degraded learning performance. While in this setting it might not be of direct importance it might be a factor in future experiments with larger
max_episode_stepsvalues, - there does not seem to be obvious ordering of performance. The top two learners used Threshold offset of 0 and 1600.
- using Threshold offset has an impact on initial learning speed. All non-zero values lead to the model attaining higher rewards earlier than the one with zero offset. The differences are small but they confirm initial assumption.
steps_200_Toff.py
#!/usr/bin/python3
# -*- coding: utf-8 -*-

import plac
import numpy as np
import pandas as pd


def main():
    df = pd.read_csv('steps_200_Toff.csv', header=None, names=['t0', 't400', 't800', 't1600'])

    import matplotlib.pyplot as plt

    plt.figure()

    lw = 2

    plt.plot(df.index + 1, df['t0'], lw=lw, color='orange', alpha=0.7, label='t=0')
    plt.plot(df.index + 1, df['t400'], lw=lw, color='red', alpha=0.7, label='t=400')
    plt.plot(df.index + 1, df['t800'], lw=lw, color='purple', alpha=0.7, label='t=800')
    plt.plot(df.index + 1, df['t1600'], lw=lw, color='navy', alpha=0.7, label='t=1600')

    plt.xlabel("Episode")
    plt.ylabel("Avg. reward")

    plt.xlim(1, 1000)
    plt.ylim(0, 200)

    plt.title("Averaged 10x runs, 200 steps\n[3200 clauses, T=32000, s=4.0]")
    plt.legend(loc='lower right')

    plt.show()
    return 0


if __name__ == '__main__':
    plac.call(main)
steps_200_Toff_AUC.py
#!/usr/bin/python3
# -*- coding: utf-8 -*-

import plac
import numpy as np
import pandas as pd


def main():
    df = pd.read_csv('steps_200_Toff.csv', header=None, names=['t0', 't400', 't800', 't1600'])

    df = df.cumsum(axis=0)

    import matplotlib.pyplot as plt

    plt.figure()

    lw = 2

    plt.plot(df.index + 1, df['t0'], lw=lw, color='orange', alpha=0.7, label='t=0')
    plt.plot(df.index + 1, df['t400'], lw=lw, color='red', alpha=0.7, label='t=400')
    plt.plot(df.index + 1, df['t800'], lw=lw, color='purple', alpha=0.7, label='t=800')
    plt.plot(df.index + 1, df['t1600'], lw=lw, color='navy', alpha=0.7, label='t=1600')

    plt.xlabel("Episode")
    plt.ylabel("Avg. cumulative reward")

    plt.xlim(1, 1000)
    plt.ylim(0, 180000)

    plt.title("Averaged 10x runs, 200 steps\n[3200 clauses, T=32000, s=4.0]")
    plt.legend(loc='lower right')

    plt.show()
    return 0


if __name__ == '__main__':
plac.call(main)Location: /experiments/2020-09-07_step200_Toff
Logs were created by running /experiments/run.sh script (invocation parameters hardcoded inside). Logs were transformed into CSV file with averaged runs by executing /experiments/run_csv.py:
../run_csv.py steps_200_Toff.csv run_test4.log run_test5.log run_test6.log run_test7.log
2bef692f683c204cced4677091556164532710cb